United States Department of Agriculture National Agricultural Statistics Service
Crop News Release
In Cooperation with the Georgia Department of Agriculture
Georgia Field Office 355 East Hancock Avenue, Suite 320 Athens, GA 30601 (706) 546-2236
www.nass.usda.gov
September 10, 2010
Media Contact: Douglas G. Kleweno
nass-ga@nass.usda.gov
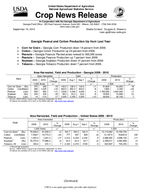
Georgia Peanut and Cotton Production Up from Last Year
Corn for Grain Georgia Corn Production down 18 percent from 2009. Cotton Georgia Cotton Production up 24 percent from 2009. Peanuts Georgia Peanuts Planted acres revised to 565,000 acres. Peanuts Georgia Peanuts Production up 7 percent from 2009 Soybean Georgia Soybean Production down 31 percent from 2009. Tobacco Georgia Tobacco Production down 7 percent from 2009.
Area Harvested, Yield and Production - Georgia 2009 - 2010
Area Harvested
Yield
State
2009
2010
% Change
2009
Aug 1 Sep 1
1,000 Acres
+/-
Corn for Grain (Bu)
370 300
-19 140.0 138.0 142.0
Cotton (Lbs/Bales) 990 1,325
+34 902.0 852.0 833.0
Peanuts
(Lbs)
505 560
+11 3,530 3,300 3,400
Soybean
(Bu)
440 330
-25 36.0 34.0 33.0
Tobacco
(Lbs)
14 11.6
-17 2,000 2,250 2,250
Source: USDA-NASS, August Crop Production, September 10, 2010. All reports are available, at no cost, on the NASS web site: http://www.nass.usda.gov
% Change
+/+1 -8 -4 -8
+13
Production
2009
2010
1,000
51,800
42,600
1,860
2,300
1,782,650 1,904,000
15,840
10,890
28,000
26,100
% Change
+/-18 +24 +7 -31 -7
Area Harvested, Yield and Production United States 2009 - 2010
Area Harvested
Yield
Production
State
2009
2010
% Change
2009
Aug 1 Sep 1
% Change
2009
2010
Corn for Grain1/ (Bu)
1,000 Acres 79,590.0 81,005.0
+/+2 164.7 165.0 162.5
+/-
1,000
-1 13,110,062 13,159,700
Cotton (Lbs/Bales)
7,528.7 10,773.0
+43 777 837 839
+8
12,187.5
18,840.8
Peanuts Soybean1/
(Lbs) (Bu)
1,081.0 1,261.0 76,372.0 77,986.0
+17 3,412 3,204 3,242 +2 44.0 44.0 44.7
-5 3,688,350 4,088,100 +2 3,359,011 3,482,899
Tobacco, All (Lbs)
354.2
331.1
-7 2,322 2,210 2193
-6
822,567
726,253
1/ Record high production. Source: USDA-NASS, August Crop Production, September 10, 2010. All reports are available, at no cost, on the NASS web site: http://www.nass.usda.gov
% Change
+/-
+55 +11
+4 -12
(Continued)
USDA is an equal opportunity provider and employer.
950 900 850 800 750 700
720
650 600 550 500
2001
557
2002
Georgia Cotton Yield
(Pounds)
849 818
785
674
2003
2004
2005
2006
801
2007
835
2008
902
2009
833
2010
3700 3500 3300 3100 2900 2700 2500
3330
2001
2600
2002
Georgia Peanut Yield
(Pounds)
3450
2980
2840
2780
3120
2003
2004
2005
2006
2007
3400
2008
3530
2009
3400
2010
38
36
34
32
30
28
26
24
26
22
20
2001
23
2002
Georgia Soybean Yield
(Bushels)
34
31 30
26 25
2003
2004
2005
2006
2007
31
2008
36
2009
33
2010
