- Collection:
- Georgia Government Publications
- Serial:
- Georgia farm report.
- Title:
- Georgia farm report, vol. 10, no. 02 (2010 February 26)
- Creator:
- Georgia. Department of Agriculture
- Contributor to Resource:
- United States. Department of Agriculture
United States. National Agricultural Statistics Service
United States. National Agricultural Statistics Service. Georgia Office - Publisher:
- Athens, Ga. : United States Department of Agriculture, National Agricultural Statistics Service, in cooperation with the Georgia Department of Agriculture, Georgia Field Office
- Date of Original:
- 2010-02-26
- Subject:
- Agricultural productivity--Georgia--Statistics
Crop yields--Georgia--Statistics - Location:
- United States, Georgia, 32.75042, -83.50018
- Medium:
- state government records
- Type:
- Text
- Format:
- application/pdf
- Description:
- Began in 1975?; ceased with vol. 10, no. 02 (Feb. 26, 2010).
"Agricultural statistician and Georgia Department of Agriculture."
Numbering began again with Vol. 11, no. 1 (Jan. 14, 2000).
Vols. for Aug. 31, 2005- issued by: USDA-NASS Georgia Field Office.
Description based on: Vol. 94, no, 1 (Jan. 4, 1994); title from caption.
Latest issue consulted: Vol. 10, no. 02 (Feb. 26, 2010). - External Identifiers:
- Call Number GA A400.C7 P1 F2 2010/2
- Metadata URL:
- https://dlg.galileo.usg.edu/id:dlg_ggpd_i-ga-ba400-pc7-bp1-bf2-b2010-s2-belec-p-btext
- Digital Object URL:
- https://dlg.galileo.usg.edu/do:dlg_ggpd_i-ga-ba400-pc7-bp1-bf2-b2010-s2-belec-p-btext
- Language:
- eng
- Holding Institution:
- University of Georgia. Map and Government Information Library
- Rights:
-

United States Department of Agriculture National Agricultural Statistics Service
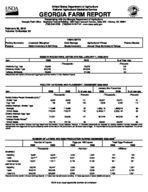
GEORGIA FARM REPORT
Cooperating with the Georgia Department of Agriculture Georgia Field Office Stephens Federal Building 355 East Hancock Avenue, Suite 320 Athens, GA 30601
(706) 546-2236 (706)546-2416 FAX www.nass.usda.gov
February 26, 2010 Volume 10-Number 02
Poultry Summary Pecans
Livestock Slaughter Cattle Inventory & Calf Crop
HIGHLIGHTS Cold Storage Goats Inventory
Agricultural Prices
Peanut Stocks
Annual Crop Summary & Values
EGGS IN INCUBATORS, UNITED STATES--JANUARY 1, 2009-2010
Item
2009
2010
--Thousands--
Chickens, Egg Type
36,665
Chickens, Broiler Type
630,209
Turkeys, All Breeds
29,664
[Results from the monthly Chicken and Egg Report and the monthly Turkey Hatchery Report].
38,929 632,926
27,499
% of Year Ago
--Percent-106 100 93
POULTRY HATCHING AND PLACEMENT-- DECEMBER 2008-2009
January thru December
Item
2008
2009
% of year ago
2008
2009
% of year ago
Pullet Chicks Placed Domestic (U.S.)1/
--Thousands--
--Percent--
--Thousands--
--Percent--
Broiler Type
6,580
6,656
101
85,821
83,231
97
Egg Type
199
309
155
2,958
3,405
115
Chicks Hatched - Broiler Type
Georgia
117,499
114,450
97
1,438,110
1,368,319
95
United States
779,304
778,372
100
9,455,917
9,086,142
96
Chicks Hatched- Egg Type
United States Turkeys Poults Placed2/
37,091
39,655
107
467,242
462,330
99
United States
23,179
22,108
95
88,561
85,257
96
Results from the monthly Chicken and Egg Report and the monthly Turkey Hatchery Report]. 1/ Domestic placements as reported by leading breeders includes expected pullet replacements from eggs sold during the preceding month at the rate of 125 pullet chicks per 30 dozen case of eggs. 2/ Accumulated turkey poults placed are September 1 to current month.
NUMBER OF LAYERS AND EGG PRODUCTION DURING DECEMBER 2008-20091/
Number of Layers
Eggs per 100 Layers
Total Eggs Produced
2008
2009
2008
2009
2008
2009
--Thousands--
--Number--
--Millions--
GEORGIA
Hatching Table
8,662 9,677 2/
8,542 9,225 2/
1,940 2,301
1,967 2,404
167
168
224
223
Total Georgia
18,391
17,817
2,126
2,195
391
391
UNITED STATES
Hatching
56,028
56,447
1,906
1,890
1,068
1,067
Table
284,274
283,435
2,357
2,386
6,701
6,763
Total U.S.
340,302
339,882
2,283
2,304
7,768
[Results from the monthly Chicken and Egg Report]. 1/ Totals may not add due to rounding. 2/ Table egg layers in flocks 30,000 and above.
7,831
USDA is an equal opportunity provider and employer.
COMMERCIAL POULTRY SLAUGHTER1/--NOVEMBER AND DECEMBER 2009
Item
Nov
Dec
% of Last Month
--Thousands--
--Percent--
Young Chickens
Georgia
93,260
98,989
106
United States
657,072
699,854
107
Mature Chickens
Light Type, U.S.
4,186
5,755
137
Heavy Type, U.S.
5,153
5,406
105
Total U.S.
9,339
11,161
120
Percent Condemned Young Chickens Georgia
--Percent--
0.64
0.74
United States
0.82
1/ Federally inspected slaughter data as collected by Meat and Poultry Inspection Program.
0.83
January to Date --Thousands--
1,228,531 8,516,891
63,576 75,061 138,637 --Percent--
0.71 0.88
LIVESTOCK SLAUGHTER--UNITED STATES,1/ DECEMBER 2008, 2009
Number Slaughtered
Average Live Weight
Total Live Weight
Species
2008
2009
2009 as % of 2008
2008
2009
2008
2009
--Thousand Head--
--Percent--
--Pounds--
--Thousand Pounds--
Cattle
2,671.5
2,752.8
103
1,303
1,296
3,468,180
3,556,432
Calves
94.1
92.3
98
245
240
22,713
21,904
Hogs
10,144.9
9,832.9
97
270
270
2,739,561
2,653,968
Sheep & Lambs
230.9
235.3
102
134
136
30,876
[Results form the U.S. Livestock Slaughter release]. 1/ Includes slaughter under Federal Inspection and other commercial slaughter, excludes farm slaughter.
31,853
COLD STORAGE STOCKS--UNITED STATES, DECEMBER 30, 2009
Commodity
Dec 31, 2008
Nov 30, 2009
Dec 31, 2009
% Dec of 2008
% of Nov 2009
Eggs, Frozen
22,638
--Thousand Pounds-21,158
24,347
--Percent--
108
115
Meats, Red Beef, Frozen
1,078,474 492,637
936,835 430,913
927,938 429,715
86
99
87
100
Pork, Frozen Poultry, Frozen Peanuts, Shelled
555,642 1,163,579
266,624
482,816 898,313 376,698
474,845 884,912 387,012
85
98
76
99
145
103
Peanuts, In Shell
19,762
17,494
18,097
92
103
Pecans, Shelled
36,992
Pecans, In Shell
85,806
[Results from the monthly Cold Storage Report].
27,722 48,866
28,837 88,586
78
104
103
181
PRICES RECEIVED BY FARMERS--JANUARY 15, 2010
Georgia
United States
Commodity
Price per Unit Jan 2009
Dec 2009
Jan 15, 2010
Jan 2009
Dec 2009
Cotton
/Lb
48.50
65.80
61.90
46.00
62.80
Cottonseed
$/Ton
191.00
126.00
127.00
214.00
164.00
Peanuts, In Shell
/Lb
23.20
19.10
20.00
23.90
21.50
Calves Beef Cattle1/
Cows2/
/Lb /Lb /Lb
92.10 59.40 48.40
92.80 55.70 46.10
95.00 59.60 50.40
106.00 80.10 42.30
105.00 78.60 43.50
Steers & Heifers
/Lb
78.10
77.20
81.20
85.80
83.80
[Results from the monthly Prices Received by Farmers]. 1/ "Cows," "Steers and Heifers" combined. 2/ Beef cows and cull dairy cows sold for slaughter.
Jan 15, 2010 63.20 149.00 20.60 109.00 81.90 47.10 87.00
2
INDEX NUMBERS--UNITED STATES, 2008-2010
Index
2008
2009
1990-92=100
Dec
Jan
Dec
Prices Received
135
139
135
Prices Paid Ratio1/
179
180
179
75
77
75
[Results from the monthly Prices Received by Farmers]. 1/ Ratio of index of prices received by farmers to index of prices paid.
2010 Jan 137 183
75
STOCKS OF PEANUTS AND SPECIFIED PRODUCTS AT MONTH'S END, UNITED STATES--20091/
Month Ending
Farmer Stock
Shelled Peanuts2/ Roasting Stock (In Shell)
Farmer Stock Equivalent
Shelled Peanuts
Total3/
--Thousand Pounds--
Dec
3,038,106
590,381
49,476
785,207
3,872,789
[Results from the Peanut Stocks and Processing Report]. 1/ Excludes stocks on farms. Includes stocks owned by or held for account of CCC in commercial storage facilities. Farmer stock on net weight basis. 2/ Includes shelled edible grades, shelled oil stock, and shelled seed (untreated). 3/ Actual farmer stock, plus roasting stock, plus shelled peanuts X 1.33.
ALL PECANS: UTILIZED PRODUCTION, PRICE PER POUND, VALUE OF PRODUCTION, GEORGIA AND UNITED STATES, 2007-2009
Utilized Production
Price per Pound
Value of Production
State
2007
2008
2009
2007
2008
2009
2007
2008
2009
--1,000 Pounds--
--Dollars--
--1,000 Dollars--
GA
150,000
70,000
85,000
1.060
1.440
1.320
159,300
101,020
112,400
US
387,305
194,080
[Results from the January 1 Pecan Inquiry].
290,500
1.120
1.340
1.370
433,644
260,397
397,979
CATTLE AND CALVES: NUMBER BY CLASS AND CALF CROP, GEORGIA AND UNITED STATES, JANUARY 1, 2009-20101/
Georgia
United States
Class
2009
2010
2010 as % of 2009
2009
2010
2010 as % of 2009
--1,000 Head--
--Percent--
--1,000 Head--
--Percent--
Cattle and Calves
1,110
1,060
95
94,521
93,701
99
Cows and Heifers That Have Calved
610
600
98
41,045
40,456
99
Beef Cows
536
524
98
31,712
31,376
99
Milk Cows
74
76
103
9,333
9,081
97
Heifers 500 Pounds and Over
127
132
104
19,576
19,666
100
For Beef Cow Replacement
73
68
93
5,531
5,436
98
Expected to Calve For Milk Cow Replacement
Expected to Calve Other Heifers
2/
2/
2/
3,367
3,385
101
23
25
109
4,410
4,516
102
2/
2/
2/
2,909
2,941
101
31
39
126
9,635
9,714
101
Steers 500 Pounds and Over
48
39
81
16,769
16,440
98
Bulls 500 Pounds and Over
35
29
83
2,184
2,190
100
Calves Under 500 Pounds
290
260
90
14,948
14,949
100
Cattle on Feed
3/
3/
3/
13,856
13,642
98
2008
2009
2009 as % of 2008
2008
2009
2009 as % of 2008
Calf Crop
510
500
98
36,153
35,819
99
[Results from the Cattle Report]. 1/ Totals may not add due to rounding. 2/ Data not available. 3/ Other States include AL, AK, CT, DE, FL, GA, HI, LA, ME, MA, MS, NH, NJ, RI, SC,
and VT.
ANGORA GOATS, MILK GOATS, MEAT AND OTHER GOATS AND TOTAL: NUMBER BY CLASS, GEORGIA AND UNITED STATES, JANUARY 1, 2009-2010
State
Angora
2009
2010
Milk
2009
2010
Meat and Other Goats
2009
2010
All Goats
2009
2010
GA
1/
1/
4,500
US
185,000
150,000
335,000
[Results from the Sheep and Goats Report]. 1/ Data not published.
--Head--
3,000
80,500
355,000
2,549,000
79,000 2,538,000
1/ 3,069,000
1/ 3,043,000
3
GEORGIA ANNUAL CROP SUMMARY, 2009
Crop
Planted Acres Harvested Acres Yield per Acre Unit
Production
Unit Price Value of Production
--1,000 Acres--
--1,000--
--Dollars--
--$1,000--
Corn, grain
420
370
140
Bu
51,800
3.60
186,480
Corn, silage
30
17.0
Ton
510
Cotton, lint
1,000.0
990.0
882
1/
1,820.0
0.652
569,587
Cottonseed
Ton
553
125.00
69,125
Hay
700
2.30
Ton
1,610
85.00
136,850
Oats
60
20
56.0
Bu
1,120
2.00
2,240
Peanuts
510
505
3,530
Lb
1,782,650
0.219
390,400
Rye
200
25
21.0
Bu
525
6.50
Sorghum, Grain2/
55
40
53.0
Bu
2,120
5.40
3,413 6,411
Sorghum, Silage
12
11.0
Ton
132
Soybeans
470
450
36.0
Bu
16,200
9.50
153,900
Tobacco
14.0
2,000
Lb
28,000
1.700
47,600
Wheat
340
250
Blueberries5/
10.5
Grapes3/4/
1.4
Peaches3/4/
10.5
42.0 4,100
3.21 3.05
Bu
10,500
4.30
Lb
43,000
1.290
Ton
4.5
1,480.00
Ton
32
930.00
45,150 55,600
6,645 27,890
Pecans
Lb
85,000
1.320
112,400
Cabbage
6.9
6.3
300
Cwt
1,890
14.80
27,972
Cantaloups
5.2
5.0
275
Cwt
1,375
28.50
39,188
Cucumbers
11.5
10.0
250
Cwt
2,500
23.60
59,000
Onions
12.0
10.5
240
Cwt
2,520
32.90
82,908
Sweet Corn
26.0
25.0
130
Cwt
3,250
26.20
85,150
Tomatoes
4.6
4.5
280
Cwt
1,260
49.40
62,244
Watermelons
24.0
23.0
300
Cwt
6,900
9.80
67,620
Bell Pepper
3.7
3.5
280
Cwt
980
35.50
34,790
Squash
5.5
5.3
200
Cwt
1,060
28.20
29,892
Total
3,154.4
3,521.5
2,302,455.0
1/ Cotton yield pounds per acre; production 480 lb. bales. 2/ Price is per cwt. 3/ Bearing age acreage and utilized production. 4/ Yield based on total
production. 5/ Yield based on utilized production.
SPRING ONIONS--PLANTING INTENTIONS AND PROSPECTIVE ACRES FOR HARVEST,1/ GEORGIA AND TOTAL
Planted
Harvested
For Harvest
State
2008
2009
2010
2008
2009
2010
--Acres--
GA Total2/
12,000 31,200
12,000 30,100
12,000 28,000
11,500 28,400
10,500 27,200
11,500
[Results from the Onions Acreage Intentions]. 1/ Primarily fresh market. 2/ Harvested acreage for 2010 will be published April 1, 2010.