United States Department of Agriculture National Agricultural Statistics Service
Crop News Release
In Cooperation with the Georgia Department of Agriculture
Georgia Field Office 355 East Hancock Avenue, Suite 320 Athens, GA 30601 (706) 546-2236
www.nass.usda.gov
October 8, 2010
Media Contact: Douglas G. Kleweno
nass-ga@nass.usda.gov
Georgia Crop Yields down from September Forecast
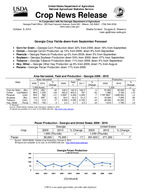
Corn for Grain Georgia Corn Production down 32% from 2009; down 18% from September. Cotton Georgia Cotton Production up 13% from 2009; down 9% from September. Peanuts Georgia Peanuts Production up 3% from 2009; down 3% from September. Soybean Georgia Soybean Production down 50% from 2009; down 27% from September. Tobacco Georgia Tobacco Production down 11% from 2009; down 4% from September. Hay, Other Georgia Other Hay Production up 9% from 2009; down 7% from August. Pecans Georgia Pecan Production down 17% from 2009.
Area Harvested, Yield and Production - Georgia 2009 - 2010
Area Harvested
Yield
State
2009
2010
% Change
2009
Sept 1
Oct 1
Corn for Grain (Bu)
1,000 Acres 370 2501/
+/-32
140.0 142.0 140.0
Cotton (Lbs/Bales)
Peanuts
(Lbs)
Soybean
(Bu)
990 1,325 505 560 440 2551/
+34 902.0 833.0 761 +11 3,5601/ 3,400 3,300
-42
36.0 33.0 31.0
Tobacco
(Lbs)
14 11.6
-17 2,000 2,250 2,150
Hay, Other (Tons) 700 700
0
2.3
2.7
2.5
1/ Revised. Source: USDA-NASS, October Crop Production, October 8, 2010. All reports are available, at no cost, on the NASS web site: http://www.nass.usda.gov
% Change
+/0
-16 -7
-14 +8 +9
Production
2009
2010
1,000
51,800
35,000
1,860
2,100
1,797,8001/ 1,848,000
15,840
7,905
28,000
24,940
1,610
1,750
% Change
+/-32 +13 +3 -50 -11 +9
Pecan Production - Georgia and United States 2009 - 2010
Georgia
United States
Crop
2009
2010 % Change 2009
2010
% Change
1,000 (Pounds)
+/-
1,000 (Pounds)
+/-
Pecan
90,000 75,000
-17 291,830 271,300
-7
Source: USDA-NASS, October Crop Production, October 8, 2010. All reports are available, at no cost, on the NASS web site: http://www.nass.usda.gov
Georgia Pecan Production
200
(1,000,000 Pounds)
150
100
150
110
50
75
80
90
70
75
0
45
45
42
2001 2002 2003 2004 2005 2006 2007 2008 2009 2010
(Continued)
USDA is an equal opportunity provider and employer.
Area Harvested, Yield and Production United States 2009 - 2010
Area Harvested
Yield
Production
State
2009
2010
% Change
2009
Sept 1
Oct 1
% Change
2009
2010
Corn for Grain (Bu)
1,000 Acres 79,590.0 81,263.01/
+/+2
164.7
162.5 155.8
+/-
1,000
-5 13,110,062 12,663,949
Cotton (Lbs/Bales)
Peanuts Soybean2/
(Lbs) (Bu)
Tobacco, All (Lbs)
7,528.7 1,079.01/ 76,372.0
354.2
10,773.0
1,261.0 76,823.01/
338.01/
+43
777
+17 3,4211/
+1 44.0
-5 2,322
839 3,242
44.7 2,193
841 3,106
44.4 2,110
+8
12,187.5
-9 3,691,6501/
+1 3,359,011
-9
822,567
18,872.8 3,916,200 3,408,211
713,033
Hay, Other (Tons)
38,528
38,924
+1
1.98
2.09 2.08
+5
76,412
80,952
1/ Revised. 2/ Record high production. Source: USDA-NASS, October Crop Production, October 8, 2010. All reports are available, at no cost, on the NASS web site: http://www.nass.usda.gov
% Change
+/-3
+55 +6 +1 -13 +6
950 900 850 800 750 700
720
650 600 550 500
2001
557
2002
785
2003
Georgia Cotton Yield
(Pounds)
849 818 801
674
2004
2005
2006
2007
835
2008
902
2009
761
2010
3700 3500 3300 3100 2900 2700 2500
3330
2001
2600
2002
3450
2003
Georgia Peanut Yield
(Pounds)
2980
2840
2780
3120
2004
2005
2006
2007
3400
2008
3560
2009
3300
2010
