- Collection:
- Georgia Government Publications
- Serial:
- Georgia farm report.
- Title:
- Georgia farm report, vol. 09, no. 06 (2009 June 30)
- Creator:
- Georgia. Department of Agriculture
- Contributor to Resource:
- United States. Department of Agriculture
United States. National Agricultural Statistics Service
United States. National Agricultural Statistics Service. Georgia Office - Publisher:
- Athens, Ga. : United States Department of Agriculture, National Agricultural Statistics Service, in cooperation with the Georgia Department of Agriculture, Georgia Field Office
- Date of Original:
- 2009-06-30
- Subject:
- Agricultural productivity--Georgia--Statistics
Crop yields--Georgia--Statistics - Location:
- United States, Georgia, 32.75042, -83.50018
- Medium:
- state government records
- Type:
- Text
- Format:
- application/pdf
- Description:
- Began in 1975?; ceased with vol. 10, no. 02 (Feb. 26, 2010).
"Agricultural statistician and Georgia Department of Agriculture."
Numbering began again with Vol. 11, no. 1 (Jan. 14, 2000).
Vols. for Aug. 31, 2005- issued by: USDA-NASS Georgia Field Office.
Description based on: Vol. 94, no, 1 (Jan. 4, 1994); title from caption.
Latest issue consulted: Vol. 10, no. 02 (Feb. 26, 2010). - External Identifiers:
- Call Number GA A400.C7 P1 F2 2009/6
- Metadata URL:
- https://dlg.galileo.usg.edu/id:dlg_ggpd_i-ga-ba400-pc7-bp1-bf2-b2009-s6-belec-p-btext
- Digital Object URL:
- https://dlg.galileo.usg.edu/do:dlg_ggpd_i-ga-ba400-pc7-bp1-bf2-b2009-s6-belec-p-btext
- Language:
- eng
- Holding Institution:
- University of Georgia. Map and Government Information Library
- Rights:
-

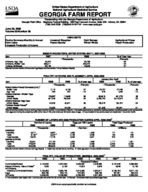
United States Department of Agriculture National Agricultural Statistics Service
GEORGIA FARM REPORT
Cooperating with the Georgia Department of Agriculture Georgia Field Office Stephens Federal Building 355 East Hancock Avenue, Suite 320 Athens, GA 30601
(706) 546-2236 (706)546-2416 FAX www.nass.usda.gov
June 30, 2009 Volume 09-Number 06
Poultry Summary-Monthly & Annual Farm Labor Livestock Production & Income
HIGHLIGHTS Livestock Slaughter Peanut Stocks
Cold Storage Winter Wheat
Agricultural Prices Peach Production
EGGS IN INCUBATORS, UNITED STATES--MAY 1, 2007-2008
Item
2007
2008
--Thousands--
Chickens, Egg Type Chickens, Broiler Type Turkeys, All Breeds
40,422 668,011
33,149
35,766 628,222
28,946
[Results from the monthly Chicken and Egg Report and the monthly Turkey Hatchery Report].
% of Year Ago
--Percent--
88 94 87
POULTRY HATCHING AND PLACEMENT--APRIL 2008-2009
January thru April
Item
2008
2009
% of year ago
2008
2009
% of year ago
Pullet Chicks Placed Domestic (U.S.)1/
--Thousands--
--Percent--
--Thousands--
--Percent--
Broiler Type
7,119
6,158
87
28,757
27,288
95
Egg Type
264
307
116
978
1,080
110
Chicks Hatched - Broiler Type
Georgia
120,937
112,662
93
494,919
461,778
93
United States
801,548
755,862
94
3,239,745
3,018,524
93
Chicks Hatched- Egg Type
United States Turkeys Poults Placed2/
42,329
40,621
96
163,073
155,702
95
United States
25,880
24,253
94
201,609
182,841
91
Results from the monthly Chicken and Egg Report and the monthly Turkey Hatchery Report]. 1/ Domestic placements as reported by leading breeders includes expected pullet replacements from eggs sold during the preceding month at the rate of 125 pullet chicks per 30 dozen case of eggs. 2/ Accumulated turkey poults placed are September 1 to current month.
NUMBER OF LAYERS AND EGG PRODUCTION DURING APRIL 2008-20091/
Number of Layers
Eggs per 100 Layers
Total Eggs Produced
2008
2009
2008
2009
2008
2009
--Thousands--
--Number--
--Millions--
GEORGIA Hatching Table Total Georgia
9,517 9,106 2/ 18,673
8,687 9,042 2/ 17,779
1,860 2,163 2,008
1,853 2,299 2,081
177
161
198
209
375
370
UNITED STATES Hatching Table Total U.S.
60,901 279,937 340,838
57,184 282,456 339,640
1,834 2,235 2,163
1,838 2,269 2,196
1,117 6,256 7,373
1,051 6,408 7,459
[Results from the Monthly Chicken and Egg Report]. 1/ Totals may not add due to rounding. 2/ Table egg layers in flocks 30,000 and above.
POULTRY--VALUE OF PRODUCTION, GEORGIA, 2003-20081/
2003
2004
2005
2006
--Thousand Dollars--
Commercial Broilers Mature Chickens, Value of Sales3/
All Chickens,
2,142,850 7,806
2,857,580 8,168
2,903,532 12,054
2,543,688 8,929
Including Commercial Broilers Eggs
2,150,656 395,769
2,865,748 394,120
2,915,586 347,680
2,552,617 368,736
All Poultry
2,546,425
3,259,868
3,263,266
2,921,353
1/ The production year begins Dec 1 previous year and ends Nov 30 current year. 2/ Revised. 3/ Includes hatching and table egg flocks.
20072/
3,187,848 8,946
3,196,794 437,491
3,634,285
2008
3,360,960 10,180
3,371,140 564,244
3,935,384
USDA is an equal opportunity provider and employer.
COMMERCIAL POULTRY SLAUGHTER1/-- MARCH AND APRIL 2009
Item
Mar
Apr
% of Last Month
--Thousands--
--Percent--
Young Chickens
Georgia
109,486
108,451
99
United States
727,605
721,352
99
Mature Chickens
Light Type, U.S.
5,168
5,296
81
Heavy Type, U.S.
6,601
6,752
97
Total U.S.
11,769
12,048
89
Percent Condemned Young Chickens
--Percent--
Georgia
0.89
0.76
United States
0.96
1/ Federally inspected slaughter data as collected by Meat and Poultry Inspection Program.
0.89
January to Date --Thousands--
416,426 2,800,933
20,161 24,846 45,007
--Percent--
0.86 0.98
LIVESTOCK SLAUGHTER--UNITED STATES,1/ APRIL 2008, 2009
Number Slaughtered
Average Live Weight
Total Live Weight
Species
2008
2009
2009 as % of 2008
2008
2009
2008
2009
Cattle Calves Hogs
--Thousand Head--
2,961.1
2,772.1
73.3
68.0
9,996.0
9,431.1
--Percent--
94 93 94
--Pounds--
1,259
1,276
278
281
269
272
--Thousand Pounds--
3,716,023
3,525,518
20,133
18,883
2,690,357
2,564,114
Sheep & Lambs
221.2
229.1
104
138
135
30,572
30,822
[Results form the U.S. Livestock Slaughter release]. 1/ Includes slaughter under Federal Inspection and other commercial slaughter, excludes farm slaughter.
PER CAPITA CONSUMPTION, RETAIL WEIGHT1/
Per capita consumption, Retail Lb.
2007
--Pounds--
Beef
65.2
Pork
50.8
Broilers
85.4
Turkeys
17.5
Total Red Meat & Poultry
221.6
Eggs, Number
250.1
1/ Livestock, Dairy and Poultry Outlook, May 19, 2009, LDP-M-179, Economic Research Service, USDA.
2008
62.8 49.5 83.5 17.6 216.1 248.9
COLD STORAGE STOCKS--UNITED STATES, APRIL 30, 2009
Commodity
Apr 30, 2008
Mar 31, 2009
Apr 30, 2009
% of Apr 2008
% of Mar 2009
Eggs, Frozen Meats, Red
16,034 1,103,911
Beef, Frozen Pork, Frozen Poultry, Frozen Peanuts, Shelled Peanuts, In Shell Pecans, Shelled Pecans, In Shell
416,354 663,443 1,247,505 347,491
20,207 47,175 204,857
[Results from the monthly Cold Storage Report].
--Thousand Pounds--
20,343 1,045,263
425,878 594,127 1,153,158 345,223
23,440 45,889 116,086
18,467 1,053,173
410,899 614,666 1,246,125 332,170
28,724 47,313 94,304
--Percent--
115
91
95
101
99
96
93
103
100
108
96
96
142
123
100
103
46
81
PRICES RECEIVED BY FARMERS--2008-2009
Georgia
United States
Entire Month
Preliminary
Entire Month
Preliminary
Commodity
Price per Unit May 2008
Apr 2009
May 2009
May 2008
Apr 2009
May 2009
Cotton
/Lb
67.40
45.20
46.20
64.60
45.30
43.90
Peanuts, In Shell
/Lb
20.60
23.80
23.60
20.40
25.20
24.50
Calves Beef Cattle2/
Cows3/
/Lb /Lb /Lb
103.00 69.20 57.50
97.60 63.60 50.80
99.40 63.90 51.60
120.00 91.30 54.10
110.00 83.50 48.00
112.00 82.80 49.20
Steers & Heifers
/Lb
92.00
85.50
87.80
96.10
88.40
87.20
[Results from the monthly Prices Received by Farmers]. 1/ Price not published to avoid disclosure of individual firms. 2/ "Cows," "Steers and Heifers" combined. 3/ Beef cows and cull dairy cows sold for slaughter.
2
INDEX NUMBERS--UNITED STATES, 2008-2009
Index
2008
1990-92=100
Apr
May
Apr
Prices Received
146
152
129
Prices Paid Ratio1/
179
184
177
82
83
73
[Results from the monthly Prices Received by Farmers]. 1/ Ratio of index of prices received by farmers to index of prices paid.
2009
May
131 176
74
HIRED WORKERS: WAGE RATES FOR TYPE OF WORKER AND ALL HIRED WORKERS BY REGION AND UNITED STATES1/ APRIL 6-12, 2008, AND APRIL 12-18, 2009
Field
Type of Hired Worker Livestock
Field and Livestock
Wage Rates for All Hired Workers
Region
2008
Southeast2/ US3/
8.93 9.65
See footnotes below.
2009
8.80 9.99
2008
8.81 10.24
2009
2008
--Dollars per Hour--
9.84
8.90
10.25
9.84
2009
9.00 10.07
2008
9.66 10.57
2009
9.22 10.84
HIRED WORKERS: NUMBER AND HOURS WORKED BY REGION AND UNITED STATES1/ APRIL 6-12, 2008, AND APRIL 12-18, 2009
Expected to be Employed
Number of Workers
150 Days or More
149 Days or Less
Number of Hours Worked
Region
2008
2009
2008
2009
2008
2009
Southeast2/ US3/
--1,000--
25
36
700
680
--Hours per Week--
19
27
6
9
563
554
137
126
[Results from the Agricultural Labor Survey]. 1/ Excludes agricultural service workers. 2/ Southeast: AL, GA, SC. 3/ Excludes AK.
2008
2009
--1,000--
37.2
42.8
40.8
40.1
STOCKS OF PEANUTS AND SPECIFIED PRODUCTS AT MONTH'S END, UNITED STATES--20091/
Month Ending
Farmer Stocks
Shelled Peanuts2/
Roasting Stock (In Shell)
Farmer Stock Equivalent
Shelled Peanuts
Total3/
--Thousand Pounds--
Apr
2,280,788
520,940
77,402
692,850
3,051,040
[Results from the Peanut Stocks and Processing Report]. 1/ Excludes stocks on farms. Includes stocks owned by or held for account of CCC in commercial storages. Farmer stock on net weight basis. 2/ Includes shelled edible grades, shelled oil stock, and shelled seed (untreated). 3/ Actual farmer stock, plus roasting stock, plus shelled peanuts x 1.33.
WINTER WHEAT--SELECTED STATES AND UNITED STATES, 2008-20091/
Area Harvested
Yield
Production
State
AR GA KY MS NC SC TN VA US
2008
Jun 1, 2009
--1,000 Acres--
980
430
400
240
460
400
485
200
720
510
205
160
520
300
280
245
39,614
33,995
2008
57.0 56.0 71.0 62.0 60.0 54.0 63.0 71.0 47.2
Jun 1, 2009
--Bushels--
51.0 48.0 66.0 55.0 55.0 51.0 59.0 63.0 43.9
2008
Jun 1, 2009
--1,000 Bushels--
55,860
21,930
22,400
11,520
32,660
26,400
30,070
11,000
43,200
28,050
11,070
8,160
32,760
17,700
19,880
15,435
1,867,903
1,491,769
1/ AL, FL, and LA state level estimates will be published in the "Small Grains 2008 Summary," to be released September 30, 2009.
PEACH TOTAL PRODUCTION SELECTED STATES--2007-2009
State
CA All Clingstone1/ Freestone
GA SC Total
2007
949,000 503,000 446,000
13,000 12,500 974,500
2008 --Tons--
852,000 426,000 426,000
28,000 60,000 940,000
[Results from the June Peach Inquiry]. 1/ CA Clingstone is over-the-scale tonnage and includes culls and cannery diversions.
3
Jun 1, 2009 Forecast
810,000 440,000 370,000
32,000 65,000 907,000
MILK--PRODUCTION AND INCOME, 2007-20081/2/
Georgia
United States
Item
Unit
2007
2008
2007
2008
Number of Milk Cows3/
Thous Head
77
76
9,189
9,315
Milk Production per Cow
Pounds
18,169
17,829
20,204
20,396
Total Milk Production
Mil Lbs
1,399
1,355
185,654
189,992
Cash Receipts
Mil Dol
Value of Home Consumption4/ Mil Dol
Gross Income5/
Mil Dol
281.6 0.2
281.8
280.7 0.2
280.9
35,453.4 27.1
35,480.5
34,772.7 24.7
34,797.4
[Results from the Milk Production Report]. 1/ 2007 revised. 2/ May not add due to rounding. 3/ Average number during year, excluding heifers not yet fresh. 4/ Valued at averaged returns
per 100 pounds of milk in combined marketings of milk and cream. 5/ Cash receipts from marketings of milk and cream plus value of milk used for home consumption.
CATTLE--PRODUCTION AND INCOME, 2007-2008
Average Price per 100 Pounds
Value of
Cash
Value of Home
Gross
Production1/ Marketings2/
Cattle
Calves
Production
Receipts3/
Consumption
Income
20074/
--Thousand Pounds--
--Dollars--
--Thousand Dollars--
GA
337,608
396,120
64.70
65.50
261,954
305,984
4,128
310,112
US
41,437,021
54,907,941
89.90
89.10
35,973,068
49,843,322
441,051
50,284,373
2008
GA
339,050
395,580
114.00
97.20
246,579
291,990
4,058
296,048
US
40,679,348
54,234,340
119.00
110.00
34,858,846
48,189,201
416,268
48,605,469
[Results published in the Meat Animals Production, Disposition, and Income 2007 Summary]. 1/ Adjustments made for changes in inventory and for inshipments. 2/ Excludes custom slaughter for use on farms where produced and interfarm sales within the State. 3/ Receipts from marketings and sale of farm slaughter. 4/ Revised.
HOGS--PRODUCTION AND INCOME, 2007-2008
Average Price
Value of
Cash
Value of Home
Gross
Production1/
Marketings2/
per 100 Pounds
Production3/
Receipts3/4/
Consumption
Income
20075/ GA US
--Thousand Pounds--
106,346 29,606,420
105,931 30,221,861
--Dollars--
46.90 46.60
52,744 13,468,332
--Thousand Dollars--
54,334 14,750,490
459 32,148
54,793 14,782,638
2008 GA US
99,710 31,383,832
111,511 32,688,409
46.60 47.00
52,307 14,435,204
62,244 16,077,382
473 33,529
62,717 16,110,911
[Results published in the Meat Animals Production, Disposition, and Income 2007 Summary]. 1/ Adjustments made for changes in inventory and for inshipments. 2/ Excludes custom slaughter for use on farms where produced and interfarm sales within the State. 3/ Includes allowance for higher average price of State inshipments and outshipments of feeder pigs. 4/ Receipts from marketings and sale of farm slaughter. 5/ Revised.