- Collection:
- Georgia Government Publications
- Serial:
- Georgia farm report.
- Title:
- Georgia farm report, vol. 09, no. 05 (2009 May 29)
- Creator:
- Georgia. Department of Agriculture
- Contributor to Resource:
- United States. Department of Agriculture
United States. National Agricultural Statistics Service
United States. National Agricultural Statistics Service. Georgia Office - Publisher:
- Athens, Ga. : United States Department of Agriculture, National Agricultural Statistics Service, in cooperation with the Georgia Department of Agriculture, Georgia Field Office
- Date of Original:
- 2009-05-29
- Subject:
- Agricultural productivity--Georgia--Statistics
Crop yields--Georgia--Statistics - Location:
- United States, Georgia, 32.75042, -83.50018
- Medium:
- state government records
- Type:
- Text
- Format:
- application/pdf
- Description:
- Began in 1975?; ceased with vol. 10, no. 02 (Feb. 26, 2010).
"Agricultural statistician and Georgia Department of Agriculture."
Numbering began again with Vol. 11, no. 1 (Jan. 14, 2000).
Vols. for Aug. 31, 2005- issued by: USDA-NASS Georgia Field Office.
Description based on: Vol. 94, no, 1 (Jan. 4, 1994); title from caption.
Latest issue consulted: Vol. 10, no. 02 (Feb. 26, 2010). - External Identifiers:
- Call Number GA A400.C7 P1 F2 2009/5
- Metadata URL:
- https://dlg.galileo.usg.edu/id:dlg_ggpd_i-ga-ba400-pc7-bp1-bf2-b2009-s5-belec-p-btext
- Digital Object URL:
- https://dlg.galileo.usg.edu/do:dlg_ggpd_i-ga-ba400-pc7-bp1-bf2-b2009-s5-belec-p-btext
- Language:
- eng
- Holding Institution:
- University of Georgia. Map and Government Information Library
- Rights:
-

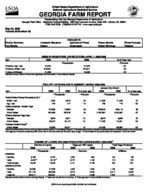
United States Department of Agriculture National Agricultural Statistics Service
GEORGIA FARM REPORT
Cooperating with the Georgia Department of Agriculture Georgia Field Office Stephens Federal Building 355 East Hancock Avenue, Suite 320 Athens, GA 30601
(706) 546-2236 (706)546-2416 FAX www.nass.usda.gov
May 29, 2009 Volume 09-Number 05
Poultry Summary Hay Stocks
Livestock Slaughter Cotton
HIGHLIGHTS Agricultural Prices
Cottonseed
Peanut Stocks Cotton Ginnings
Wheat Forecast Tobacco
EGGS IN INCUBATORS, UNITED STATES--APRIL 1, 2008-2009
Item
2008
2009
--Thousands--
Chickens, Egg Type
37,624
37,629
Chickens, Broiler Type
673,687
624,921
Turkeys, All Breeds
31,886
[Results from the monthly Chicken and Egg Report and the monthly Turkey Hatchery Report].
29,593
% of Year Ago --Percent--
100 93 93
POULTRY HATCHING AND PLACEMENT--MARCH 2008-2009
January thru March
Item
2008
2009
% of year ago
2008
2009
% of year ago
Pullet Chicks Placed Domestic (U.S.)1/
--Thousands--
--Percent--
--Thousands--
--Percent--
Broiler Type
7,090
6,678
94
21,638
21,035
97
Egg Type
245
277
113
735
773
105
Chicks Hatched - Broiler Type
Georgia
127,686
119,397
94
373,970
349,116
93
United States
832,899
783,348
94
2,425,962
2,262,662
93
Chicks Hatched- Egg Type
Georgia
2,342
2,371
101
6,874
6,652
97
United States Turkeys Poults Placed2/
39,547
40,137
101
117,263
115,081
98
United States
26,369
23,921
91
175,588
158,692
90
Results from the monthly Chicken and Egg Report and the monthly Turkey Hatchery Report]. 1/ Domestic placements as reported by leading breeders includes expected pullet replacements
from eggs sold during the preceding month at the rate of 125 pullet chicks per 30 dozen case of eggs. 2/ Accumulated turkey poults placed are September 1 to current month.
NUMBER OF LAYERS AND EGG PRODUCTION DURING MARCH 2008-20091/
Number of Layers
Eggs per 100 Layers
Total Eggs Produced
2008
2009
2008
2009
2008
2009
--Thousands--
--Number--
--Millions--
GEORGIA
Hatching Table
9,785 9,452 2/
8,782 9,216 2/
1,932 2,272
958 1,168
184
169
216
222
Total Georgia
19,043
18,048
2,101
2,166
400
391
UNITED STATES
Hatching
60,835
57,383
1,905
1,905
1,159
1,093
Table
281,182
283,068
2,318
2,343
6,517
6,632
Total U.S.
342,017
340,451
2,244
2,269
7,675
7,724
[Results from the Monthly Chicken and Egg Report]. 1/ Totals may not add due to rounding. 2/ Table egg layers in flocks 30,000 and above.
USDA is an equal opportunity provider and employer.
COMMERCIAL POULTRY SLAUGHTER1/--FEBRUARY AND MARCH 2009
Item
Feb
Mar
% of Last Month
Young Chickens
--Thousands--
--Percent--
Georgia
97,220
109,486
113
United States
657,218
726,974
111
Mature Chickens
Light Type, U.S.
4,459
5,168
116
Heavy Type, U.S.
5,700
6,601
116
Total U.S.
10,159
11,769
116
Percent Condemned Young Chickens
--Percent--
Georgia
0.89
0.89
United States
1.04
0.96
1/ Federally inspected slaughter data as collected by Meat and Poultry Inspection Program.
January to Date --Thousands--
307,975 2,078,950
14,865 18,094 32,959
--Percent--
0.89 1.01
LIVESTOCK SLAUGHTER--UNITED STATES,1/ MARCH 2008, 2009
Number Slaughtered
Average Live Weight
Total Live Weight
Species
2008
2009
2009 as % of 2008
2008
2009
2008
2009
--Thousand Head--
--Percent--
--Pounds--
--Thousand Pounds--
Cattle
2,728.3
2,730.1
100
1,276
1,305
3,469,413
3,550,136
Calves
71.0
79.8
112
273
263
19,177
20,784
Hogs
9,660.6
9,652.8
100
271
272
2,615,373
2,622,851
Sheep & Lambs
230.6
222.0
96
139
143
32,059
[Results form the U.S. Livestock Slaughter release]. 1/ Includes slaughter under Federal Inspection and other commercial slaughter, excludes farm slaughter.
31,764
PRICES RECEIVED BY FARMERS--2008-2009 Georgia
United States
Commodity
Price per Unit
Entire Month
Apr 2008
Mar 2009
Preliminary Apr 2009
Entire Month
Apr 2008
Mar 2009
Cotton
/Lb
65.20
43.10
44.80
65.50
41.00
Peanuts, In Shell
/Lb
19.70
24.50
23.60
20.00
25.40
Calves
/Lb
100.00
93.20
96.30
116.00
107.00
Beef Cattle1/
/Lb
66.20
60.20
62.90
86.80
79.00
Cows2/
/Lb
54.50
47.40
50.50
50.70
44.60
Steers & Heifers
/Lb
86.00
81.20
84.10
91.80
84.00
[Results from the monthly Prices Received by Farmers]. 1/ "Cows," "Steers and Heifers" combined. 2/ Beef cows and cull dairy cows sold for slaughter.
Preliminary Apr 2009
42.80 25.50 109.00 82.80 47.50 87.70
Index
INDEX NUMBERS--UNITED STATES, 2008-2009 2008
2009
1990-92=100
Mar
Apr
Mar
Apr
Prices Received
146
146
126
131
Prices Paid
174
179
178
178
Ratio1/
84
82
71
74
[Results from the monthly Prices Received by Farmers]. 1/ Ratio of index of prices received by farmers to index of prices paid.
2
FEED--PRICES PAID, APRIL 2007-2008, MARCH 2009 Southeast1/
Commodity
Price per Unit Apr 2007
Apr 2008
Mar 2009
Apr 2007
Cottonseed Meal, 41%
$/Cwt
18.20
23.80
23.30
20.00
Soybean Meal, 44%
$/Cwt
22.00
28.70
27.80
18.20
Corn Meal
$/Cwt
15.60
17.20
16.20
12.30
Broiler Grower
$/Ton
271.00
342.00
455.00
306.00
Chick Starter
$/Ton
277.00
382.00
498.00
327.00
Laying Feed
$/Ton
254.00
358.00
365.00
278.00
Dairy Conct., 32-38%
$/Ton
218.00
419.00
422.00
378.00
Beef Cattle Conct., 32%-36% $/Ton
354.00
[Results from Prices Paid by Farmers]. 1/ Southeast: AL, FL, GA, and SC.
419.00
439.00
370.00
United States Apr 2008
23.00 23.40 13.70 387.00 416.00 371.00 469.00 433.00
Mar 2009
25.60 23.20 13.40 464.00 501.00 391.00 458.00 488.00
Month Ending
STOCKS OF PEANUTS AND SPECIFIED PRODUCTS AT MONTH'S END, UNITED STATES--20091/
Farmer Stocks
Shelled Peanuts2/
Roasting Stock (In Shell)
Farmer Stock Equivalent
Shelled Peanuts
Total3/
--Thousand Pounds--
Mar
2,591,092
552,951
72,504
735,425
3,399,021
[Results from the Peanut Stocks and Processing Report]. 1/ Excludes stocks on farms. Includes stocks owned by or held for account of CCC in commercial storages. Farmer stock
on net weight basis. 2/ Includes shelled edible grades, shelled oil stock, and shelled seed (untreated). 3/ Actual farmer stock, plus roasting stock, plus shelled peanuts x 1.33.
Area Harvested
State
2008
2009
--1000 Acres--
GA
400
240
US
39,614
33,995
[Results based on the May Yield Survey].
WINTER WHEAT, 2008-2009
Yield
2008
2009
--Bushels--
56.0
50.0
47.2
44.2
Production
2008
2009
--1,000 Bushels--
22,400
12,000
1,867,903
1,502,074
State
2006
Dec 1 2007
GA
878
US
96,400
[Results based on the May Yield Survey].
1,013 104,089
HAY STOCKS ON FARMS, 2006-2009
2008
2007
--1,000 Tons--
1,319 103,658
82 14,990
May 1 2008
145 21,585
2009
238 22,065
State
GA US
Planted
940.0 9,297.0
UPLAND COTTON--ACREAGE, YIELD, AND PRODUCTION, 2008
Harvested
Yield
Production in 480-Lb. Net Weight Bales
--1,000 Acres--
920.0 7,400.0
--Pounds--
835 803
--1,000 Bales--
1,660.0 12,384.5
COTTONSEED--PRODUCTION AND FARM DISPOSITION, 2008
State
Production
Farm Disposition Sales to Oil Mills
Other1/
Seed for Planting2/
--1,000 Tons--
GA
508.0
361.0
147.0
4.7
US
4,300.3
2,526.5
1,773.8
59.0
1/ Includes planting seed, feed, exports, inter-farm sales, shrinkage, loss, and other uses. 2/ Included in "other" farm disposition. Planting seed from previous year's crop.
3
Type and State
Upland GA
All
US
COTTON GINNINGS: EQUIVALENT 480-POUND BALES GINNED, CROP YEARS 2007-2008
2007
2008
1,672,200
1,620,450
19,198,700
12,832,600
ALL TOBACCO--ACREAGE, YIELD, PRODUCTION AND VALUE OF PRODUCTION 20081/
State
Area Harvested
Yield
Production
Price per Pound
Value of Production
--Acres--
--Pounds--
--1,000 Pounds--
--Dollars--
--1,000 Dollars--
GA
16,000
2,100
33,600
1.700
57,120
US
354,490
2,258
800,504
1.861 2/
1,482,437 2/
1/ Revised. 2/ Price and value for 2008 exclude Southern MD Belt tobacco to avoid disclosure of individual operations. Includes estimated 2008 value of production for CT and MA,
CT Valley Shade-grown. Used 2007 CT and MA, CT Valley Shade-grown price to compute the 2008 value of production.