- Collection:
- Georgia Government Publications
- Serial:
- Georgia farm report.
- Title:
- Georgia farm report, vol. 09, no. 04 (2009 April 30)
- Creator:
- Georgia. Department of Agriculture
- Contributor to Resource:
- United States. Department of Agriculture
United States. National Agricultural Statistics Service
United States. National Agricultural Statistics Service. Georgia Office - Publisher:
- Athens, Ga. : United States Department of Agriculture, National Agricultural Statistics Service, in cooperation with the Georgia Department of Agriculture, Georgia Field Office
- Date of Original:
- 2009-04-30
- Subject:
- Agricultural productivity--Georgia--Statistics
Crop yields--Georgia--Statistics - Location:
- United States, Georgia, 32.75042, -83.50018
- Medium:
- state government records
- Type:
- Text
- Format:
- application/pdf
- Description:
- Began in 1975?; ceased with vol. 10, no. 02 (Feb. 26, 2010).
"Agricultural statistician and Georgia Department of Agriculture."
Numbering began again with Vol. 11, no. 1 (Jan. 14, 2000).
Vols. for Aug. 31, 2005- issued by: USDA-NASS Georgia Field Office.
Description based on: Vol. 94, no, 1 (Jan. 4, 1994); title from caption.
Latest issue consulted: Vol. 10, no. 02 (Feb. 26, 2010). - External Identifiers:
- Call Number GA A400.C7 P1 F2 2009/4
- Metadata URL:
- https://dlg.galileo.usg.edu/id:dlg_ggpd_i-ga-ba400-pc7-bp1-bf2-b2009-s4-belec-p-btext
- Digital Object URL:
- https://dlg.galileo.usg.edu/do:dlg_ggpd_i-ga-ba400-pc7-bp1-bf2-b2009-s4-belec-p-btext
- Language:
- eng
- Holding Institution:
- University of Georgia. Map and Government Information Library
- Rights:
-

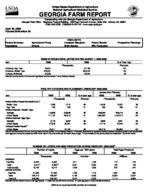
United States Department of Agriculture National Agricultural Statistics Service
GEORGIA FARM REPORT
Cooperating with the Georgia Department of Agriculture Georgia Field Office Stephens Federal Building 355 East Hancock Avenue, Suite 320 Athens, GA 30601
(706) 546-2236 (706)546-2416 FAX www.nass.usda.gov
April 30, 2009 Volume 09-Number 04
Poultry Summary Vegetables
Agricultural Prices Onions
HIGHLIGHTS Livestock Slaughter
Grain Stocks
Peanut Stocks Milk Production
Prospective Plantings
EGGS IN INCUBATORS, UNITED STATES--MARCH 1, 2008-2009
Item
2008
2009
--Thousands--
Chickens, Egg Type
36,531
37,166
Chickens, Broiler Type
679,081
634,244
Turkeys, All Breeds
32,005
[Results from the monthly Chicken and Egg Report and the monthly Turkey Hatchery Report].
28,232
% of Year Ago --Percent--
102 93 88
POULTRY HATCHING AND PLACEMENT--FEBRUARY 2008-2009
January thru February
Item
2008
2009
% of year ago
2008
2009
% of year ago
Pullet Chicks Placed Domestic (U.S.)1/
--Thousands--
--Percent--
--Thousands--
--Percent--
Broiler Type
7,536
7,215
96
14,548
14,357
99
Egg Type
280
256
91
490
496
101
Chicks Hatched - Broiler Type
Georgia
118,523
108,645
92
246,284
229,719
93
United States
771,197
700,913
91
1,593,063
1,479,314
93
Chicks Hatched- Egg Type
Georgia
2,175
2,087
96
4,532
4,281
94
United States Turkeys Poults Placed2/
37,549
36,861
98
77,716
74,944
96
United States
25,011
22,192
89
149,219
134,884
90
Results from the monthly Chicken and Egg Report and the monthly Turkey Hatchery Report]. 1/ Domestic placements as reported by leading breeders includes expected pullet replacements from eggs sold during the preceding month at the rate of 125 pullet chicks per 30 dozen case of eggs. 2/ Accumulated turkey poults placed are September 1 to current month.
NUMBER OF LAYERS AND EGG PRODUCTION DURING FEBRUARY 2008-20091/
Number of Layers
Eggs per 100 Layers
Total Eggs Produced
2008
2009
2008
2009
2008
2009
--Thousands--
--Number--
--Millions--
GEORGIA
Hatching Table
9,829 9,513 2/
8,804 9,360 2/
1,811 2,081
1,738 2,062
Total Georgia
19,163
18,214
1,946
1,905
UNITED STATES
Hatching
61,086
57,405
1,768
1,716
Table
282,213
283,347
2,138
2,085
Total U.S.
343,299
340,752
2,072
2,023
[Results from the Monthly Chicken and Egg Report]. 1/ Totals may not add due to rounding. 2/ Table egg layers in flocks 30,000 and above.
174 199 373
1,080 6,034 7,114
153 194 347
985 5,907 6,893
USDA is an equal opportunity provider and employer.
COMMERCIAL POULTRY SLAUGHTER1/--JANUARY AND FEBRUARY 2009
Item
Jan
Feb
% of Last Month
--Thousands--
--Percent--
Young Chickens Georgia United States
Mature Chickens Light Type, U.S.
101,269 694,758
5,238
97,220
96
657,218
95
4,459
85
Heavy Type, U.S.
5,793
5,700
98
Total U.S.
11,031
10,159
92
Percent Condemned Young Chickens
--Percent--
Georgia
0.90
United States
1.03
1/ Federally inspected slaughter data as collected by Meat and Poultry Inspection Program.
0.89 1.03
January to Date --Thousands--
198,489 1,351,976
9,697 11,493 21,190
--Percent--
0.90 1.03
LIVESTOCK SLAUGHTER--UNITED STATES,1/ FEBRUARY 2008-2009
Number Slaughtered
Average Live Weight
Total Live Weight
Species
2008
2009
2009 as % of 2008
2008
2009
2008
2009
--Thousand Head--
--Percent--
--Pounds--
--Thousand Pounds--
Cattle
2,642.7
2,527.3
96
1,285
1,310
3,382,701
3,299,293
Calves
69.1
74.1
107
272
257
18,616
18,749
Hogs
9,377.4
8,913.2
95
271
272
2,534,860
2,418,807
Sheep & Lambs
211.6
180.1
85
142
142
30,084
25,527
[Results from the U.S. Livestock Slaughter Release]. 1/ Includes slaughter under Federal Inspection and other commercial slaughter, excludes farm slaughter.
PRICES RECEIVED BY FARMERS--MARCH 15, 2009
Commodity
Price per Unit Mar 2008
Georgia Feb 2009
Mar 15, 2009
Mar 2008
United States Feb 2009
Mar 15, 2009
Cotton Cottonseed Peanuts, In Shell Calves Beef Cattle2/
Cows3/
/Lb $/Ton /Lb /Lb /Lb /Lb
66.20 1/
19.30 106.00
66.60 53.50
45.60 189.00
24.00 91.90 60.00 47.90
51.60 1/
24.50 91.30 58.80 46.20
63.00 1/
20.70 118.00
87.80 51.50
41.60 213.00
25.30 105.00
78.80 43.90
40.90 1/
25.60 104.00
78.50 44.00
Steers & Heifers /Lb
88.00
78.20
79.30
92.90
83.80
83.50
[Results from the monthly Prices Received by Farmers]. 1/ Marketing year August-February. 2/"Cows," "Steers and Heifers" combined. 3/ Beef cows and cull dairy cows sold for slaughter.
INDEX NUMBERS--UNITED STATES, 2008-2009
Index
2008
1990-92=100
Feb
Mar
Feb
Prices Received
146
Prices Paid
171
Ratio1/
85
146
126
174
174
84
72
[Results from the monthly Prices Received by Farmers]. 1/ Ratio of index of prices received by farmers to index of prices paid.
2
2009
Mar
126 174
72
STOCKS OF PEANUTS AND SPECIFIED PRODUCTS AT MONTH'S END, UNITED STATES--20091/
Month Ending
Farmer Stocks
Shelled Peanuts2/
Farmer Stock Equivalent
Roasting Stock (In Shell) Shelled Peanuts
Total3/
--Thousand Pounds--
Feb
2,942,346
551,596
66,555
733,623
3,742,524
[Results from the Peanut Stocks and Processing Report]. 1/ Excludes stocks on farms. Includes stocks owned by or held for account of CCC in commercial storages. Farmer stock on net
weight basis. 2/ Includes shelled edible grades, shelled oil stock, and shelled seed (untreated). 3/ Actual farmer stock, plus roasting stock, plus shelled peanuts x 1.33.
2009 GEORGIA AND UNITED STATES PROSPECTIVE PLANTINGS
Planted Acreage
Crop
2008
Georgia Intended 20091/
2009 as % of 2008
2008
United States Intended 20091/
2009 as % of 2008
--Thousands--
--Percent--
--Thousands--
--Percent--
Corn, All
370
350
95
85,982
84,986
99
Cotton
940
940
100
9,470
8,812
93
Hay, All2/
720
650
90
60,062
60,297
100
Oats3/
65
70
108
3,217
3,400
106
Peanuts
690
500
72
1,534
1,124
73
Sorghum, All
60
55
92
8,284
6,960
84
Soybeans
430
400
93
75,718
76,024
100
Tobacco2/
16.0
15.0
94
354,190
353,200
100
Wheat3/
480
340
71
63,147
58,638
93
[Results from the March 1 Agricultural Survey]. 1/ Intended plantings in 2009 as indicated by reports from farmers. 2/ Area harvested 2008; intended for harvest 2009. 3/ Includes acreage planted preceding fall.
SELECTED FRESH MARKET VEGETABLES AND MELONS, AREA HARVESTED BY CROP, STATE AND TOTAL, SPRING SEASON, 2008 AND PROSPECTIVE AREA, 2009
Crop
Usual
Area
Area for
2009 Crop
Usual
Area
Area for
2009
and
Harvest Harvested Harvest
as % of and
Harvest
Harvested Harvest
as % of
State
Period
2008
2009
2008 State
Period
2008
2009
2008
--Acres--
--Percent--
--Acres--
--Percent--
SNAP BEANS
CANTALOUP
FL
Apr-Jun
11,200
10,700
96
AZ
May- Jul
11,900
10,500
88
GA
Apr-Jun
7,800
8,000
103
CA
Apr-Jun
10,000
10,000
100
NJ
Jun-Aug
1,500
1,600
107
GA
Apr-Jun
3,500
3,700
106
TX
Apr-Jun
700
800
114
TOTAL
20,500
20,300
99
TOTAL
26,100
25,000
96
CABBAGE
WATERMELONS
FL
Apr-Jun
2,990
2,700
90
CA
Apr-Jun
2,300
2,000
87
GA
Apr-Jun
3,200
2,400
75
FL
Apr-Jul
26,100
25,800
99
NJ
May-Aug
1,000
1,000
100
TX
Apr-Jun
9,400
9,500
101
TX
Apr-Jun
600
500
83
TOTAL
7,790
6,600
85
TOTAL
37,800
37,300
99
[Results from the Fresh Market Vegetable Acreage Inquiry].
ONIONS--SPRING SEASON, BY STATE, 2007 AND FORECAST 20091/
Harvested
For Harvest
Yield for Acre
Production
State
2008
2009
2008
2009
2008
--Acres--
--Cwt--
--1,000 Cwt--
GA
11,500
11,000
320
290
Total
28,400
27,400
338
2/
[Results from the Georgia Onions, Acreage and Yield Inquiry]. 1/ Primarily fresh market. 2/ Published July 10, 2009.
3,680 9,603
2009
3,190 2/
3
GEORGIA GRAIN STOCKS--MARCH 1, 2008-2009
Grain
On Farms
2008 Off Farms1/
All Positions
On Farms
2009 Off Farms1/
All Positions
--1,000 Bushels--
Corn
*
8,656
*
*
5,902
*
Oats
*
34
*
*
75
*
[Results from the Grain Stocks Report]. 1/ Includes stocks at mills, elevators, warehouses, terminals and processors. * Data not published to avoid disclosure of individual operations.
U.S. GRAIN STOCKS--MARCH 1, 2007-2008
Grain
On Farms
2007 Off Farms1/
All Positions
On Farms
--1,000 Bushels--
Barley
28,270
82,154
110,424
44,060
Corn
3,780,000
3,078,722
6,858,722
4,085,000
Oats
31,000
47,988
78,988
30,000
Sorghum
26,100
159,808
185,908
32,200
Soybeans
593,000
840,982
1,433,982
656,500
Wheat
91,990
617,280
709,270
280,200
[Results from the Grain Stocks Report]. 1/ Includes stocks at mills, elevators, warehouses, terminals and processors.
2008 Off Farms1/
83,895 2,873,397
65,364 176,593 645,106 756,372
All Positions
127,955 6,958,397
95,364 208,793 1,301,606 1,036,572
MILK COWS AND MILK PRODUCTION--JANUARY-MARCH 2008-2009
Georgia
United States1/
Item
Unit
2008
2009
2009 as % of 2008
2008
2009
2009 as % of 2008
Milk Cows2/ Milk per Cow3/
Thous Head Pounds
77 4,690
76 4,945
99
9,286
9,297
100
114
5,127
5,088
99
Milk Production Mil Lbs
361
376
104
47,610
47,304
99
[Results from the Milk Production Report]. 1/ May not add due to rounding. 2/ Includes dry cows, excludes heifers not yet fresh. 3/ Excludes milk sucked by calves.