- Collection:
- Georgia Government Publications
- Serial:
- Georgia farm report.
- Title:
- Georgia farm report, vol. 09, no. 03 (2009 March 31)
- Creator:
- Georgia. Department of Agriculture
- Contributor to Resource:
- United States. Department of Agriculture
United States. National Agricultural Statistics Service
United States. National Agricultural Statistics Service. Georgia Office - Publisher:
- Athens, Ga. : United States Department of Agriculture, National Agricultural Statistics Service, in cooperation with the Georgia Department of Agriculture, Georgia Field Office
- Date of Original:
- 2009-03-31
- Subject:
- Agricultural productivity--Georgia--Statistics
Crop yields--Georgia--Statistics - Location:
- United States, Georgia, 32.75042, -83.50018
- Medium:
- state government records
- Type:
- Text
- Format:
- application/pdf
- Description:
- Began in 1975?; ceased with vol. 10, no. 02 (Feb. 26, 2010).
"Agricultural statistician and Georgia Department of Agriculture."
Numbering began again with Vol. 11, no. 1 (Jan. 14, 2000).
Vols. for Aug. 31, 2005- issued by: USDA-NASS Georgia Field Office.
Description based on: Vol. 94, no, 1 (Jan. 4, 1994); title from caption.
Latest issue consulted: Vol. 10, no. 02 (Feb. 26, 2010). - External Identifiers:
- Call Number GA A400.C7 P1 F2 2009/3
- Metadata URL:
- https://dlg.galileo.usg.edu/id:dlg_ggpd_i-ga-ba400-pc7-bp1-bf2-b2009-s3-belec-p-btext
- Digital Object URL:
- https://dlg.galileo.usg.edu/do:dlg_ggpd_i-ga-ba400-pc7-bp1-bf2-b2009-s3-belec-p-btext
- Language:
- eng
- Holding Institution:
- University of Georgia. Map and Government Information Library
- Rights:
-

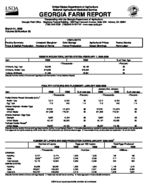
United States Department of Agriculture National Agricultural Statistics Service
GEORGIA FARM REPORT
Cooperating with the Georgia Department of Agriculture Georgia Field Office Stephens Federal Building 355 East Hancock Avenue, Suite 320 Athens, GA 30601
(706) 546-2236 (706)546-2416 FAX www.nass.usda.gov
March 31, 2009 Volume 09-Number 03
Poultry Summary
Livestock Slaughter
Trout & Catfish Production Number of Farms
HIGHLIGHTS Cold Storage
Honey Production
Agricultural Prices Cotton Ginnings
Peanut Stocks Farm Labor
EGGS IN INCUBATORS, UNITED STATES--FEBRUARY 1, 2008-2009
Item
2008
2009
--Thousands--
Chickens, Egg Type
35,539
35,198
Chickens, Broiler Type
674,636
623,584
Turkeys, All Breeds
31,480
[Results from the monthly Chicken and Egg Report and the monthly Turkey Hatchery Report].
28,351
% of Year Ago --Percent--
99 92 90
POULTRY HATCHING AND PLACEMENT--JANUARY 2008-2009
January thru January
Item
2008
2009
% of year ago
2008
2009
% of year ago
Pullet Chicks Placed Domestic (U.S.)1/
--Thousands--
--Percent--
--Thousands--
--Percent--
Broiler Type
7,012
6,730
96
7,012
6,730
96
Egg Type
210
240
114
210
240
114
Chicks Hatched - Broiler Type
Georgia
127,761
121,074
95
127,761
121,074
95
United States
821,866
778,401
95
821,866
778,401
95
Chicks Hatched - Egg Type
Georgia
2,357
2,194
93
2,357
2,194
93
United States Turkeys Poults Placed2/
40,167
38,083
95
40,167
38,083
95
United States
26,067
24,195
93
26,067
24,195
93
[Results from the monthly Chicken and Egg Report and the monthly Turkey Hatchery Report]. 1/ Domestic placements as reported by leading breeders includes expected pullet replacements
from eggs sold during the preceding month at the rate of 125 pullet chicks per 30 dozen case of eggs. 2/ Accumulated turkey poults placed are September 1 to current month.
NUMBER OF LAYERS AND EGG PRODUCTION DURING JANUARY 2008-20091/
Number of Layers
Eggs per 100 Layers
Total Eggs Produced
2008
2009
2008
2009
2008
2009
--Thousands--
--Number--
--Millions--
GEORGIA
Hatching Table
9,727 9,606 2/
8,774 9,479 2/
1,943 2,246
1,926 2,256
185
169
217
215
Total Georgia
19,175
18,303
2,096
2,098
402
384
UNITED STATES
Hatching
60,836
56,943
1,889
1,888
1,149
1,075
Table
283,901
284,003
2,289
2,321
6,498
6,592
Total U.S.
344,737
340,946
2,218
2,249
7,646
7,667
[Results from the Monthly Chicken and Egg Report]. 1/ Totals may not add due to rounding. 2/ Table egg layers in flocks 30,000 and above.
USDA is an equal opportunity provider and employer.
ALL LAYERS AND EGG PRODUCTION: ANNUAL AVERAGE NUMBER OF LAYERS, EGGS PER LAYER, AND TOTAL EGG PRODUCTION BY GEORGIA AND UNITED STATES, 2007-20081/
State
Average Number of Layers
20073/
2008
Eggs per Layer2/
20073/
2008
Total Egg Production
20073/
2008
--Thousand--
GA
19,434
US4/
346,498
18,539 339,572
--Number--
247
247
263
266
--Million Eggs--
4,792
4,576
91,101
90,151
1/ Annual estimates cover the period Dec 1, previous year thru Nov 30. 2/ Total egg production divided by average number of layers on hand. 3/ Revised. 4/ Sum of States may not add to U.S. total due to rounding.
COMMERCIAL POULTRY SLAUGHTER1/--DECEMBER 2008 AND JANUARY 2009
Item
Dec
Jan
% of Last Month
--Thousands--
--Percent--
Young Chickens
Georgia United States
103,592
101,296
98
709,846
694,679
98
Mature Chickens Light Type, U.S. Heavy Type, U.S. Total U.S.
5,527
5,238
95
5,949
5,793
97
11,476
11,031
96
Percent Condemned Young Chickens Georgia United States
--Percent--
0.79
0.90
1.00
1.03
1/ Federally inspected slaughter data as collected by Meat and Poultry Inspection Program.
January to Date --Thousands--
101,296 694,679
5,238 5,793 11,031
--Percent--
0.90 1.03
LIVESTOCK SLAUGHTER, UNITED STATES,1/ JANUARY 2008-2008
Number Slaughtered
Average Live Weight
Total Live Weight
Species
2008
2009
2009 as % of 2008
2008
2009
2008
2009
--Thousand Head--
--Percent--
--Pounds--
--Thousand Pounds--
Cattle Calves
2,898.4
2,718.4
94
71.5
84.7
119
1,291 269
1,306 245
3,728,444 18,985
3,537,601 20,463
Hogs
10,557.1
9,922.3
94
Sheep & Lambs
213.4
189.4
89
273
272
2,875,469
2,696,971
139
141
29,649
26,649
[Results form the U.S. Livestock Slaughter Release]. 1/ Includes slaughter under Federal Inspection and other commercial slaughter, excludes farm slaughter.
Species
Cattle Calves Hogs Sheep
1/ Preliminary.
NUMBER OF HEAD SLAUGHTERED--BY SPECIES, COMMERCIAL AND FARM, UNITED STATES, 2007-2008
Total Commercial
2007
2008
2007
Farm1/
2008
Total Slaughter
2007
2008
34,264.1 758.1
109,171.6 2,693.8
34,364.9 956.6
116,451.9 2,555.5
150.2 36.8
105.9 85.0
--1,000 Head--
149.5 36.5
107.0 94.6
34,414.3 794.9
109,277.5 2,778.8
34,514.4 993.1
116,558.9 2,650.1
Commodity
SELECTED COLD STORAGE STOCKS--UNITED STATES, JANUARY 31, 2009
Jan 31, 2008
Dec 31, 20081/
Jan 31, 2009
% of Jan 2008
% of Dec 2008
--Thousand Pounds--
--Percent--
Eggs, Frozen
12,007
22,638
21,925
183
97
Meats, Red2/
1,047,477
1,078,474
1,078,118
103
100
Beef, Frozen2/
450,782
492,637
454,743
101
92
Pork, Frozen2/
574,929
555,642
595,161
104
107
Poultry, Frozen3/
1,105,683
1,163,579
1,144,940
104
98
Peanuts, Shelled
279,796
266,624
303,542
108
114
Peanuts, In Shell
15,063
19,762
18,853
125
95
Pecans, Shelled4/
35,279
36,992
40,261
114
109
Pecans, In Shell4/
202,709
85,806
131,096
65
153
[Results from the monthly Cold Storage Report]. 1/ Revised. 2/ The 2008 revisions of boneless beef, total beef, pork hams, and total pork are the result of increased coverage of cold storage
facilities as well as updated plant information. Please refer to the Cold Storage 2008 Summary, published February 20, 2009, for all 2008 cold storage commodity estimates. 3/ Beginning
with January 31, 2009 estimates, an increase in duck inventory is the result of increased coverage of cold storage facilities. Updated historic reported duck data for 2008 are unavailable. Year to year relationships for duck and the total poultry category are impacted by this change. 4/ The 2008 revisions of shelled and in-shell pecans are the result of corrected data from cold
storage facilities. Please refer to the Cold Storage 2008 Summary, released February 20, 2009, for all 2008 cold storage commodity estimates.
2
PRICES RECEIVED BY FARMERS--FEBRUARY 15, 2009
Georgia
United States
Commodity
Price per Unit Feb 2008
Jan 2009
Feb 15, 2009
Feb 2008
Jan 2009
Cotton
/Lb
64.20
48.50
46.10
63.00
46.10
Cottonseed
$/Ton
156.00
191.00
189.00
175.00
214.00
Peanuts, In Shell /Lb
20.60
23.10
23.80
21.00
23.80
Calves Beef Cattle1/
Cows2/
/Lb /Lb /Lb
110.00 69.60 54.60
92.10 59.40 48.40
92.50 63.50 49.80
120.00 89.00 51.70
106.00 80.10 42.30
Steers & Heifers /Lb
92.00
78.10
78.90
94.30
85.80
[Results from the monthly Prices Received by Farmers]. 1/ "Cows," "Steers and Heifers" combined. 2/ Beef cows and cull dairy cows sold for slaughter.
Feb 15, 2009
43.60 213.00
25.30 105.00
80.20 44.30 85.40
Index 1990-92=100
INDEX NUMBERS--UNITED STATES, 2008-2009
2008
2009
Jan
Feb
Jan
Feb
Prices Received
144
146
139
127
Prices Paid Ratio1/
169
171
175
173
85
85
79
73
[Results from the monthly Prices Received by Farmers]. 1/ Ratio of index of prices received by farmers to index of prices paid.
STOCKS OF PEANUTS AND SPECIFIED PRODUCTS AT MONTH'S END, UNITED STATES--20091/
Month Ending
Farmer Stocks
Shelled Peanuts2/
Roasting Stock (In Shell)
Farmer Stock Equivalent
Shelled Peanuts
Total3/
--Thousand Pounds--
Jan
3,251,152
509,686
51,190
677,882
3,980,224
[Results from the Peanut Stocks and Processing Report]. 1/ Excludes stocks on farms. Includes stocks owned by or held for account of CCC in commercial storages. Farmer stock on net weight basis. 2/ Includes shelled edible grades, shelled oil stock, and shelled seed (untreated). 3/ Actual farmer stock, plus roasting stock, plus shelled peanuts x 1.33.
TROUT--SALES OF FISH 12" OR LONGER, GEORGIA AND UNITED STATES, 2007-2008
Number Sold
20071/
2008
Pounds Sold
20071/
2008
Average Value per Pound
20071/
2008
Value of Sales
20071/
2008
--Thousand--
--Dollars--
--Thousand Dollars--
GA US3/
2/ 58,674
174 40,401
2/ 66,910
206 52,410
2/ 1.19
2.14
2/
441
1.38
79,523
72,432
Results from the Trout Survey]. 1/ Revised. 2/ Not published to avoid disclosure of individual operations.
CATFISH--NUMBER OF OPERATIONS, WATER SURFACE, AND TOTAL SALES, GEORGIA AND UNITED STATES
State
Number of Operations
Jan 1, 2008
Jan 1, 2009
Water Surface Acres
Jan 1, 2008
Jan 1, 2009
Total Sales
20071/
2008
--Number--
--Acres--
--Thousand Dollars--
GA
2/
US
1,617
2/ 1,306
2/ 163,100
2/ 146,900
2/ 454,593
2/ 409,998
[Results from the Catfish Grower Survey]. 1/ Revised. 2/ Not published to avoid disclosure of individual operations.
NUMBER OF FARMS AND LAND IN FARMS, GEORGIA AND UNITED STATES 2006-2007
State
20071/
Number of Farms
2008
20071/
Land in Farms
--Number--
--Thousand Acres--
GA
47,900
US
2,204,950
47,800 2,200,000
10,300 921,460
[Results from the June Agricultural Survey]. 1/ Revised.
2008
10,400 919,900
NUMBER OF FARMS: ECONOMIC SALES CLASS BY GEORGIA AND UNITED STATES, 2008
Economic Sales Class
State $1,000-$9,999
$10,000-$99,999 $100,000-$249,999 $250,000-$499,999 $500,000 & Over
--Number--
GA
30,200
US
1,222,000
10,000 604,500
2,500 149,000
1,600 98,500
3,500 126,000
[Results from the June Agricultural Survey].
Total
47,800 2,200,000
LAND IN FARMS: ECONOMIC SALES CLASS BY GEORGIA AND UNITED STATES, 2008
Economic Sales Class
State $1,000-$9,999
$10,000-$99,999 $100,000-$249,999 $250,000-$499,999 $500,000 & Over
--1,000 Acres--
GA
3,200
US
106,700
2,350 225,300
1,000 151,300
950 143,500
2,900 293,100
[Results from the June Agricultural Survey].
3
Total
10,400 919,900
COLONIES OF BEES: PRODUCTION, PRICE AND VALUE, GEORGIA AND UNITED STATES, 2007-20081/
Item
Georgia
Unit
20072/
2008
United States
20072/
2008
Honey Producing Colonies 1,000 Colonies
60
55
2,443
2,301
Yield per Colony
Pounds
58.0
71.0
60.7
69.9
Honey Production Stocks Dec 153/ Avg Price per Pound4/
1,000 Pounds 1,000 Pounds Cents
3,480 522 119
3,905 312 149
148,341 52,635 107.7
160,861 50,445 141.0
Value of Honey Production 1,000 Dollars
4,141
5,818
159,763
226,814
[Results from the Bee and Honey Inquiry]. 1/ For producers with 5 or more colonies. 2/ Revised. 3/ Stocks held by producers. 4/ Prices weighted by sales.
COTTON GINNINGS: RUNNING BALES GINNED AS OF FEBRUARY 1, BY CROP, SELECTED STATES, AND UNITED STATES, CROP YEARS 2005-20081/
Crop and State
2005
2006
2007
All Cotton
AL
830,650
667,850
394,800
GA
2,099,800
2,267,000
1,617,000
SC
390,250
399,150
148,350
US
22,255,400
20,558,950
17,584,650
[Results from the Cotton Ginnings Report]. 1/ Excluding Linters.
2008
450,500 1,568,100
231,350 12,375,400
HIRED WORKERS: WAGE RATES FOR TYPE OF WORKER AND ALL HIRED WORKERS BY REGION AND UNITED STATES1/
JANUARY 6-12, 2008 AND JANUARY 11-17, 2009
Type of Hired Worker
Field
Livestock
Field and Livestock
Wage Rates for All Hired Workers
Region
2008
2009
2008
2009
2008
2009
2008
2009
Southeast2/ US3/
8.47 9.67
--Dollars per Hour--
9.65
8.87
9.65
8.62
9.65
9.96
10.18
10.27
9.88
10.08
9.03 10.81
10.05 10.93
See footnotes below.
HIRED WORKERS: NUMBER AND HOURS WORKED BY REGION AND UNITED STATES1/ JANUARY 6-12, 2008 AND JANUARY 11-17, 2009
Expected to be Employed
Region
Number of Workers
2008
2009
150 Days or More
2008
2009
149 Days or Less
2008
2009
Number of Hours Worked
2008
2009
--1,000--
Southeast2/
29
30
22
US3/
594
595
506
--Hours per Week--
22
7
497
88
--1,000--
8
37.3
38.8
98
38.4
38.3
[Results from the Agricultural Labor Survey]. 1/ Excludes agricultural service workers. 2/ Southeast: AL, GA, SC. 3/ Excludes AK.