- Collection:
- Georgia Government Publications
- Serial:
- Georgia farm report.
- Title:
- Georgia farm report, vol. 09, no. 12 (2009 December 31)
- Creator:
- Georgia. Department of Agriculture
- Contributor to Resource:
- United States. Department of Agriculture
United States. National Agricultural Statistics Service
United States. National Agricultural Statistics Service. Georgia Office - Publisher:
- Athens, Ga. : United States Department of Agriculture, National Agricultural Statistics Service, in cooperation with the Georgia Department of Agriculture, Georgia Field Office
- Date of Original:
- 2009-12-31
- Subject:
- Agricultural productivity--Georgia--Statistics
Crop yields--Georgia--Statistics - Location:
- United States, Georgia, 32.75042, -83.50018
- Medium:
- state government records
- Type:
- Text
- Format:
- application/pdf
- Description:
- Began in 1975?; ceased with vol. 10, no. 02 (Feb. 26, 2010).
"Agricultural statistician and Georgia Department of Agriculture."
Numbering began again with Vol. 11, no. 1 (Jan. 14, 2000).
Vols. for Aug. 31, 2005- issued by: USDA-NASS Georgia Field Office.
Description based on: Vol. 94, no, 1 (Jan. 4, 1994); title from caption.
Latest issue consulted: Vol. 10, no. 02 (Feb. 26, 2010). - External Identifiers:
- Call Number GA A400.C7 P1 F2 2009/12
- Metadata URL:
- https://dlg.galileo.usg.edu/id:dlg_ggpd_i-ga-ba400-pc7-bp1-bf2-b2009-s12-belec-p-btext
- Digital Object URL:
- https://dlg.galileo.usg.edu/do:dlg_ggpd_i-ga-ba400-pc7-bp1-bf2-b2009-s12-belec-p-btext
- Language:
- eng
- Holding Institution:
- University of Georgia. Map and Government Information Library
- Rights:
-

United States Department of Agriculture National Agricultural Statistics Service
GEORGIA FARM REPORT
Cooperating with the Georgia Department of Agriculture Georgia Field Office Stephens Federal Building 355 East Hancock Avenue, Suite 320 Athens, GA 30601
(706) 546-2236 (706)546-2416 FAX www.nass.usda.gov
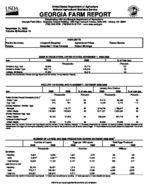
December 31, 2009 Volume 09-Number 12
Poultry Summary Pecans
HIGHLIGHTS
Livestock Slaughter
Agricultural Prices
December 1 Crop Forecast
Cotton Ginnings
Peanut Stocks
EGGS IN INCUBATORS, UNITED STATES--NOVEMBER 1, 2008-2009
Item
2008
2009
--Thousands--
Chickens, Egg Type
33,806
Chickens, Broiler Type
585,110
Turkeys, All Breeds
27,490
[Results from the monthly Chicken and Egg Report and the monthly Turkey Hatchery Report].
34,774 576,843
26,010
% of Year Ago
--Percent-103 99 95
POULTRY HATCHING AND PLACEMENT-- OCTOBER 2008-2009
January thru October
Item
2008
2009
% of year ago
2008
2009
% of year ago
Pullet Chicks Placed Domestic (U.S.)1/
--Thousands--
--Percent--
--Thousands--
--Percent--
Broiler Type
7,042
7,017
100
72,215
69,466
95
Egg Type
273
241
88
2,442
2,770
113
Chicks Hatched - Broiler Type
Georgia
113,259
110,177
97
1,216,743
1,150,277
95
United States
740,964
728,909
98
7,971,301
7,603,562
95
Chicks Hatched- Egg Type
United States Turkeys Poults Placed2/
40,198
37,406
93
395,964
387,778
98
United States
22,165
21,245
96
44,680
42,088
94
Results from the monthly Chicken and Egg Report and the monthly Turkey Hatchery Report]. 1/ Domestic placements as reported by leading breeders includes expected pullet replacements from eggs sold during the preceding month at the rate of 125 pullet chicks per 30 dozen case of eggs. 2/ Accumulated turkey poults placed are September 1 to current month.
NUMBER OF LAYERS AND EGG PRODUCTION DURING OCTOBER 2008-20091/
Number of Layers
Eggs per 100 Layers
Total Eggs Produced
2008
2009
2008
2009
2008
2009
--Thousands--
--Number--
--Millions--
GEORGIA
Hatching Table
8,634 9,324 2/
8,526 8,587 2/
1,957 2,283
1,970 2,420
169
168
214
209
Total Georgia
18,008
17,163
2,127
2,197
383
377
UNITED STATES
Hatching
56,720
55,237
1,918
1,919
1,088
1,060
Table
278,217
280,437
2,350
2,365
6,538
6,633
Total U.S.
334,937
335,674
2,277
2,292
7,625
[Results from the monthly Chicken and Egg Report]. 1/ Totals may not add due to rounding. 2/ Table egg layers in flocks 30,000 and above.
7,692
USDA is an equal opportunity provider and employer.
COMMERCIAL POULTRY SLAUGHTER1/-- SEPTEMBER AND OCTOBER 2009
Item
Sep
Oct
% of Last Month
--Thousands--
--Percent--
Young Chickens
Georgia
103,091
102,446
99
United States
729,420
723,391
99
Mature Chickens
Light Type, U.S.
5,471
5,077
93
Heavy Type, U.S.
6,397
6,852
107
Total U.S.
11,868
11,929
101
Percent Condemned Young Chickens
--Percent--
Georgia
0.62
0.63
United States
0.79
0.79
1/ Federally inspected slaughter data as collected by Meat and Poultry Inspection Program.
January to Date --Thousands--
1,035,819 7,159,313
53,635 64,502 118,137 --Percent--
0.72 0.89
LIVESTOCK SLAUGHTER--UNITED STATES,1/ OCTOBER 2008, 2009
Number Slaughtered
Average Live Weight
Total Live Weight
Species
2008
2009
2009 as % of 2008
2008
2009
2008
2009
--Thousand Head--
--Percent--
--Pounds--
--Thousand Pounds--
Cattle
2,989.1
2,885.6
97
1,303
1,312
3,882,244
3,772,461
Calves
95.6
83.6
87
244
249
23,003
20,594
Hogs
10,746.1
10,319.4
96
269
272
2,892,531
2,800,158
Sheep & Lambs
225.3
218.8
97
133
131
29,903
[Results form the U.S. Livestock Slaughter release]. 1/ Includes slaughter under Federal Inspection and other commercial slaughter, excludes farm slaughter.
28,624
PRICES RECEIVED BY FARMERS-- NOVEMBER 15, 2009
Georgia
United States
Commodity
Price per Unit Nov 2008
Oct 2009
Nov 15, 2009
Nov 2008
Oct 2009
Nov 15, 2009
Cotton Cottonseed2/
/Lb $/Ton
1/ 188.00
61.50 1/
62.80 123.00
54.80 221.00
56.70 161.00
57.90 159.00
Peanuts, In Shell
/Lb
20.40
20.70
18.20
20.10
23.80
22.50
Calves Beef Cattle3/
Cows4/
/Lb /Lb /Lb
89.00 59.20 47.60
90.60 56.50 44.30
93.10 57.70 43.50
105.00 84.30 43.10
104.00 79.20 43.60
105.00 79.80 42.00
Steers & Heifers
/Lb
75.30
76.50
77.20
90.90
84.40
85.60
[Results from the monthly Prices Received by Farmers]. 1/ Price not published to avoid disclosure of individual firms. 2/ Marketing year August-February. 3/ "Cows," "Steers and
Heifers" combined. 4/ Beef cows and cull dairy cows sold for slaughter.
3
INDEX NUMBERS--UNITED STATES, 2008-2009
Index
2008
1990-92=100
Oct
Nov
Oct
Prices Received
150
142
134
Prices Paid Ratio1/
187
182
176
80
78
76
[Results from the monthly Prices Received by Farmers]. 1/ Ratio of index of prices received by farmers to index of prices paid.
2009
Nov 134 176 76
STOCKS OF PEANUTS AND SPECIFIED PRODUCTS AT MONTH'S END, UNITED STATES--20091/
Month Ending
Farmer Stocks
Shelled Peanuts2/
Roasting Stock (In Shell)
Farmer Stock Equivalent
Shelled Peanuts
Total3/
--Thousand Pounds--
Oct
2,013,266
573,830
43,312
763,194
2,819,772
[Results from the Peanut Stocks and Processing Report]. 1/ Excludes stocks on farms. Includes stocks owned by or held for account of CCC in commercial storages. Farmer stock on net weight basis. 2/ Includes shelled edible grades, shelled oil stock, and shelled seed (untreated). 3/ Actual farmer stock, plus roasting stock, plus shelled peanuts x 1.33.
2
PECANS: UTILIZED PRODUCTION BY CROP, STATE, AND UNITED STATES, 2007-2008 AND FORECAST DECEMBER 1, 2009
Crop and State
2007
2008
2009
Improved Varieties1/ AL AZ AR2/ CA2/ FL2/ GA LA MS2/ MO2/ NM NC2/ OK SC2/ TX US
10,000 23,000
1,500 4,400 1,700 135,000 3,000 2,200
2 74,000
160 3,000 1,500 44,000 303,462
--1,000 Pounds--
7,400 17,500
1,000 3,750 1,400 66,000 1,000
900 110 43,000 600 1,000 3,000 20,000 166,660
8,600 24,000
1,500 3,800 1,800 82,000 2,500 2,000
250 76,000
6,000 3,300 40,000 251,750
Native & Seedling AL AR2/ FL2/ GA KS2/ LA MS2/ MO2/ NC2/ OK SC2/ TX US
2,000 800 200
15,000 500
11,000 800 3 40
27,000 500
26,000 83,843
600 500 300 4,000 1,900 4,000 600 830 100 4,000 400 10,000 27,230
1,400 800 300
3,000 1,700 5,500
500 1,550
14,000 700
20,000 49,450
All Pecans AL AZ AR2/ CA2/ FL2/ GA KS2/ LA MS2/ MO2/ NM NC2/ OK SC2/ TX US
12,000 23,000
2,300 4,400 1,900 150,000
500 14,000
3,000 5
74,000 200
30,000 2,000
70,000 387,305
8,000 17,500
1,500 3,750 1,700 70,000 1,900 5,000 1,500
940 43,000
700 5,000 3,400 30,000 193,890
1/ Budded, grafted, or topworked varieties. 2/ Estimates for current year carried forward from earlier forecast.
10,000 24,000
2,300 3,800 2,100 85,000 1,700 8,000 2,500 1,800 76,000
20,000 4,000
60,000 301,200
GEORGIA ACREAGE, YIELD AND PRODUCTION, 2008 AND DECEMBER 1, 2009 FORECAST
Crop
Area Harvested1/
Yield per Acre
Production
Unit
2008
Ind Dec 1, 2009
2008
Ind Dec 1, 2009
2008
Ind Dec 1, 2009
Corn for Grain Cotton, Upland2/
Bu Bale
Hay, All Other
Ton
Peanuts
Lb
Soybeans for Beans Bu
Tobacco, Type 14 Lbs
Wheat, Winter Apples4/ Grapes4/ Peaches4/ Pecans6/
Bu Lbs Tons Tons Lbs
--Thousand Acres--
310
350
920.0
990.0
720
690
685
500
415
450
16.0
14.0
400
250
.6
3/
1.2
3/
9.5
3/
6/
6/
140 835 2.20 3,400
31 2,100
56.0 20,000
2.92 2.95
6/
140 907 2.50 3,500
33 1,500
42.0 3/ 3/ 3/ 6/
--Thousands--
43,400
49,000
1,600.0
1,870.0
1,584
1,725
2,329,000
1,750,000
12,865
14,850
33,600
21,000
22,400
10,500
12,000
4/
3.5
3.7
28.0
3/
70,000
85,000
[Results from the December Yield Survey]. 1/ Harvested for principal use. 2/ Cotton yield in pounds per harvested acre, production in 480 net weight bales. 3/ Bearing acres and yield released July 2010 in Noncitrus Fruits and Nuts 2009 Summary. 4/ Estimates discontinued in 2009. 5/ Utilized production. 6/ Not available.
3
ALL COTTON-- DECEMBER 1, 2009 FORECAST BY STATES AND UNITED STATES
State
Acres for Harvest --1,000 Acres--
Yield --Pounds--
Production1/ --1,000 Bales2/--
2009 as % of 2008 --Percent--
AL
250.0
710
370.0
79
GA
990.0
907
1,870.0
117
SC
114.0
842
200.0
81
TN
280.0
891
520.0
98
US
7,732.2
782
12,592.0
98
1/ Production ginned and to be ginned. 2/ 480 lb. net weight bales.
Crop and State All Cotton
AL GA SC TN US
COTTON GINNINGS: EQUIVALENT 480-POUND BALES GINNED, CROP YEARS 2008-2009
2008
2009
364,950 1,079,050
177,700 518,100 8,927,600
192,950 901,850 154,050 380,800 7,873,550