- Collection:
- Georgia Government Publications
- Serial:
- Georgia farm report.
- Title:
- Georgia farm report, vol. 09, no. 10 (2009 October 30)
- Creator:
- Georgia. Department of Agriculture
- Contributor to Resource:
- United States. Department of Agriculture
United States. National Agricultural Statistics Service
United States. National Agricultural Statistics Service. Georgia Office - Publisher:
- Athens, Ga. : United States Department of Agriculture, National Agricultural Statistics Service, in cooperation with the Georgia Department of Agriculture, Georgia Field Office
- Date of Original:
- 2009-10-30
- Subject:
- Agricultural productivity--Georgia--Statistics
Crop yields--Georgia--Statistics - Location:
- United States, Georgia, 32.75042, -83.50018
- Medium:
- state government records
- Type:
- Text
- Format:
- application/pdf
- Description:
- Began in 1975?; ceased with vol. 10, no. 02 (Feb. 26, 2010).
"Agricultural statistician and Georgia Department of Agriculture."
Numbering began again with Vol. 11, no. 1 (Jan. 14, 2000).
Vols. for Aug. 31, 2005- issued by: USDA-NASS Georgia Field Office.
Description based on: Vol. 94, no, 1 (Jan. 4, 1994); title from caption.
Latest issue consulted: Vol. 10, no. 02 (Feb. 26, 2010). - External Identifiers:
- Call Number GA A400.C7 P1 F2 2009/10
- Metadata URL:
- https://dlg.galileo.usg.edu/id:dlg_ggpd_i-ga-ba400-pc7-bp1-bf2-b2009-s10-belec-p-btext
- Digital Object URL:
- https://dlg.galileo.usg.edu/do:dlg_ggpd_i-ga-ba400-pc7-bp1-bf2-b2009-s10-belec-p-btext
- Language:
- eng
- Holding Institution:
- University of Georgia. Map and Government Information Library
- Rights:
-

United States Department of Agriculture National Agricultural Statistics Service
GEORGIA FARM REPORT
Cooperating with the Georgia Department of Agriculture Georgia Field Office Stephens Federal Building 355 East Hancock Avenue, Suite 320 Athens, GA 30601
(706) 546-2236 (706)546-2416 FAX www.nass.usda.gov
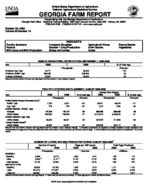
October 30, 2009 Volume 09-Number 10
Poultry Summary Pecans Milk Cows and Milk Production
HIGHLIGHTS Livestock Slaughter October 1 Crop Production Sheep and Lambs
Agricultural Prices Grain Stocks Goats
Peanut Stocks Vegetables
EGGS IN INCUBATORS, UNITED STATES--SEPTEMBER 1, 2008-2009
Item
2008
2009
--Thousands--
Chickens, Egg Type
34,771
Chickens, Broiler Type
669,099
Turkeys, All Breeds
30,861
[Results from the monthly Chicken and Egg Report and the monthly Turkey Hatchery Report].
36,320 638,539
28,644
% of Year Ago
--Percent-104 95 93
POULTRY HATCHING AND PLACEMENT, AUGUST 2008-2009
January thru August
Item
2008
2009
% of year ago
2008
2009
% of year ago
Pullet Chicks Placed Domestic (U.S.)1/
--Thousands--
--Percent--
--Thousands--
--Percent--
Broiler Type
7,792
8,031
103
58,221
59,044
101
Egg Type
278
279
100
1,972
1,980
100
Chicks Hatched - Broiler Type
Georgia
127,754
122,197
96
995,463
988,435
99
United States
826,599
799,625
97
6,416,472
6,459,543
101
Chicks Hatched- Egg Type
United States Turkey Poults Placed2/
36,930
36,301
98
302,352
317,806
105
United States
26,523
24,467
92
306,209
305,110
100
[Results from the monthly Chicken and Egg Report and the monthly Turkey Hatchery Report]. 1/ Domestic placements as reported by leading breeders includes expected pullet
replacements from eggs sold during the preceding month at the rate of 125 pullet chicks per 30 dozen case of eggs. 2/ Accumulated turkey poults placed are September 1 to current
month.
NUMBER OF LAYERS AND EGG PRODUCTION DURING AUGUST 2008-20091/
Number of Layers
Eggs per 100 Layers
Total Eggs Produced
2008
2009
2008
2009
2008
2009
--Thousands--
--Number--
--Millions--
GEORGIA
Hatching Table
9,626 9,464 2/
9,018 9,141 2/
1,953 2,143
1,941 2,197
188
175
205
203
Total Georgia
19,190
18,259
2,048
2,070
393
378
UNITED STATES
Hatching
58,832
57,453
1,922
1,918
1,131
1,102
Table
281,819
277,607
2,293
2,322
6,463
6,445
Total U.S.
340,651
335,060
2,229
2,252
7,594
[Results from the Monthly Chicken and Egg Report]. 1/ Totals may not add due to rounding. 2/ Table egg layers in flocks 30,000 and above.
7,547
USDA is an equal opportunity provider and employer.
COMMERCIAL POULTRY SLAUGHTER,1/ JULY AND AUGUST 2009
Item
Jul
Young Chickens
--Thousands--
Georgia
115,610
United States Mature Chickens
785,435
Light Type, U.S. Heavy Type, U.S. Total U.S.
5,941 7,887 13,828
Percent Condemned Young Chickens Georgia
--Percent-0.67
United States
0.94
1/ Federally inspected slaughter data as collected by Meat and Poultry Inspection Program.
Aug
108,502 743,511
5,577 7,446 13,023
0.65 0.90
% of Last Month --Percent--
94 95
94 94 94
January to Date --Thousands--
889,177 6,034,404
48,645 56,626 105,271 --Percent--
1.00 1.06
LIVESTOCK SLAUGHTER, UNITED STATES,1/ AUGUST 2008-2009
Number Slaughtered
Average Live Weight
Total Live Weight
Species
2008
2009
2009 as % of 2008
2008
2009
2008
2009
Cattle Calves Hogs Sheep & Lambs
--Thousand Head--
3,132.1
2,910.9
65.5
79.2
9,394.5
9,267.6
228.1
200.7
--Percent-93 121 99 88
--Pounds--
1,279
1,284
268
245
263
261
129
132
--Thousand Pounds--
3,993,828
3,726,689
17,435
19,135
2,470,996
2,415,430
29,314
26,507
[Results from the U.S. Livestock Slaughter Release]. 1/ Includes slaughter under Federal Inspection and other commercial slaughter, excludes farm slaughter.
PRICES RECEIVED BY FARMERS--SEPTEMBER 15, 2009
Commodity
Price per Unit Sep 2008
Georgia Aug 2009
Sep 15, 2009
Sep 2008
United States Aug 2009
Sep 15, 2009
Cotton
/Lb
55.60
58.00
1/
52.00
58.50
64.60
Cottonseed
$/Ton
2/
1/
1/
137.00
1/
253.00
Peanuts, In-Shell
/Lb
18.10
1/
1/
18.60
18.90
17.80
Calves Beef Cattle3/
Cows4/
/Lb /Lb /Lb
116.00 66.80 48.50
98.00 70.10 57.90
99.00 69.70 57.80
126.00 93.10 49.30
116.00 96.10 57.40
116.00 94.90 56.00
Steers & Heifers
/Lb
98.00
91.00
90.00
98.30
100.00
99.50
[Results from the Monthly Prices Received by Farmers]. 1/ Insufficient movement to establish a price. 2/ Insufficient sales to establish a price. 3/ "Cows," "Steers and Heifers"
combined. 4/ Beef cows and cull dairy cows sold for slaughter
INDEX NUMBERS--UNITED STATES, 2008-2009
2008
Index 1990-92=100
Aug
Sep
Aug
Prices Received
139
140
156
Prices Paid
161
162
192
Ratio1/
86
86
81
[Results from the monthly Prices Received by Farmers]. 1/ Ratio of index of prices received by farmers to index of prices paid.
2009
Sep 154 194 79
STOCKS OF PEANUTS AND SPECIFIED PRODUCTS AT MONTH'S END, UNITED STATES--20091/
Month Ending
Farmer Stocks
Shelled Peanuts2/
Roasting Stock (In Shell)
Farmer Stock Equivalent
Shelled Peanuts
Total3/
--Thousand Pounds--
Aug
123,790
411,443
48,767
547,219
719,776
[Results from the Peanut Stocks and Processing Report]. 1/ Excludes stocks on farms. Includes stocks owned by or held for account of CCC in commercial storages. Farmer stock on net weight basis. 2/ Includes shelled edible grades, shelled oil stock, and shelled seed (untreated). 3/ Actual farmer stock, plus roasting stock, plus shelled peanuts x 1.33.
State
PECANS: UTILIZED PRODUCTION BY VARIETY, GEORGIA AND UNITED STATES, OCTOBER 1, 2009 FORECAST
Improved Varieties1/
Native and Seedling
All Pecans
2009 as % 2008
--Thousand Pounds--
--Percent--
GA
68,000
2,000
70,000
47
US
171,300
32,760
204,060
53
[Results from the October 1 Pecan Inquiry] 1/ Budded, grafted, or topworked varieties.
2
GEORGIA ACREAGE, YIELD, AND PRODUCTION, 2008 AND OCTOBER 1, 2009 FORECAST
Area Harvested1/
Yield per Acre
Production
Crop
Unit
2008
Ind Oct 1, 2009
2008
Ind Oct 1, 2009
2008
Ind Oct 1, 2009
--1,000 Acres--
--1,000--
Corn for Grain Cotton, All2/
Bu Bales
450 995.0
320 940.0
130.0 801
130.0 812
58,500 1,660.00
41,600 1,590.00
Hay, All
Tons
670
700
1.80
2.00
1,206
1,400
Peanuts for Nuts
Lbs
520
685
3,120
3,250
1,622,400
2,226,250
Soybeans for Beans Bu
285
Tobacco3/
Lbs
18.5
410
30.0
16.5
2,150
30.0 2,200
8,550 39,775
12,300 36,300
Wheat, Winter
Bu
230
400
40.0
58.0
9,200
23,200
Apples
Lbs
1.3
4/
1,540
4/
2,000
12,000
Grapes
Tons
1.1
4/
2.64
4/
2.9
3.5
Peaches
Tons
12.0
4/
1.08
4/
13.0
35.0
[Results from the October Yield Survey]. 1/ Harvested for principal use. 2/ Cotton yield in pounds per harvested acre, production in 480 pound net weight bales. 3/ Type 14.
4/ Bearing acres and yield released January 2010 in Noncitrus Fruits and Nuts 2009 Preliminary Summary.
Commodity
OATS
SMALL GRAINS: AREA PLANTED, HARVESTED, YIELD, AND PRODUCTION, GEORGIA, 2008-2009
Area Planted1/
Area Harvested
Yield per Acre
Production
2008
2009
2008
2009
2008
2009
2008
2009
--1,000 Acres--
--Bushels--
--1,000 Bushels--
70
65
30
25
56.0
69.0
1,680
1,725
RYE
230
200
40
40
21.0
30.0
840
1,200
WINTER WHEAT
360
480
230
1/ Includes area planted preceding fall.
400
40.0
56.0
9,200
22,400
U.S. GRAIN STOCKS--SEPTEMBER 1, 2008-2009
Grain
On Farms
2008 Off Farms1/
All Positions
On Farms
2009 Off Farms1/
--1,000 Bushels--
Barley (Old Crop)
105,600
83,095
188,695
127,070
80,369
Corn
460,100
843,547
1,303,647
499,950
1,124,200
Oats (Old Crop)
53,650
34,710
88,360
52,800
66,275
Sorghum
2,150
29,903
32,053
3,550
49,200
Soybeans
143,000
430,810
573,810
47,000
158,034
All Wheat (Old Crop)
495,000
1,221,927
1,716,927
635,000
1,221,576
[Results from the September Agricultural Survey and the Grain Stocks Report]. 1/ Includes stocks at mills, elevators, warehouses, terminals, and processors.
All Positions
207,439 1,624,150
119,075 52,750
205,034 1,856,576
SELECTED FRESH MARKET VEGETABLES AND MELONS, AREA HARVESTED BY CROP, STATE AND TOTAL, FALL SEASON, 2008 AND FORECASTED AREA, 2009
Crop and State
Usual Harvest Period
Area
Area for
Harvested Harvest
2008
2009
--Acres--
2009 as % of
2008
--Percent--
Crop and State
Usual Harvest Period
Area
Area for
Harvested
Harvest
2008
2009
--Acres--
2009 as % of
2008
--Percent--
SNAP BEANS
CABBAGE
FL
Oct-Dec
10,300
8,500
83
FL
Oct-Dec
900
1,200
133
GA
Oct-Dec
5,300
4,800
91
GA
Oct-Dec
4,700
3,600
77
NJ
Sep-Oct
1,100
1,100
100
NJ
Sep-Nov
500
800
160
VA
Sep-Oct
1,800
1,800
100
TX
Sep-Nov
200
170
85
Total
18,500
16,200
88
Total
6,300
5,770
92
[Results from the Fresh Market Vegetable Acreage Inquiry].
3
MILK COWS AND MILK PRODUCTION, GEORGIA AND UNITED STATES--BY QUARTER, JULY-SEPTEMBER 2008-2009
Georgia
United States
Item
Unit
2008
2009
Percent
2008
2009
Percent
Milk Cows1/
Thousand Head
77
75
97
Milk per Cow2/ Pounds
4,050
4,070
100
9,159
9,277
101
5,034
5,049
100
Milk Production Million Pounds
312
305
98
46,110
46,841
102
[Results from the Milk Production Report]. 1/ Includes dry cows, excludes heifers not yet fresh. 2/ Excludes milk sucked by calves.
SHEEP AND LAMBS: NUMBER BY CLASS, UNITED STATES, JULY 1, 2007-2009
Class
All Sheep and Lambs Breeding Sheep and Lambs Replacement Lambs - Under One Year Old Ewes - One Year Old and Older Rams - One Year Old and Older Market
2007
7,600 4,540
645 3,710
185 3,060
2008 --1,000 Head--
7,600 4,540
645 3,710
185 3,060
2009
7,350 4,420
620 3,620
180 2,930
2009 as % of 2008 --Pct-97 97 96 98 97 96
GOATS: NUMBER BY CLASS, UNITED STATES, JULY 1, 2008-2009
Total
Breeding
Market
Kid Crop1/
Item
2008
2009
2008
2009
2008
2009
2008
2009
--Head--
Angora
260,000
230,000
205,000
180,000
55,000
50,000
108,000
100,000
Milk
335,000
350,000
285,000
295,000
50,000
55,000
220,000
230,000
Meat
3,000,000
3,150,000
2,200,000
2,330,000
800,000
820,000
1,610,000
1,700,000
All
3,595,000
3,730,000
2,690,000
2,805,000
905,000
925,000
1,938,000
2,030,000
1/ Kid Crop for 2007 refers to the actual kids born during 2007. Kid Crop for 2008 is the kids born alive between January 1 and June 30, 2008 plus the kids expected to be born July through December 2008.