- Collection:
- Georgia Government Publications
- Serial:
- Georgia farm report.
- Title:
- Georgia farm report, vol. 08, no. 08 (2008 August 29)
- Creator:
- Georgia. Department of Agriculture
- Contributor to Resource:
- United States. Department of Agriculture
United States. National Agricultural Statistics Service
United States. National Agricultural Statistics Service. Georgia Office - Publisher:
- Athens, Ga. : United States Department of Agriculture, National Agricultural Statistics Service, in cooperation with the Georgia Department of Agriculture, Georgia Field Office
- Date of Original:
- 2008-08-29
- Subject:
- Agricultural productivity--Georgia--Statistics
Crop yields--Georgia--Statistics - Location:
- United States, Georgia, 32.75042, -83.50018
- Medium:
- state government records
- Type:
- Text
- Format:
- application/pdf
- Description:
- Began in 1975?; ceased with vol. 10, no. 02 (Feb. 26, 2010).
"Agricultural statistician and Georgia Department of Agriculture."
Numbering began again with Vol. 11, no. 1 (Jan. 14, 2000).
Vols. for Aug. 31, 2005- issued by: USDA-NASS Georgia Field Office.
Description based on: Vol. 94, no, 1 (Jan. 4, 1994); title from caption.
Latest issue consulted: Vol. 10, no. 02 (Feb. 26, 2010). - External Identifiers:
- Call Number GA A400.C7 P1 F2 2008/8
- Metadata URL:
- https://dlg.galileo.usg.edu/id:dlg_ggpd_i-ga-ba400-pc7-bp1-bf2-b2008-s8-belec-p-btext
- Digital Object URL:
- https://dlg.galileo.usg.edu/do:dlg_ggpd_i-ga-ba400-pc7-bp1-bf2-b2008-s8-belec-p-btext
- Language:
- eng
- Holding Institution:
- University of Georgia. Map and Government Information Library
- Rights:
-

United States Department of Agriculture National Agricultural Statistics Service
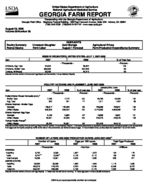
GEORGIA FARM REPORT
Cooperating with the Georgia Department of Agriculture Georgia Field Office Stephens Federal Building 355 East Hancock Avenue, Suite 320 Athens, GA 30601
(706) 546-2236 (706)546-2416 FAX www.nass.usda.gov
August 29, 2008 Volume 08-Number 08
Poultry Summary Peanut Stocks
Livestock Slaughter Farm Labor
HIGHLIGHTS Cold Storage August 1 Forecast
Agricultural Prices Farm Production Expenditures Summary
EGGS IN INCUBATORS, UNITED STATES--JULY 1, 2007-2008
Item
2007
2008
--Thousands--
Chickens, Egg Type
32,904
Chickens, Broiler Type
665,958
Turkeys, All Breeds
33,258
[Results from the monthly Chicken and Egg Report and the monthly Turkey Hatchery Report].
35,922 657,943
32,815
% of Year Ago
--Percent--
109 99 99
POULTRY HATCHING AND PLACEMENT, JUNE 2007-2008
January thru June
Item
2007
2008
% of year ago
2007
2008
% of year ago
Pullet Chicks Placed Domestic (U.S.)1/
--Thousands--
--Percent--
--Thousands--
--Percent--
Broiler Type
7,799
7,772
100
43,795
44,494
102
Egg Type
300
231
77
1,511
1,457
96
Chicks Hatched - Broiler Type
Georgia
125,317
122,423
98
740,093
742,941
100
United States
808,329
806,202
100
4,770,890
4,853,363
102
Chicks Hatched- Egg Type
Georgia
2,163
2,092
97
13,530
13,631
101
United States Turkey Poults Placed2/
40,641
42,538
105
229,470
243,576
106
United States
26,282
25,681
98
252,428
254,216
101
[Results from the monthly Chicken and Egg Report and the monthly Turkey Hatchery Report]. 1/ Domestic placements as reported by leading breeders includes expected pullet replacements
from eggs sold during the preceding month at the rate of 125 pullet chicks per 30 dozen case of eggs. 2/ Accumulated turkey poults placed are September 1 to current month.
NUMBER OF LAYERS AND EGG PRODUCTION DURING JUNE 2007-20081/
Number of Layers
Eggs per 100 Layers
Total Eggs Produced
2007
2008
2007
2008
2007
2008
--Thousands--
--Number--
--Millions--
GEORGIA
Hatching Table
9,752 9,247 2/
9,505 9,046 2/
1,887 2,129
1,873 2,110
184
178
199
193
Total Georgia
19,099
18,651
2,005
1,989
383
371
UNITED STATES
Hatching
59,664
59,309
1,865
1,846
1,113
1,095
Table
280,573
279,229
2,234
2,245
6,268
6,270
Total U.S.
340,237
338,538
2,169
2,176
7,380
[Results from the Monthly Chicken and Egg Report]. 1/ Totals may not add due to rounding. 2/ Table egg layers in flocks 30,000 and above.
7,366
USDA is an equal opportunity provider and employer.
COMMERCIAL POULTRY SLAUGHTER1/-- MAY AND JUNE 2008
Item
Apr
May
% of Last Month
--Thousands--
--Percent--
Young Chickens
Georgia
112,547
110,035
98
United States
761,980
747,663
98
Mature Chickens
Light Type, U.S. Heavy Type, U.S.
6,320
6,192
98
7,380
7,385
100
Total U.S.
13,700
13,577
99
Percent Condemned Young Chickens
--Percent--
Georgia
0.92
0.81
United States
1.00
0.97
1/ Federally inspected slaughter data as collected by Meat and Poultry Inspection Program.
January to Date --Thousands--
665,065 4,505,981
37,090 41,272 78,362
--Percent--
1.12 1.11
LIVESTOCK SLAUGHTER, UNITED STATES,1/ JUNE 2007-2008
Number Slaughtered
Average Live Weight
Total Live Weight
Species
2007
2008
2008 as % of 2007
2007
2008
2007
2008
Cattle Calves Hogs Sheep & Lambs
--Thousand Head--
3,076.5
2,955.5
61.3
75.4
8,297.2
8,884.7
200.6
192.4
--Percent--
96 123 107
96
--Pounds--
1,250
1,261
307
266
267
266
137
137
--Thousand Pounds--
3,833,514
3,716,859
18,664
19,833
2,210,482
2,358,949
27,412
26,279
[Results from the U.S. Livestock Slaughter Release]. 1/ Includes slaughter under Federal Inspection and other commercial slaughter, excludes farm slaughter.
COLD STORAGE STOCKS--UNITED STATES, JUNE 30, 2008
Commodity
Jun 30, 2007
May 31, 2008
Jun 30, 2008
% of Jun 2007
% of May 2008
Eggs, Frozen Meats, Red
Beef, Frozen Pork, Frozen Poultry, Frozen Peanuts, Shelled Peanuts, In Shell Pecans, Shelled Pecans, In Shell
17,411 919,683 430,323 467,949 1,100,147 337,598
19,802 41,154 45,214
--Thousand Pounds--
12,443 1,005,889
413,855 567,339 1,279,987 324,145
23,096 46,709 181,163
16,236 975,312 431,075 518,913 1,333,128 318,278
19,731 46,523 158,474
--Percent--
93
130
106
97
100
104
111
91
121
104
94
98
100
85
113
100
350
87
[Results from the monthly Cold Storage Report].
PRICES RECEIVED BY FARMERS--JULY 15, 2008
Georgia
United States
Commodity
Price per Unit Jul 2007
Jun 2008
Jul 15, 2008
Jul 2007
Jun 2008
Cotton
/Lb
43.20
57.90
56.70
45.20
60.40
Peanuts, In Shell
/Lb
18.30
20.10
19.70
18.70
20.10
Calves Beef Cattle1/
Cows2/ Steers & Heifers
/Lb /Lb /Lb /Lb
119.00 66.80 51.00 99.00
98.00 67.70 59.00 88.00
96.00 68.20 59.00 87.00
126.00 89.00 51.50 93.00
118.00 92.00 54.30 96.40
[Results from the monthly Prices Received by Farmers]. 1/ "Cows" and "steers and heifers" combined. 2/ Beef cows and cull dairy cows sold for slaughter.
Jul 15, 2008
60.30 20.00 115.00 95.70 56.40 100.00
INDEX NUMBERS--UNITED STATES, 2007-2008
Index
2007
2008
1990-92=100
Jun
Jul
Jun
Jul
Prices Received
137
139
158
161
Prices Paid Ratio1/
161
162
189
191
85
86
84
84
[Results from the monthly Prices Received by Farmers]. 1/ Ratio of index of prices received by farmers to index of prices paid.
STOCKS OF PEANUTS AND SPECIFIED PRODUCTS AT MONTH'S END, UNITED STATES--20081/
Month Ending
Farmer Stocks
Shelled Peanuts2/
Roasting Stock (In Shell)
Farmer Stock Equivalent
Shelled Peanuts
Total3/
--Thousand Pounds--
Jun
587,912
510,607
66,121
679,107
1,333,140
[Results from the Peanut Stocks and Processing Report]. 1/ Excludes stocks on farms. Includes stocks owned by or held for account of CCC in commercial storages. Farmer stock on net weight basis. 2/ Includes shelled edible grades, shelled oil stock, and shelled seed (untreated). 3/ Actual farmer stock, plus roasting stock, plus shelled peanuts x 1.33.
2
HIRED WORKERS: WAGE RATES FOR TYPE OF WORKER AND ALL HIRED WORKERS BY REGION AND UNITED STATES1/ JULY 8-14, 2007, AND JULY 6-12, 2008
Type of Hired Worker
Field
Livestock
Field and Livestock
Wage Rates for All Hired Workers
Region
2007
2008
2007
2008
2007
2008
2007
2008
Southeast2/ US3/
8.57 9.24
8.56 9.66
--Dollars per Hour--
8.52
8.27
8.55
8.50
9.73
9.98
9.37
9.74
9.12
9.00
9.99
10.34
See footnotes below.
HIRED WORKERS: NUMBER AND HOURS WORKED BY REGION AND UNITED STATES1/ JULY 8-14, 2007 AND JULY 6-12, 2008
Expected to be Employed
Number of Workers
150 Days or More
149 Days or Less
Number of Hours Worked
Region
2007
2008
2007
2008
2007
2008
2007
2008
--1,000--
--Hours per Week--
Southeast2/
31
41
22
29
9
12
US3/
843
828
596
585
247
243
[Results from the Agricultural Labor Survey]. 1/ Excludes agricultural service workers. 2/ Southeast: AL, GA, SC. 3/ Excludes AK.
--1,000--
36.3
36.6
41.4
40.5
GEORGIA ACREAGE, YIELD, AND PRODUCTION, 2006 AND AUGUST 1, 2007 FORECAST
Area Harvested1/
Yield per Acre
Production
Crop
Unit
2007
2008
2007
Ind 2008
2007
Ind 2008
--1,000 Acres--
--1,000--
Corn for Grain Cotton, All2/
Bu Bales
450 995.0
320 890.0
130.0 801
140.0 809
58,500 1,660.0
44,800 1,500.0
Hay, All
Tons
670
700
1.80
2.10
1,206
1,470
Peanuts for Nuts
Lbs
520
640
3,150
3,100
1,638,000
1,984,000
Soybeans for Beans Bu
Tobacco 3/
Lbs
275 18,500
405 16,000
30.0 2,150
30.0 2,450
8,250 39,775
12,150 39,200
Wheat, Winter
Bu
230
400
40.0
58.0
9,200
23,200
Apples
Lbs
1.3
4/
1,540
4/
2,000
12,000
Grapes
Tons
1.1
4/
2.64
4/
2.9
3.5
Peaches
Tons
12.0
4/
1.08
4/
13.0
35.0
1/ Harvested for principal use. 2/ Cotton yield in pounds per harvested acre, production in 480 pound net weight bales. 3/ Type 14. 4/ Bearing acres and yield released January 2008 in Noncitrus Fruits and Nuts 2007 Preliminary Summary.
State
AL FL GA SC US
PEANUTS: AREA HARVESTED, YIELD, AND PRODUCTION BY SELECTED STATES AND UNITED STATES, 2006-2007 AND AUGUST 1, 2008 FORECAST
Area Harvested
Yield
Production
2007
2008
2007
2008
2006
2007
2008
--1,000 Acres--
--Pounds--
--1,000 Pounds--
157
216
2,600
2,700
407,500
408,200
583,200
119
110
2,700
3,200
300,000
321,300
352,000
520
640
3,150
3,100
1,598,500
1,638,000
1,984,000
56
62
3,100
3,200
168,000
173,600
198,400
1,195
1,426
3,130
3,151
3,464,250
3,740,650
4,493,400
ALL COTTON: AREA HARVESTED, YIELD, AND PRODUCTION BY SELECTED STATES, AND UNITED STATES,
2006-2007 AND AUGUST 1, 2008 FORECAST
Area Harvested
Yield
Production1/
State
2007
2008
2007
2008
2006
2007
2008
--1,000 Acres--
--Pounds--
--1,000 Bales2/--
AL
385.0
300.0
519
701
675.0
416.0
438.0
FL
81.0
70.0
687
734
166.0
116.0
107.0
GA
995.0
890.0
801
809
2,334.0
1,660.0
1,500.0
SC
158.0
118.0
486
651
433.0
160.0
160.0
US
10,489.1
7,848.9
879
842
21,587.8
19,206.9
13,766.8
1/ Production ginned and to be ginned. 2/ 480-lb net weight bales.
3
GEORGIA FARM PRODUCTION EXPENDITURES: FARMS REPORTING, AVERAGE PER FARM, AND TOTAL 2006-2007
Farms Reporting
Average per Farm
Total Expenditures
Expenditure
2006
2007
2006
2007
2006
2007
Total Farm Production Expenditures1/ Livestock, Poultry & Related Expenses2/
--Percent--
100.0
100.0
33.2
19.8
--Dollars--
104,490
115,158
10,204
10,105
--Million Dollars-
5,120
5,470
500
480
Feed Farm Services3/ Rent4/ Agricultural Chemicals5/ Fertilizer, Lime & Soil Conditioners5/
73.8
64.5
28,571
29,474
1,400
1,400
95.3
95.0
14,286
14,737
700
700
24.5
31.0
3,673
4,000
180
190
41.8
55.5
4,694
5,474
230
260
77.2
62.0
5,714
7,789
280
370
Interest
27.2
32.1
4,082
5,474
200
260
Taxes (Real Estate & Property)
100.0
100.0
2,653
3,368
130
160
Labor
32.0
32.0
7,755
8,421
380
400
Fuels Farm Supplies & Repairs6/ Farm Improvements & Construction7/
76.1
92.6
5,306
6,737
260
320
73.1
90.4
4,694
5,263
230
250
50.2
46.2
3,469
4,211
170
200
Tractors and Self-Propelled Farm Machinery
21.7
19.2
2,245
3,158
110
150
Other Farm Machinery Seeds & Plants8/
32.4
19.1
1,020
842
50
40
44.9
32.5
4,898
4,842
240
230
Trucks & Autos
17.9
18.9
1,224
1,263
60
60
Miscellaneous Capital Expenditures9/
14.7
16.0
0
0
0
0
[Results from the Farm Production Expenditures Summary, August 2008 - 2007 ARMS III Survey]. 1/ Includes landlord and contractor share of farm production expenses. Totals may not add due to rounding. 2/ Includes purchases and leasing of livestock and poultry. Edit procedures have been upgraded over the last three years to better identify cattle farm records where not all livestock are owned. These `custom feeding' operations are now correctly recorded as production contracts, resulting in increased livestock purchases for contractors. 3/ Includes all crop custom work, veterinary custom services, transportation costs, marketing charges, insurance, leasing of machinery and equipment, general and miscellaneous business expenses, and utilities. 4/ Includes public and private grazing fees. 5/ Includes material and application costs. 6/ Includes bedding and litter, marketing containers, power farm shop equipment, oils and lubricants, miscellaneous non-capital equipment and supplies, repairs and maintenance of livestock and poultry equipment, and capital equipment for livestock and poultry. 7/ Includes all expenditures related to new construction or repairs of buildings, fences, operator dwelling (if dwelling is owned by operation), and any improvements to physical structures of land. 8/ Excludes bedding plants, nursery stock, and seed purchased for resale. Includes seed treatment. 9/ A zero in this line-item denotes less than 5 million dollars. Average value derived from expenditure rounding to zero will also be zero. Miscellaneous Capital Expense was estimated for the first time in 2005. In 2006, Miscellaneous Capital Expenses was added as a separate line-item to the publication. Summary inconsistencies with version five (Core) questionnaires dictated that Miscellaneous Expense be summarized with General Business Expense and rolled up into the Farms Services line-item.