- Collection:
- Georgia Government Publications
- Serial:
- Georgia farm report.
- Title:
- Georgia farm report, vol. 08, no. 06 (2008 June 30)
- Creator:
- Georgia. Department of Agriculture
- Contributor to Resource:
- United States. Department of Agriculture
United States. National Agricultural Statistics Service
United States. National Agricultural Statistics Service. Georgia Office - Publisher:
- Athens, Ga. : United States Department of Agriculture, National Agricultural Statistics Service, in cooperation with the Georgia Department of Agriculture, Georgia Field Office
- Date of Original:
- 2008-06-30
- Subject:
- Agricultural productivity--Georgia--Statistics
Crop yields--Georgia--Statistics - Location:
- United States, Georgia, 32.75042, -83.50018
- Medium:
- state government records
- Type:
- Text
- Format:
- application/pdf
- Description:
- Began in 1975?; ceased with vol. 10, no. 02 (Feb. 26, 2010).
"Agricultural statistician and Georgia Department of Agriculture."
Numbering began again with Vol. 11, no. 1 (Jan. 14, 2000).
Vols. for Aug. 31, 2005- issued by: USDA-NASS Georgia Field Office.
Description based on: Vol. 94, no, 1 (Jan. 4, 1994); title from caption.
Latest issue consulted: Vol. 10, no. 02 (Feb. 26, 2010). - External Identifiers:
- Call Number GA A400.C7 P1 F2 2008/6
- Metadata URL:
- https://dlg.galileo.usg.edu/id:dlg_ggpd_i-ga-ba400-pc7-bp1-bf2-b2008-s6-belec-p-btext
- Digital Object URL:
- https://dlg.galileo.usg.edu/do:dlg_ggpd_i-ga-ba400-pc7-bp1-bf2-b2008-s6-belec-p-btext
- Language:
- eng
- Holding Institution:
- University of Georgia. Map and Government Information Library
- Rights:
-

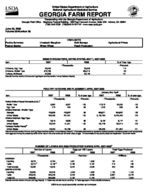
United States Department of Agriculture National Agricultural Statistics Service
GEORGIA FARM REPORT
Cooperating with the Georgia Department of Agriculture Georgia Field Office Stephens Federal Building 355 East Hancock Avenue, Suite 320 Athens, GA 30601
(706) 546-2236 (706)546-2416 FAX www.nass.usda.gov
June 30, 2008 Volume 08-Number 06
Poultry Summary Peanut Stocks
Livestock Slaughter Winter Wheat
HIGHLIGHTS Cold Storage
Peach Production
Agricultural Prices
EGGS IN INCUBATORS, UNITED STATES--MAY 1, 2007-2008
Item
2007
2008
--Thousands--
Chickens, Egg Type
35,948
39,643
Chickens, Broiler Type
679,796
665,215
Turkeys, All Breeds
32,856
[Results from the monthly Chicken and Egg Report and the monthly Turkey Hatchery Report].
33,148
% of Year Ago --Percent--
110 98
101
POULTRY HATCHING AND PLACEMENT--APRIL 2007-2008
January thru April
Item
2007
2008
% of year ago
2007
2008
% of year ago
--Thousands--
--Percent--
--Thousands--
--Percent--
Pullet Chicks Placed Domestic (U.S.)1/
Broiler Type
6,692
6,867
103
27,913
28,505
102
Egg Type
274
264
96
1,020
999
98
Chicks Hatched - Broiler Type
Georgia
123,523
120,937
98
485,571
494,907
102
United States
799,293
797,481
100
3,126,788
3,223,443
103
Chicks Hatched- Egg Type
Georgia
2,316
2,303
99
9,102
9,177
101
United States Turkeys Poults Placed2/
39,254
41,051
105
150,749
158,314
105
United States
26,034
25,796
99
198,880
201,384
101
Results from the monthly Chicken and Egg Report and the monthly Turkey Hatchery Report]. 1/ Domestic placements as reported by leading breeders includes expected pullet replacements from eggs sold during the preceding month at the rate of 125 pullet chicks per 30 dozen case of eggs. 2/ Accumulated turkey poults placed are September 1 to current month.
NUMBER OF LAYERS AND EGG PRODUCTION DURING APRIL 2007-20081/
Number of Layers
Eggs per 100 Layers
Total Eggs Produced
2007
2008
2007
2008
2007
2008
--Thousands--
--Number--
--Millions--
GEORGIA
Hatching Table
9,678 9,815 2/
9,734 9,106 2/
1,881 2,199
1,859 2,162
182
181
218
199
Total Georgia
19,593
18,940
2,042
2,006
400
380
UNITED STATES
Hatching
59,995
60,545
1,846
1,833
1,105
1,106
Table
283,840
280,048
2,228
2,236
6,367
6,278
Total U.S.
343,835
340,593
2,162
2,164
7,472
7,384
[Results from the Monthly Chicken and Egg Report]. 1/ Totals may not add due to rounding. 2/ Table egg layers in flocks 30,000 and above.
USDA is an equal opportunity provider and employer.
COMMERCIAL POULTRY SLAUGHTER1/-- MARCH AND APRIL 2008
Item
Mar
Apr
% of Last Month
--Thousands--
--Percent--
Young Chickens
Georgia
106,576
114,738
108
United States
725,871
769,270
106
Mature Chickens
Light Type, U.S.
6,319
6,571
104
Heavy Type, U.S.
6,465
6,960
108
Total U.S.
12,784
13,531
106
Percent Condemned Young Chickens
--Percent--
Georgia
1.36
1.08
United States
1.22
1/ Federally inspected slaughter data as collected by Meat and Poultry Inspection Program.
1.08
January to Date --Thousands--
442,483 2,994,169
24,578 26,507 51,085
--Percent--
1.25 1.17
LIVESTOCK SLAUGHTER--UNITED STATES,1/ APRIL 2007, 2008
Number Slaughtered
Average Live Weight
Total Live Weight
Species
2007
2008
2008 as % of 2007
2007
2008
2007
2008
--Thousand Head--
--Percent--
--Pounds--
--Thousand Pounds--
Cattle
2,701.4
2,959.6
110
1,235
1,259
3,324,065
3,714,432
Calves
56.9
73.3
129
348
278
19,691
20,128
Hogs
8,466.9
9,994.7
118
270
269
2,284,838
2,690,031
Sheep & Lambs
216.6
221.4
102
138
138
29,941
[Results form the U.S. Livestock Slaughter release]. 1/ Includes slaughter under Federal Inspection and other commercial slaughter, excludes farm slaughter.
30,609
PER CAPITA CONSUMPTION, RETAIL WEIGHT1/
Per capita consumption, Retail Lb.
2006
--Pounds--
Beef
65.8
Pork
49.4
Broilers
86.5
Turkeys
16.9
Total Red Meat & Poultry
221.3
Eggs, Number
257.8
1/ Livestock, Dairy and Poultry Outlook, May 16, 2008, LDP-M-167, Economic Research Service, USDA.
2007
65.2 50.8 85.4 17.5 221.6 250.1
COLD STORAGE STOCKS--UNITED STATES, APRIL 30, 2008
Commodity
Apr 30, 2007
Mar 31, 2008
Apr 30, 2008
% of Apr 2007
% of Mar 2008
--Thousand Pounds--
--Percent--
Eggs, Frozen
14,318
16,302
16,196
113
99
Meats, Red
970,254
1,098,783
1,104,502
114
101
Beef, Frozen
417,256
423,230
429,289
103
101
Pork, Frozen
528,527
652,683
652,220
123
100
Poultry, Frozen
972,933
1,197,125
1,249,481
128
104
Peanuts, Shelled
390,132
347,955
347,491
89
100
Peanuts, In Shell
15,619
16,681
20,207
129
121
Pecans, Shelled
40,724
40,345
43,052
106
107
Pecans, In Shell
75,069
229,780
208,294
277
91
[Results from the monthly Cold Storage Report].
2
PRICES RECEIVED BY FARMERS--MAY 15, 2008
Georgia
United States
Commodity
Price per Unit May 2007
Apr 2007
May 15, 2008 May 2007
Apr 2007
May 15, 2008
Cotton
/Lb
44.00
58.30
56.00
44.00
62.10
60.70
Peanuts, In Shell
/Lb
17.50
19.70
20.50
17.90
20.00
20.10
Calves Beef Cattle2/
Cows3/
/Lb /Lb /Lb
116.00 65.20 50.30
100.00 65.80 54.50
103.00 67.20 56.00
124.00 92.80 51.70
116.00 86.60 50.50
116.00 90.50 53.10
Steers & Heifers
/Lb
95.50
86.00
90.00
98.10
91.60
95.40
[Results from the monthly Prices Received by Farmers]. 1/ Price not published to avoid disclosure of individual firms. 2/ "Cows," "Steers and Heifers" combined. 3/ Beef cows and cull dairy
cows sold for slaughter.
INDEX NUMBERS--UNITED STATES, 2006-2007
Index
2007
1990-92=100
Apr
May
Apr
Prices Received
133
136
145
Prices Paid Ratio1/
160
161
181
83
84
80
[Results from the monthly Prices Received by Farmers]. 1/ Ratio of index of prices received by farmers to index of prices paid.
2008
May
150 184
82
STOCKS OF PEANUTS AND SPECIFIED PRODUCTS AT MONTH'S END, UNITED STATES--20081/
Month Ending
Farmer Stocks
Shelled Peanuts2/
Roasting Stock (In Shell)
Farmer Stock Equivalent
Shelled Peanuts
Total3/
--Thousand Pounds--
Apr
1,167,982
553,071
64,333
735,584
1,967,899
[Results from the Peanut Stocks and Processing Report]. 1/ Excludes stocks on farms. Includes stocks owned by or held for account of CCC in commercial storages. Farmer stock on net weight basis. 2/ Includes shelled edible grades, shelled oil stock, and shelled seed (untreated). 3/ Actual farmer stock, plus roasting stock, plus shelled peanuts x 1.33.
WINTER WHEAT--SELECTED STATES AND UNITED STATES, 2007-20081/
Area Harvested
Yield
Production
State
2007
Jun 1, 2008
2007
Jun 1, 2008
2007
Jun 1, 2008
--1,000 Acres--
--Bushels--
--1,000 Bushels--
AR
700
840
41.0
56.0
28,700
47,040
GA
230
350
40.0
55.0
9,200
19,250
KY
250
450
49.0
69.0
12,250
31,050
MS
330
425
56.0
57.0
18,480
24,225
NC
500
700
40.0
53.0
20,000
37,100
SC
135
170
31.0
54.0
4,185
9,180
TN
260
490
41.0
60.0
10,660
29,400
VA
205
250
64.0
66.0
13,120
16,500
US
35,952
40,162
42.2
45.3
1,515,989
1,817,364
1/ AL, FL, and LA state level estimates will be published in the "Small Grains 2008 Summary," to be released September 28, 2008.
3
PEACH TOTAL PRODUCTION SELECTED STATES--2006-2008
State
2006
2007
--Tons--
CA
All Clingstone1/
712,000 359,000
933,000 503,000
Freestone
353,000
430,000
GA
41,000
13,000
SC
60,000
12,500
Total
813,000
958,500
[Results from the June Peach Inquiry]. 1/ CA Clingstone is over-the-scale tonnage and includes culls and cannery diversions.
Jun 1, 2008 Forecast
810,000 380,000 430,000
35,000 65,000 910,000