- Collection:
- Georgia Government Publications
- Serial:
- Georgia farm report.
- Title:
- Georgia farm report, vol. 08, no. 04 (2008 April 30)
- Creator:
- Georgia. Department of Agriculture
- Contributor to Resource:
- United States. Department of Agriculture
United States. National Agricultural Statistics Service
United States. National Agricultural Statistics Service. Georgia Office - Publisher:
- Athens, Ga. : United States Department of Agriculture, National Agricultural Statistics Service, in cooperation with the Georgia Department of Agriculture, Georgia Field Office
- Date of Original:
- 2008-04-30
- Subject:
- Agricultural productivity--Georgia--Statistics
Crop yields--Georgia--Statistics - Location:
- United States, Georgia, 32.75042, -83.50018
- Medium:
- state government records
- Type:
- Text
- Format:
- application/pdf
- Description:
- Began in 1975?; ceased with vol. 10, no. 02 (Feb. 26, 2010).
"Agricultural statistician and Georgia Department of Agriculture."
Numbering began again with Vol. 11, no. 1 (Jan. 14, 2000).
Vols. for Aug. 31, 2005- issued by: USDA-NASS Georgia Field Office.
Description based on: Vol. 94, no, 1 (Jan. 4, 1994); title from caption.
Latest issue consulted: Vol. 10, no. 02 (Feb. 26, 2010). - External Identifiers:
- Call Number GA A400.C7 P1 F2 2008/4
- Metadata URL:
- https://dlg.galileo.usg.edu/id:dlg_ggpd_i-ga-ba400-pc7-bp1-bf2-b2008-s4-belec-p-btext
- Digital Object URL:
- https://dlg.galileo.usg.edu/do:dlg_ggpd_i-ga-ba400-pc7-bp1-bf2-b2008-s4-belec-p-btext
- Language:
- eng
- Holding Institution:
- University of Georgia. Map and Government Information Library
- Rights:
-

United States Department of Agriculture National Agricultural Statistics Service
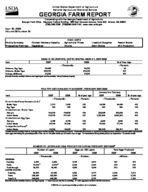
GEORGIA FARM REPORT
Cooperating with the Georgia Department of Agriculture Georgia Field Office Stephens Federal Building 355 East Hancock Avenue, Suite 320 Athens, GA 30601
(706) 546-2236 (706)546-2416 FAX www.nass.usda.gov
April 30, 2008 Volume 08-Number 04
Poultry Summary
Chicken Hatchery Capacity
Prospective Plantings Vegetables
HIGHLIGHTS Agricultural Prices
Onions
Livestock Slaughter Grain Stocks
Peanut Stocks Milk Production
EGGS IN INCUBATORS, UNITED STATES--MARCH 1, 2007-2008
Item
2007
2008
--Thousands--
Chickens, Egg Type
38,468
36,531
Chickens, Broiler Type
663,815
679,081
Turkeys, All Breeds
31,209
[Results from the monthly Chicken and Egg Report and the monthly Turkey Hatchery Report].
31,927
% of Year Ago --Percent--
95 102 102
POULTRY HATCHING AND PLACEMENT--FEBRUARY 2007-2008
January thru February
Item
2007
2008
% of year ago
2007
2008
% of year ago
Pullet Chicks Placed Domestic (U.S.)1/
--Thousands--
--Percent--
--Thousands--
--Percent--
Broiler Type
7,071
7,426
105
14,086
14,438
102
Egg Type
166
280
169
431
490
114
Chicks Hatched - Broiler Type
Georgia
114,722
118,523
103
242,665
246,284
101
United States
723,753
771,197
107
1,520,819
1,593,063
105
Chicks Hatched- Egg Type
Georgia
2,139
2,175
102
4,430
4,532
102
United States Turkeys Poults Placed2/
36,766
37,549
102
73,692
77,716
105
United States
24,249
24,963
103
146,413
149,171
102
Results from the monthly Chicken and Egg Report and the monthly Turkey Hatchery Report]. 1/ Domestic placements as reported by leading breeders includes expected pullet replacements from eggs sold during the preceding month at the rate of 125 pullet chicks per 30 dozen case of eggs. 2/ Accumulated turkey poults placed are September 1 to current month.
NUMBER OF LAYERS AND EGG PRODUCTION DURING FEBRUARY 2007-20081/
Number of Layers
Eggs per 100 Layers
Total Eggs Produced
2007
2008
2007
2008
2007
2008
--Thousands--
--Number--
--Millions--
GEORGIA
Hatching Table
9,636 10,019 2/
9,829 9,513 2/
1,733 2,026
1,811 2,081
Total Georgia
19,755
19,442
1,883
1,944
UNITED STATES
Hatching
59,558
60,535
1,692
1,771
Table
289,285
282,831
2,054
2,140
Total U.S.
348,843
343,366
1,993
2,075
[Results from the Monthly Chicken and Egg Report]. 1/ Totals may not add due to rounding. 2/ Table egg layers in flocks 30,000 and above.
167 205 372
1,008 5,943 6,951
178 200 378
1,072 6,053 7,125
USDA is an equal opportunity provider and employer.
CHICKEN HATCHERIES: NUMBER AND INCUBATOR EGG CAPACITY BY REGION AND UNITED STATES, JANUARY 1, 2007 AND 20081/
Geographic Region
20072/
Hatcheries
2008
Incubator Egg Capacity
20072/
2008
--Number--
--1,000--
North Atlantic
32
29
31,302
25,948
E North Central
22
22
23,968
26,582
W North Central
32
35
52,294
51,153
South Atlantic
83
81
307,594
295,029
South Central
118
123
448,673
472,194
West
26
25
46,250
45,736
US
313
315
910,081
916,642
1/ Hatchery capacity is defined as the number of eggs the machines can hold in a controlled environment favorable for hatching. All setter, hatcher, and inactive capacities are included. 2/
Revised.
COMMERCIAL POULTRY SLAUGHTER1/--JANUARY AND FEBRUARY 2008
Item
Jan
Feb
% of Last Month
--Thousands--
Young Chickens
Georgia
116,135
United States Mature Chickens
785,892
Light Type, U.S.
6,332
Heavy Type, U.S.
6,637
Total U.S. Percent Condemned Young Chickens
12,969
--Percent--
Georgia
1.17
United States
1.16
1/ Federally inspected slaughter data as collected by Meat and Poultry Inspection Program.
105,034 707,985
5,356 6,445 11,801
1.37 1.19
--Percent--
90 90
85 97 91
January to Date --Thousands--
221,169 1,493,877
11,688 13,082 24,770
--Percent--
1.27 1.18
LIVESTOCK SLAUGHTER--UNITED STATES,1/ FEBRUARY 2007-2008
Number Slaughtered
Average Live Weight
Total Live Weight
Species
2007
2008
2008 as % of 2007
2007
2008
2007
2008
--Thousand Head--
--Percent--
--Pounds--
--Thousand Pounds--
Cattle
2,561.2
2,643.2
103
1,274
1,285
3,249,960
3,383,319
Calves
66.7
69.1
104
308
272
20,375
18,577
Hogs
8,117.3
9,378.1
116
269
271
2,183,764
2,534,773
Sheep & Lambs
204.7
211.4
103
140
143
28,708
30,111
[Results from the U.S. Livestock Slaughter Release]. 1/ Includes slaughter under Federal Inspection and other commercial slaughter, excludes farm slaughter.
Commodity
Cotton Cottonseed Peanuts, In Shell Calves Beef Cattle2/
Cows3/
Steers & Heifers
Price per Unit
/Lb $/Ton /Lb /Lb /Lb /Lb /Lb
PRICES RECEIVED BY FARMERS--MARCH 15, 2008
Georgia
Mar 2007
Feb 2008
Mar 15, 2008
Mar 2007
46.50
61.30
58.20
46.40
1/
156.00
1/
1/
17.50
20.60
19.60
17.80
116.00
110.00
109.00
122.00
66.30
72.20
69.20
91.60
48.60
54.60
54.00
47.20
91.80
92.00
91.00
97.70
United States Feb 2008
61.90 162.00
21.00 120.00
89.00 51.40 94.20
Mar 15, 2008
61.40 1/
20.90 120.00
88.70 52.20 93.80
[Results from the monthly Prices Received by Farmers]. 1/ Marketing year August-February. 2/"Cows," "Steers and Heifers" combined. 3/ Beef cows and cull dairy cows sold for slaughter.
INDEX NUMBERS--UNITED STATES, 2007-2008
Index
2007
1990-92=100
Feb
Mar
Feb
Prices Received
128
133
147
Prices Paid Ratio1/
156
159
173
82
84
85
[Results from the monthly Prices Received by Farmers]. 1/ Ratio of index of prices received by farmers to index of prices paid.
2
2008
Mar
150 176
85
STOCKS OF PEANUTS AND SPECIFIED PRODUCTS AT MONTH'S END, UNITED STATES--20081/
Month Ending
Farmer Stocks
Shelled Peanuts2/
Farmer Stock Equivalent
Roasting Stock (In Shell) Shelled Peanuts
Total3/
--Thousand Pounds--
Feb
1,872,378
513,778
66,982
683,325
2,622,685
[Results from the Peanut Stocks and Processing Report]. 1/ Excludes stocks on farms. Includes stocks owned by or held for account of CCC in commercial storages. Farmer stock on net
weight basis. 2/ Includes shelled edible grades, shelled oil stock, and shelled seed (untreated). 3/ Actual farmer stock, plus roasting stock, plus shelled peanuts x 1.33.
2008 GEORGIA AND UNITED STATES PROSPECTIVE PLANTINGS
Planted Acreage
Crop
2007
Georgia Intended 20081/
2008 as % of 2007
2007
United States Intended 20081/
2008 as % of 2007
--Thousands--
--Percent--
--Thousands--
--Percent--
Corn, All
510
370
73
93,600
86,014
92
Cotton
1,030
1,050
102
10,830
9,390
87
Hay, All2/
670
600
90
61,625
60,583
98
Oats3/
70
70
100
3,760
3,420
91
Peanuts
530
650
123
1,230
1,430
116
Sorghum, All
65
55
85
7,718
7,415
96
Soybeans
285
410
144
63,631
74,793
118
Tobacco2/
18.5
16.0
86
356
351
99
Wheat3/
360
480
133
60,433
63,803
106
[Results from the March 1 Agricultural Survey]. 1/ Intended plantings in 2008 as indicated by reports from farmers. 2/ Area harvested 2007; intended for harvest 2008. 3/ Includes acreage planted preceding fall.
SELECTED FRESH MARKET VEGETABLES AND MELONS, AREA HARVESTED BY CROP, STATE AND TOTAL, SPRING SEASON, 2007 AND PROSPECTIVE AREA, 2008
Crop
Usual
Area
Area for
2008 Crop
Usual
Area
Area for
2008
and
Harvest Harvested Harvest
as % of and
Harvest
Harvested Harvest
as % of
State
Period
2007
2008
2007 State
Period
2007
2008
2007
--Acres--
--Percent--
--Acres--
--Percent--
SNAP BEANS
CANTALOUP
FL
Apr-Jun
11,100
11,300
102
AZ
May-Aug
14,200
12,500
88
GA
Apr-Jun
8,000
7,300
91
CA
Apr-Jun
11,200
10,700
96
NJ
Jun-Aug
1,600
1,600
100
GA
Apr-Jun
4,600
5,600
122
TX
Apr-Jun
1,400
1,300
93
TOTAL
20,700
20,200
98
TOTAL
31,400
30,100
96
CABBAGE
WATERMELONS
FL
Apr-Jun
1,800
1,900
106
CA
Apr-Jun
3,400
3,600
106
GA
Apr-Jun
3,600
4,400
122
FL
Apr-Jul
24,800
24,300
98
NJ
May-Aug
1,000
1,000
100
TX
Apr-Jun
10,600
10,600
100
TX
Apr-Jun
500
600
120
TOTAL
6,900
7,900
114
TOTAL
38,800
38,500
99
[Results from the Fresh Market Vegetable Acreage Inquiry].
ONIONS--SPRING SEASON, BY STATE, 2007 AND FORECAST 20081/
Harvested
For Harvest
Yield for Acre
Production
State
2007
2008
2007
2008
2007
2008
--Acres--
--Cwt--
GA
12,000
11,000
270
250
Total
31,000
29,400
330
2/
[Results from the Georgia Onions, Acreage and Yield Inquiry]. 1/ Primarily fresh market. 2/ Published July 10, 2008.
--1,000 Cwt--
3,240 10,230
2,750 2/
3
GEORGIA GRAIN STOCKS--MARCH 1, 2007-2008
Grain
On Farms
2007 Off Farms1/
All Positions
On Farms
2008 Off Farms1/
All Positions
--1,000 Bushels--
Corn
*
6,964
*
*
8,656
*
Oats
*
77
*
*
34
*
[Results from the Grain Stocks Report]. 1/ Includes stocks at mills, elevators, warehouses, terminals and processors. * Data not published to avoid disclosure of individual operations.
U.S. GRAIN STOCKS--MARCH 1, 2007-2008
Grain
On Farms
2007 Off Farms1/
All Positions
On Farms
--1,000 Bushels--
Barley
38,310
78,756
117,066
28,270
Corn
3,330,000
2,738,250
6,068,250
3,780,000
Oats
33,900
37,158
71,058
31,000
Sorghum
17,100
125,122
142,222
26,100
Soybeans
910,000
876,887
1,786,887
593,000
Wheat
192,450
664,278
856,728
91,990
[Results from the Grain Stocks Report]. 1/ Includes stocks at mills, elevators, warehouses, terminals and processors.
2008 Off Farms1/
76,540 3,078,895
48,038 159,471 835,102 617,650
All Positions
104,810 6,858,895
79,038 185,571 1,428,102 709,640
MILK COWS AND MILK PRODUCTION--JANUARY-MARCH 2007-2008
Georgia
United States1/
Item
Unit
2007
2008
2008 as % of 2007
2007
2008
2008 as % of 2007
Milk Cows2/ Milk per Cow3/
Thous Head Pounds
77 4,950
77 4,715
100
9,138
9,250
101
95
5,040
5,141
102
Milk Production Mil Lbs
381
363
95
46,058
47,552
103
[Results from the Milk Production Report]. 1/ May not add due to rounding. 2/ Includes dry cows, excludes heifers not yet fresh. 3/ Excludes milk sucked by calves.