- Collection:
- Georgia Government Publications
- Serial:
- Georgia farm report.
- Title:
- Georgia farm report, vol. 08, no. 12 (2008 December 31)
- Creator:
- Georgia. Department of Agriculture
- Contributor to Resource:
- United States. Department of Agriculture
United States. National Agricultural Statistics Service
United States. National Agricultural Statistics Service. Georgia Office - Publisher:
- Athens, Ga. : United States Department of Agriculture, National Agricultural Statistics Service, in cooperation with the Georgia Department of Agriculture, Georgia Field Office
- Date of Original:
- 2008-12-31
- Subject:
- Agricultural productivity--Georgia--Statistics
Crop yields--Georgia--Statistics - Location:
- United States, Georgia, 32.75042, -83.50018
- Medium:
- state government records
- Type:
- Text
- Format:
- application/pdf
- Description:
- Began in 1975?; ceased with vol. 10, no. 02 (Feb. 26, 2010).
"Agricultural statistician and Georgia Department of Agriculture."
Numbering began again with Vol. 11, no. 1 (Jan. 14, 2000).
Vols. for Aug. 31, 2005- issued by: USDA-NASS Georgia Field Office.
Description based on: Vol. 94, no, 1 (Jan. 4, 1994); title from caption.
Latest issue consulted: Vol. 10, no. 02 (Feb. 26, 2010). - External Identifiers:
- Call Number GA A400.C7 P1 F2 2008/12
- Metadata URL:
- https://dlg.galileo.usg.edu/id:dlg_ggpd_i-ga-ba400-pc7-bp1-bf2-b2008-s12-belec-p-btext
- Digital Object URL:
- https://dlg.galileo.usg.edu/do:dlg_ggpd_i-ga-ba400-pc7-bp1-bf2-b2008-s12-belec-p-btext
- Language:
- eng
- Holding Institution:
- University of Georgia. Map and Government Information Library
- Rights:
-

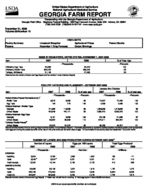
United States Department of Agriculture National Agricultural Statistics Service
GEORGIA FARM REPORT
Cooperating with the Georgia Department of Agriculture Georgia Field Office Stephens Federal Building 355 East Hancock Avenue, Suite 320 Athens, GA 30601
(706) 546-2236 (706)546-2416 FAX www.nass.usda.gov
December 31, 2008 Volume 08-Number 12
Poultry Summary Pecans
HIGHLIGHTS
Livestock Slaughter
Agricultural Prices
December 1 Crop Forecast
Cotton Ginnings
Peanut Stocks
EGGS IN INCUBATORS, UNITED STATES--NOVEMBER 1, 2007-2008
Item
2007
2008
--Thousands--
Chickens, Egg Type
34,466
Chickens, Broiler Type
632,225
Turkeys, All Breeds
31,146
[Results from the monthly Chicken and Egg Report and the monthly Turkey Hatchery Report].
34,424 585,025
27,490
% of Year Ago
--Percent--
100 93 88
POULTRY HATCHING AND PLACEMENT-- OCTOBER 2007-2008
January thru October
Item
2007
2008
% of year ago
2007
2008
% of year ago
Pullet Chicks Placed Domestic (U.S.)1/
--Thousands--
--Percent--
--Thousands--
--Percent--
Broiler Type
6,970
6,839
98
72,537
72,435
100
Egg Type
184
273
148
2,456
2,463
100
Chicks Hatched - Broiler Type
Georgia
121,892
113,259
93
1,238,056
1,216,680
98
United States
794,846
742,121
93
7,993,470
7,958,229
100
Chicks Hatched- Egg Type
Georgia
2,151
2,290
106
22,185
21,452
97
United States Turkeys Poults Placed2/
36,332
39,998
110
374,011
394,232
105
United States
25,222
22,222
88
49,295
44,737
91
Results from the monthly Chicken and Egg Report and the monthly Turkey Hatchery Report]. 1/ Domestic placements as reported by leading breeders includes expected pullet replacements from eggs sold during the preceding month at the rate of 125 pullet chicks per 30 dozen case of eggs. 2/ Accumulated turkey poults placed are September 1 to current month.
NUMBER OF LAYERS AND EGG PRODUCTION DURING OCTOBER 2007-20081/
Number of Layers
Eggs per 100 Layers
Total Eggs Produced
2007
2008
2007
2008
2007
2008
--Thousands--
--Number--
--Millions--
GEORGIA
Hatching Table
9,604 9,548 2/
8,760 9,324 2/
1,968 2,291
1,952 2,281
189
171
221
215
Total Georgia
19,252
18,184
2,130
2,123
410
386
UNITED STATES
Hatching
58,888
56,106
1,922
1,916
1,132
1,075
Table
283,749
278,454
2,324
2,348
6,594
6,538
Total U.S.
342,637
334,560
2,255
2,276
7,726
[Results from the monthly Chicken and Egg Report]. 1/ Totals may not add due to rounding. 2/ Table egg layers in flocks 30,000 and above.
7,613
USDA is an equal opportunity provider and employer.
COMMERCIAL POULTRY SLAUGHTER1/-- SEPTEMBER AND OCTOBER 2008
Item
Sep
Oct
% of Last Month
--Thousands--
--Percent--
Young Chickens
Georgia
111,465
113,273
102
United States
753,812
777,825
103
Mature Chickens
Light Type, U.S.
5,204
5,857
113
Heavy Type, U.S.
7,755
7,919
102
Total U.S.
12,959
13,776
106
Percent Condemned Young Chickens
--Percent--
Georgia
0.64
0.67
United States
0.89
0.89
1/ Federally inspected slaughter data as collected by Meat and Poultry Inspection Program.
January to Date --Thousands--
1,113,915 7,566,049
59,706 72,300 132,006
--Percent--
0.93 1.07
LIVESTOCK SLAUGHTER--UNITED STATES,1/ OCTOBER 2007, 2008
Number Slaughtered
Average Live Weight
Total Live Weight
Species
2007
2008
2008 as % of 2007
2007
2008
2007
2008
--Thousand Head--
--Percent--
--Pounds--
--Thousand Pounds--
Cattle
3,102.0
2,990.8
96
1,300
1,303
4,017,875
3,884,287
Calves
65.3
95.7
147
288
244
18,607
23,055
Hogs
10,656.6
10,750.7
101
270
269
2,870,727
2,893,860
Sheep & Lambs
248.4
225.0
91
132
133
32,760
[Results form the U.S. Livestock Slaughter release]. 1/ Includes slaughter under Federal Inspection and other commercial slaughter, excludes farm slaughter.
29,885
PRICES RECEIVED BY FARMERS-- NOVEMBER 15, 2008
Georgia
United States
Commodity
Price per Unit Nov 2007
Oct 2008
Nov 15, 2008
Nov 2007
Oct 2008
Nov 15, 2008
Cotton Cottonseed2/
/Lb $/Ton
59.50 148.00
1/ 220.00
1/ 188.00
57.40 158.00
55.50 237.00
50.80 223.00
Peanuts, In Shell
/Lb
21.70
20.20
21.20
21.70
20.60
20.60
Calves Beef Cattle3/
Cows4/
/Lb /Lb /Lb
107.00 62.50 44.00
91.00 60.80 51.60
91.00 60.40 48.40
122.00 89.90 43.90
107.00 87.90 48.30
106.00 87.20 44.70
Steers & Heifers
/Lb
88.00
77.20
76.90
96.00
93.00
93.00
[Results from the monthly Prices Received by Farmers]. 1/ Price not published to avoid disclosure of individual firms. 2/ Marketing year August-February. 3/ "Cows," "Steers and Heifers"
combined. 4/ Beef cows and cull dairy cows sold for slaughter.
3
INDEX NUMBERS--UNITED STATES, 2007-2008
Index
2007
1990-92=100
Oct
Nov
Oct
Prices Received
141
141
151
Prices Paid Ratio1/
163
165
187
87
85
81
[Results from the monthly Prices Received by Farmers]. 1/ Ratio of index of prices received by farmers to index of prices paid.
2008
Nov
139 183
76
STOCKS OF PEANUTS AND SPECIFIED PRODUCTS AT MONTH'S END, UNITED STATES--20081/
Month Ending
Farmer Stocks
Shelled Peanuts2/
Roasting Stock (In Shell)
Farmer Stock Equivalent
Shelled Peanuts
Total3/
--Thousand Pounds--
Oct
2,633,654
364,046
38,376
484,181
3,156,211
[Results from the Peanut Stocks and Processing Report]. 1/ Excludes stocks on farms. Includes stocks owned by or held for account of CCC in commercial storages. Farmer stock on net weight basis. 2/ Includes shelled edible grades, shelled oil stock, and shelled seed (untreated). 3/ Actual farmer stock, plus roasting stock, plus shelled peanuts x 1.33.
2
PECANS: UTILIZED PRODUCTION BY CROP, STATE, AND UNITED STATES, 2006-2007 AND FORECAST DECEMBER 1, 2008
Crop and State
2006
2007
2008
Improved Varieties1/ AL AZ AR2/ CA2/ FL2/
5,400 14,000
1,150 3,400
200
--1,000 Pounds--
8,700 23,000
1,500 4,400 1,700
6,300 15,500
550 4,000 1,400
GA LA MS2/ MO2/ NM NC2/ OK SC2/ TX US
36,000 3,500 2,000 160
47,000 420
5,000 900
33,000 152,130
135,000 3,000 2,200 2
74,000 160
3,000 1,500 44,000 302,162
63,000 1,500 900 140
45,000 510
2,000 1,800 20,000 162,600
Native & Seedling AL AR2/ FL2/ GA KS2/ LA MS2/ MO2/ NC2/ OK SC2/ TX US
600 1,050
300 6,000 2,000 17,500
500 940
80 12,000
200 14,000 55,170
1,300 800 200
15,000 500
11,000 800 3 40
27,000 500
26,000 83,143
700 450 300 2,000 1,500 3,500 400 820
90 6,000
700 10,000 26,460
All Pecans AL AZ AR2/ CA2/ FL2/ GA KS2/ LA MS2/ MO2/ NM NC2/ OK SC2/ TX US
6,000 14,000
2,200 3,400
500 42,000
2,000 21,000
2,500 1,100 47,000
500 17,000
1,100 47,000 207,300
10,000 23,000
2,300 4,400 1,900 150,000
500 14,000
3,000 5
74,000 200
30,000 2,000
70,000 385,305
1/ Budded, grafted, or topworked varieties. 2/ Estimates for current year carried forward from earlier forecast.
7,000 15,500
1,000 4,000 1,700 65,000 1,500 5,000 1,300
960 45,000
600 8,000 2,500 30,000 189,060
GEORGIA ACREAGE, YIELD AND PRODUCTION, 2007 AND DECEMBER 1, 2008 FORECAST1/
Crop
Area Harvested2/
Yield per Acre
Production
Unit
2007
Ind Dec 1, 2008
2007
Ind Dec 1, 2008
2007
Ind Dec 1, 2008
--Thousand Acres--
--Thousands--
Corn for Grain Cotton, Upland3/
Bu Bale
450 995.0
320
130
940.0
801
125
58,500
843
1,660.0
40,000 1,650.0
Hay, All Other
Ton
670
700
1.8
2.0
1,206
1,400
Peanuts
Lb
520
685
3,120
3,300
1,622,400
2,260,500
Soybeans for Beans Bu
285
410
30
30
8,550
12,300
Tobacco, Type 14 Lbs
18.5
16.5
2,150
2,200
39,775
36,300
Wheat, Winter Apples4/ Grapes4/ Peaches4/ Pecans6/
Bu Lbs Tons Tons Lbs
230 1.3 1.1 12.0
7/
400
40
5/
1,540
5/
2.64
5/
1.08
7/
7/
58
9,200
5/
2,000
5/
2.9
5/
13.0
7/
150,000
23,200 12,000
3.5 35.0 65,000
[Results from the December Yield Survey]. 1/ Updated from the "Crop Production" released December 12, 2008. 2/ Harvested for principal use. 3/ Cotton yield in pounds per harvested acre,
production in 480 net weight bales. 4/ Estimates brought forward from earlier forecast. 5/ Bearing acres and yield release January 2009 in Noncitrus 2008 Preliminary Summary. 6/ Utilized
production. 7/ Not available.
3
ALL COTTON-- DECEMBER 1, 2008 FORECAST BY STATES AND UNITED STATES
State
Acres for Harvest --1,000 Acres--
Yield --Pounds--
Production1/ --1,000 Bales2/--
2008 as % of 2007 --Percent--
AL
285.0
842
500.0
120
GA
940.0
843
1,650.0
99
SC
134.0
931
260.0
163
TN
280.0
917
535.0
89
US
7,755.0
843
13,613.0
71
1/ Production ginned and to be ginned. 2/ 480 lb. net weight bales.
Crop and State All Cotton
AL GA SC TN US
COTTON GINNINGS: EQUIVALENT 480-POUND BALES GINNED, CROP YEARS 2007-2008
2007
2008
333,600 1,043,200
126,450 584,650 12,592,650
364,950 1,079,050
177,700 518,100 8,946,350