- Collection:
- Georgia Government Publications
- Serial:
- Georgia farm report.
- Title:
- Georgia farm report, vol. 08, no. 01 (2008 January 31)
- Creator:
- Georgia. Department of Agriculture
- Contributor to Resource:
- United States. Department of Agriculture
United States. National Agricultural Statistics Service
United States. National Agricultural Statistics Service. Georgia Office - Publisher:
- Athens, Ga. : United States Department of Agriculture, National Agricultural Statistics Service, in cooperation with the Georgia Department of Agriculture, Georgia Field Office
- Date of Original:
- 2008-01-31
- Subject:
- Agricultural productivity--Georgia--Statistics
Crop yields--Georgia--Statistics - Location:
- United States, Georgia, 32.75042, -83.50018
- Medium:
- state government records
- Type:
- Text
- Format:
- application/pdf
- Description:
- Began in 1975?; ceased with vol. 10, no. 02 (Feb. 26, 2010).
"Agricultural statistician and Georgia Department of Agriculture."
Numbering began again with Vol. 11, no. 1 (Jan. 14, 2000).
Vols. for Aug. 31, 2005- issued by: USDA-NASS Georgia Field Office.
Description based on: Vol. 94, no, 1 (Jan. 4, 1994); title from caption.
Latest issue consulted: Vol. 10, no. 02 (Feb. 26, 2010). - External Identifiers:
- Call Number GA A400.C7 P1 F2 2008/1
- Metadata URL:
- https://dlg.galileo.usg.edu/id:dlg_ggpd_i-ga-ba400-pc7-bp1-bf2-b2008-s1-belec-p-btext
- Digital Object URL:
- https://dlg.galileo.usg.edu/do:dlg_ggpd_i-ga-ba400-pc7-bp1-bf2-b2008-s1-belec-p-btext
- Language:
- eng
- Holding Institution:
- University of Georgia. Map and Government Information Library
- Rights:
-

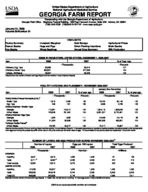
United States Department of Agriculture National Agricultural Statistics Service
GEORGIA FARM REPORT
Cooperating with the Georgia Department of Agriculture Georgia Field Office Stephens Federal Building 355 East Hancock Avenue, Suite 320 Athens, GA 30601
(706) 546-2236 (706)546-2416 FAX www.nass.usda.gov
January 31, 2008 Volume 08-Number 01
Poultry Summary Peanut Stocks Hay Stocks
Livestock Slaughter Hogs and Pigs Wheat Seedings
HIGHLIGHTS Cold Storage Onion Planting Intentions Annual Crop Summary
Agricultural Prices Grain Stocks Milk Production
EGGS IN INCUBATORS, UNITED STATES--DECEMBER 1, 2006-2007
Item
2006
2007
--Thousands--
Chickens, Egg Type
33,693
Chickens, Broiler Type
653,931
Turkeys, All Breeds
29,307
[Results from the monthly Chicken and Egg Report and the monthly Turkey Hatchery Report].
35,915 677,805
30,329
% of Year Ago
--Percent--
107 104 103
POULTRY HATCHING AND PLACEMENT-- NOVEMBER 2006-2007
January thru November
Item
2006
2007
% of year ago
2006
2007
% of year ago
--Thousands--
--Percent--
--Thousands--
--Percent--
Pullet Chicks Placed Domestic (U.S.)1/
Broiler Type
7,618
7,438
98
78,702
80,140
102
Egg Type
206
281
136
2,668
2,738
103
Chicks Hatched - Broiler Type
Georgia
115,631
120,012
104
1,354,115
1,388,826
103
United States
729,946
761,402
104
8,631,027
8,770,461
102
Chicks Hatched- Egg Type
Georgia
1,803
1,993
111
24,408
24,178
99
United States Turkeys Poults Placed2/
31,554
33,986
108
392,885
409,857
104
United States
23,792
25,077
105
72,217
74,367
103
Results from the monthly Chicken and Egg Report and the monthly Turkey Hatchery Report]. 1/ Domestic placements as reported by leading breeders includes expected pullet replacements from eggs sold during the preceding month at the rate of 125 pullet chicks per 30 dozen case of eggs. 2/ Accumulated turkey poults placed are September 1 to current month.
NUMBER OF LAYERS AND EGG PRODUCTION DURING NOVEMBER 2006-20071/
Number of Layers
Eggs per 100 Layers
Total Eggs Produced
2006
2007
2006
2007
2006
2007
--Thousands--
--Number--
--Millions--
GEORGIA
Hatching Table
9,581 9,711 2/
9,618 9,592 2/
1,889 2,263
1,903 2,260
181
183
222
219
Total Georgia
19,392
19,310
2,078
2,082
403
402
UNITED STATES
Hatching
57,033
58,827
1,829
1,853
1,043
1,090
Table
289,903
284,078
2,244
2,260
6,506
6,420
Total U.S.
346,936
342,905
2,176
2,190
7,549
[Results from the monthly Chicken and Egg Report]. 1/ Totals may not add due to rounding. 2/ Table egg layers in flocks 30,000 and above.
7,511
USDA is an equal opportunity provider and employer.
COMMERCIAL POULTRY SLAUGHTER1/--OCTOBER AND NOVEMBER 2007
Item
Oct
Nov
% of Last Month
--Thousands--
--Percent--
Young Chickens
Georgia
119,608
107,067
90
United States
811,386
722,861
89
Mature Chickens
Light Type, U.S.
4,781
4,502
94
Heavy Type, U.S.
7,390
6,212
84
Total U.S.
12,171
10,714
88
Percent Condemned Young Chickens
--Percent--
Georgia
0.70
0.81
United States
0.95
1/ Federally inspected slaughter data as collected by Meat and Poultry Inspection Program.
0.99
January to Date --Thousands--
1,215,582 8,183,960
51,250 70,388 121,638
--Percent--
0.89 1.09
LIVESTOCK SLAUGHTER--UNITED STATES,1/ NOVEMBER 2006, 2007
Number Slaughtered
Average Live Weight
Total Live Weight
Species
2006
2007
2007 as % of 2006
2006
2007
2006
2007
--Thousand Head--
--Percent--
--Pounds--
--Thousand Pounds--
Cattle
2,842.4
2,831.2
100
1,295
1,304
3,666,824
3,677,910
Calves
66.6
58.9
88
327
291
21,623
16,891
Hogs
9,364.9
10,050.7
107
272
272
2,542,375
2,735,130
Sheep & Lambs
224.2
236.7
106
137
136
30,744
[Results form the U.S. Livestock Slaughter release]. 1/ Includes slaughter under Federal Inspection and other commercial slaughter, excludes farm slaughter.
32,193
COLD STORAGE STOCKS--UNITED STATES, NOVEMBER 30, 2007
Commodity
Nov 30, 2006
Oct 31, 2007
Nov 30, 2007
% of Nov 2006
% of Oct 2007
--Thousand Pounds--
--Percent--
Eggs, Frozen
17,057
17,556
15,825
93
90
Meats, Red
1,009,877
1,001,778
966,209
96
96
Beef, Frozen
520,325
486,604
470,333
90
97
Pork, Frozen
468,476
494,751
477,436
102
97
Poultry, Frozen
911,936
1,088,912
919,252
101
84
Peanuts, Shelled
331,882
247,369
243,589
73
98
Peanuts, In Shell
17,412
13,867
14,024
81
101
Pecans, Shelled
27,662
19,238
19,968
72
104
Pecans, In Shell
42,779
18,505
53,824
126
291
[Results from the monthly Cold Storage Report].
PRICES RECEIVED BY FARMERS-- DECEMBER 15, 2007
Georgia
United States
Commodity
Price per Unit Dec 2006
Nov 2007
Dec 15, 2007
Dec 2006
Nov 2007
Dec 15, 2007
Cotton Cottonseed2/
/Lb $/Ton
50.60 94.00
58.20 148.00
58.40 148.00
49.00 120.00
57.00 160.00
57.20 171.00
Peanuts, In Shell
/Lb
17.30
21.70
20.30
17.60
21.70
20.90
Calves Beef Cattle3/
Cows4/
/Lb /Lb /Lb
109.00 59.20 46.80
107.00 58.50 44.00
106.00 59.00 44.10
116.00 83.10 42.20
119.00 89.70 43.90
119.00 89.10 44.10
Steers & Heifers
/Lb
83.30
88.00
88.00
89.00
95.90
95.50
[Results from the monthly Prices Received by Farmers]. 1/ Price not published to avoid disclosure of individual firms. 2/ Marketing year August-February. 3/ "Cows," "Steers and Heifers"
combined. 4/ Beef cows and cull dairy cows sold for slaughter.
INDEX NUMBERS--UNITED STATES, 2006-2007
Index
2006
1990-92=100
Nov
Dec
Nov
Prices Received
119
120
146
Prices Paid Ratio1/
148
149
161
80
81
91
[Results from the monthly Prices Received by Farmers]. 1/ Ratio of index of prices received by farmers to index of prices paid.
2
2007
Dec
151 162
93
STOCKS OF PEANUTS AND SPECIFIED PRODUCTS AT MONTH'S END, UNITED STATES--20071/
Month Ending
Farmer Stocks
Shelled Peanuts2/
Roasting Stock (In Shell)
Farmer Stock Equivalent
Shelled Peanuts
Total3/
--Thousand Pounds--
Nov
2,821,004
408,916
35,669
543,858
3,400,531
[Results from the Peanut Stocks and Processing Report]. 1/ Excludes stocks on farms. Includes stocks owned by or held for account of CCC in commercial storages. Farmer stock on net weight basis. 2/ Includes shelled edible grades, shelled oil stock, and shelled seed (untreated). 3/ Actual farmer stock, plus roasting stock, plus shelled peanuts x 1.33.
HOGS AND PIGS: BREEDING, MARKET, AND TOTAL INVENTORY AND INVENTORY NUMBER BY WEIGHT GROUP, GEORGIA AND UNITED STATES, DECEMBER 1, 2006-2007
Breeding
Market
Total
Under 60 Lbs
60-119 Lbs
120-179 Lbs 180 Lbs and Over
State 2006 2007 2006 2007 2006 2007 2006 2007 2006 2007 2006 2007 2006 2007
--1000 Head--
GA
38
40
207
225
245
265
96
94
46
51
35
41
30
39
US
6,087
6,157 56,402 58,953 62,490 65,110
[Results from the December Quarterly Hogs and Pigs Report].
20,462 21,364
13,928 14,459
11,275 11,737
10,738
11,394
ANNUAL FARROWINGS: NUMBER OF SOWS, PIGS PER LITTER, AND PIG CROP, GEORGIA AND UNITED STATES, DECEMBER-NOVEMBER 2006-20071/
Sows Farrowing
Pigs Per Litter
Pig Crop
State
2006
2007 Number 2007 as % of 2006 2006
2007
2006
2007 Number
--1,000 Head--
--Percent--
--Number--
--1,000 Head--
GA
83.0
75.0
90
US
11,629
11,960
103
8.90
8.91
739.0
668.0
9.08
9.19
105,618
109,937
[Results from the December Quarterly Hogs and Pigs Report]. 1/ December preceding year.
2007 as % of 2006 --Percent--
90 104
SPRING ONIONS--PLANTING INTENTIONS AND PROSPECTIVE ACRES FOR HARVEST,1/ GEORGIA AND TOTAL
Planted
Harvested
State
2005
2006
2007
2005
2006
--Acres--
GA Total2/
14,000 40,800
12,500 33,800
12,000 32,000
10,500 34,600
12,000 31,000
[Results from the Onions Acreage Intentions]. 1/ Primarily fresh market. 2/ Harvested acreage for 2007 will be published April 3, 2008.
For Harvest 2007
11,500
GEORGIA GRAIN STOCKS AND CAPACITY, DECEMBER 1, 2006-2007
Grain
On Farms
2006 Off Farms1/
All Positions
On Farms
2007 Off Farms1/
All Positions
--1,000 Bushels--
Corn
*
7,364
*
*
11,620
*
Oats
*
85
*
*
44
*
Wheat
*
*
*
*
*
*
Storage Capacity
70,000
42,000
112,000
70,000
42,500
112,500
[Results from the December Agricultural Survey and Grain Stocks Report]. 1/ Includes stocks at mills, elevators, warehouses, terminals, and processors. *Not published to avoid disclosing individual operations.
HAY STOCKS ON FARMS--GEORGIA AND UNITED STATES, 2006-2007
December 1
May 1
State
2006
2007
2006
GA
878
US
96,555
[Results from the December Agricultural Survey].
1,013 103,986
--1,000 Tons--
198 21,345
2007
82 15,013
WINTER WHEAT: AREA SEEDED, GEORGIA AND UNITED STATES, CROP YEAR 2006-2008
State
2006
2007
2008
--1,000 Acres--
GA
230
360
480
US
40,575
44,987
46,610
[Results from the December Agricultural Survey].
3
GEORGIA ANNUAL CROP SUMMARY, 2006, 2007
Crop
Year
Planted Acres
Harvested Acres
Yield per Acre
Unit
--1,000 Acres--
Corn, grain
2007
510
450
130
Bu
2006
280
225
112
Bu
Corn, silage
2007
40
18
Ton
2006
40
17
Ton
Cotton, lint
2007
1,030
995
796
1/
2006
1,400
1,370
818
1/
Cottonseed
2007
Ton
2006
Ton
Hay
2007
670
1.8
Ton
2006
650
1.8
Ton
Oats
2007
70
30
56
Bu
2006
70
30
53
Bu
Peanuts
2007
530
520
3,150
Lb
2006
580
575
2,780
Lb
Rye
2007
230
40
21
Bu
2006
230
25
26
Bu
Sorghum, Grain
2007
65
45
46
Bu
2006
40
26
45
Bu
Sorghum, Silage
2007
17
13
Ton
2006
11
11
Ton
Soybeans
2007
285
275
30
Bu
2006
155
140
25
Bu
Tobacco
2007
18.5
2,150
Lb
2006
17.0
1,770
Lb
Wheat
2007
360
230
40
Bu
2006
230
120
49
Bu
1/ Cotton yield pounds per acre; production 480 lb. bales.
Production --1,000--
58,500 25,200
720 680 1,650 2,334 524 699 1,206 1,170 1,680 1,590 1,638,000 1,598,500 840 650 2,070 1,170 221 121 8,250 3,500 39,775 30,090 9,200 5,880
PRELIMINARY MILK COWS AND MILK PRODUCTION, OCTOBER-DECEMBER 2006-2007
Georgia
United States
Item
Milk Cows1/ Milk per Cow2/
Unit
Thous Head Pounds
2006
75 4,400
2007
77 4,130
2007 as % of 2006
103 94
2006
9,115 4,894
2007
9,195 5,008
2007 as % of 2006
101 102
Milk Production Mil Lbs
330
318
96
44,611
46,045
103
[Results from the Milk Production Report]. 1/ Includes dry cows, excludes heifers not yet fresh. 2/ Excludes milk sucked by calves.