- Collection:
- Georgia Government Publications
- Serial:
- Georgia farm report.
- Title:
- Georgia farm report, vol. 07, no. 06 (2007 June 29)
- Creator:
- Georgia. Department of Agriculture
- Contributor to Resource:
- United States. Department of Agriculture
United States. National Agricultural Statistics Service
United States. National Agricultural Statistics Service. Georgia Office - Publisher:
- Athens, Ga. : United States Department of Agriculture, National Agricultural Statistics Service, in cooperation with the Georgia Department of Agriculture, Georgia Field Office
- Date of Original:
- 2007-06-29
- Subject:
- Agricultural productivity--Georgia--Statistics
Crop yields--Georgia--Statistics - Location:
- United States, Georgia, 32.75042, -83.50018
- Medium:
- state government records
- Type:
- Text
- Format:
- application/pdf
- Description:
- Began in 1975?; ceased with vol. 10, no. 02 (Feb. 26, 2010).
"Agricultural statistician and Georgia Department of Agriculture."
Numbering began again with Vol. 11, no. 1 (Jan. 14, 2000).
Vols. for Aug. 31, 2005- issued by: USDA-NASS Georgia Field Office.
Description based on: Vol. 94, no, 1 (Jan. 4, 1994); title from caption.
Latest issue consulted: Vol. 10, no. 02 (Feb. 26, 2010). - External Identifiers:
- Call Number GA A400.C7 P1 F2 2007/6
- Metadata URL:
- https://dlg.galileo.usg.edu/id:dlg_ggpd_i-ga-ba400-pc7-bp1-bf2-b2007-s6-belec-p-btext
- Digital Object URL:
- https://dlg.galileo.usg.edu/do:dlg_ggpd_i-ga-ba400-pc7-bp1-bf2-b2007-s6-belec-p-btext
- Language:
- eng
- Holding Institution:
- University of Georgia. Map and Government Information Library
- Rights:
-

United States Department of Agriculture National Agricultural Statistics Service
GEORGIA FARM REPORT
Cooperating with the Georgia Department of Agriculture Georgia Field Office Stephens Federal Building 355 East Hancock Avenue, Suite 320 Athens, GA 30601
(706) 546-2236 (706)546-2416 FAX www.nass.usda.gov
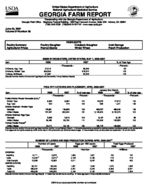
June 29, 2007 Volume 07-Number 06
Poultry Summary Agricultural Prices
Poultry Slaughter Peanut Stocks
HIGHLIGHTS Livestock Slaughter Winter Wheat
Cold Storage Peach Production
EGGS IN INCUBATORS, UNITED STATES, MAY 1, 2006-2007
Item
2006
2007
--Thousands--
Chickens, Egg Type
37,516
Chickens, Broiler Type
658,354
Turkeys, All Breeds
31,667
[Results from the monthly Chicken and Egg Report and the monthly Turkey Hatchery Report].
36,848 679,972
32,529
% of Year Ago
--Percent--
98 103 103
POULTRY HATCHING AND PLACEMENT, APRIL 2006-2007
January thru March
Item
2006
2007
% of year ago
2006
2007
% of year ago
Pullet Chicks Placed Domestic (U.S.)1/
--Thousands--
--Percent--
--Thousands--
--Percent--
Broiler Type
6,593
6,692
102
28,023
27,913
100
Egg Type
254
274
108
938
1,021
109
Chicks Hatched - Broiler Type
Georgia
122,591
126,528
103
485,707
498,040
103
United States
787,457
800,524
102
3,143,525
3,132,075
100
Chicks Hatched- Egg Type
Georgia
2,236
2,316
104
9,197
9,102
99
United States Turkey Poults Placed2/
35,435
39,704
112
142,808
153,933
108
United States
24,212
26,140
108
188,776
198,986
105
[Results from the monthly Chicken and Egg Report and the monthly Turkey Hatchery Report]. 1/ Domestic placements as reported by leading breeders includes expected pullet replacements
from eggs sold during the preceding month at the rate of 125 pullet chicks per 30 dozen case of eggs. 2/ Accumulated turkey poults placed are September 1 to current month.
NUMBER OF LAYERS AND EGG PRODUCTION DURING APRIL 2006-20071/
Number of Layers
Eggs per 100 Layers
Total Eggs Produced
2006
2007
2006
2007
2006
2007
--Thousands--
--Number--
--Millions--
GEORGIA
Hatching Table
9,711
9,678
1,854
1,881
180
182
10,025 2/
9,815 2/
2,163
2,199
219
218
Total Georgia
19,836
19,593
2,011
2,042
399
400
UNITED STATES
Hatching
58,701
59,245
1,831
1,845
1,075
1,093
Table
289,942
284,580
2,231
2,228
6,468
6,341
Total U.S.
348,643
343,825
2,164
2,162
7,543
[Results from the Monthly Chicken and Egg Report]. 1/ Totals may not add due to rounding. 2/ Table egg layers in flocks 30,000 and above.
7,434
USDA is an equal opportunity provider and employer.
COMMERCIAL POULTRY SLAUGHTER1/--MARCH AND APRIL 2007
Item
Mar
Apr
% of Last Month
Young Chickens
--Thousands--
--Percent--
Georgia
107,320
105,144
98
United States Mature Chickens
726,260
713,870
98
Light Type, U.S.
4,992
4,745
95
Heavy Type, U.S.
5,922
5,777
98
Total U.S.
10,914
10,522
96
Percent Condemned Young Chickens
--Percent--
Georgia
1.11
0.97
United States
1.22
1/ Federally inspected slaughter data as collected by Meat and Poultry Inspection Program.
1.14
January to Date --Thousands--
422,775 2,857,695
18,693 23,299 41,992
--Percent--
1.04 1.20
LIVESTOCK SLAUGHTER, UNITED STATES,1/ APRIL 2006-2007
Number Slaughtered
Average Live Weight
Total Live Weight
Species
2006
2007
2007 as % of 2006
2006
2007
2006
2007
--Thousand Head--
--Percent--
--Pounds--
--Thousand Pounds--
Cattle
2,608.6
2,701.6
104
1,240
1,235
3,222,245
3,324,260
Calves
47.7
56.9
119
361
347
17,156
19,674
Hogs
7,959.3
8,465.3
106
272
270
2,160,169
2,284,018
Sheep & Lambs
247.1
216.9
88
136
139
33,477
30,004
[Results from the U.S. Livestock Slaughter Release]. 1/ Includes slaughter under Federal Inspection and other commercial slaughter, excludes farm slaughter.
PER CAPITA CONSUMPTION, RETAIL WEIGHT1/
Per capita consumption, Retail Lb.
2005
--Pounds--
Beef
65.4
Pork
49.9
Broilers
85.6
Turkeys
16.7
Total Red Meat & Poultry
220.5
Eggs, Number
255.3
1/ Livestock, Dairy and Poultry Outlook, May 21, 2007, LDP-M-142, Economic Research Service, USDA.
2006
65.7 49.3 86.9 16.9 221.4 255.7
COLD STORAGE STOCKS--UNITED STATES, APRIL 30, 2006
Commodity
Apr 30, 2006
Mar 31, 2007
Apr 30, 2007
% of Apr 2006
% of Mar 2007
--Thousand Pounds--
--Percent--
Eggs, Frozen
23,259
14,632
14,319
62
98
Meats, Red
979,105
942,228
956,850
98
102
Beef, Frozen
441,266
425,895
411,813
93
97
Pork, Frozen
520,022
494,761
521,967
100
105
Poultry, Frozen
1,272,729
951,637
969,247
76
102
Peanuts, Shelled
372,893
381,211
380,503
102
100
Peanuts, In Shell
17,288
20,961
15,682
91
75
Pecans, Shelled
37,545
35,362
39,280
105
111
Pecans, In Shell
164,427
99,022
75,389
46
76
[Results from the monthly Cold Storage Report].
2
Commodity
Price per Unit
PRICES RECEIVED BY FARMERS--MAY 15, 2007
Georgia
May 2006
Apr 2007
May 15, 2007 May 2006
United States Apr 2007
Cotton
/Lb
46.20
47.00
46.90
46.40
47.30
Peanuts, In Shell
/Lb
16.60
18.00
17.50
17.30
18.30
Calves Beef Cattle1/
Cows2/
/Lb /Lb /Lb
124.00 65.70 50.10
118.00 66.30 49.70
117.00 65.90 50.70
134.00 82.20 47.40
127.00 94.30 49.20
Steers & Heifers
/Lb
96.00
95.80
95.50
86.30
99.90
[Results from the monthly Prices Received by Farmers]. 1/ "Cows" and "steers and heifers" combined. 2/ Beef cows and cull dairy cows sold for slaughter.
May 15, 2007
45.20 17.90 126.00 93.50 51.60 98.60
Index 1990-92=100
INDEX NUMBERS--UNITED STATES, 2006-2007
2006
Apr
May
Apr
Prices Received
111
111
134
Prices Paid
148
149
157
Ratio1/
75
74
85
[Results from the monthly Prices Received by Farmers]. 1/ Ratio of index of prices received by farmers to index of prices paid.
2007
May
138 158
87
STOCKS OF PEANUTS AND SPECIFIED PRODUCTS AT MONTH'S END, UNITED STATES--20071/
Month Ending
Farmer Stocks
Shelled Peanuts2/
Roasting Stock (In Shell)
Farmer Stock Equivalent
Shelled Peanuts
Total3/
--Thousand Pounds--
Apr
1,724,794
623,243
45,506
828,913
2,599,213
[Results from the Peanut Stocks and Processing Report]. 1/ Excludes stocks on farms. Includes stocks owned by or held for account of CCC in commercial storages. Farmer stock on net weight basis. 2/ Includes shelled edible grades, shelled oil stock, and shelled seed (untreated). 3/ Actual farmer stock, plus roasting stock, plus shelled peanuts x 1.33.
WINTER WHEAT--SELECTED STATES AND UNITED STATES, 2006-20071/
Area Harvested
Yield
Production
State
2006
Jun 1, 2007
2006
Jun 1, 2007
2006
Jun 1, 2007
--1,000 Acres--
--Bushels--
--1,000 Bushels--
AR
305
600
61.0
42.0
18,605
25,200
GA
120
250
49.0
40.0
5,880
10,000
KY
320
190
71.0
38.0
22,720
7,220
MS
73
300
59.0
59.0
4,307
17,700
NC
420
460
59.0
38.0
24,780
17,480
SC
123
135
50.0
30.0
6,150
4,050
TN
190
230
64.0
32.0
12,160
7,360
VA
155
175
68.0
61.0
10,540
10,675
US
31,117
37,222
41.7
43.2
1,298,081
1,609,679
1/ AL, FL, and LA state level estimates will be published in the "Small Grains 2006 Summary," to be released September 28, 2007.
3
State
CA All Clingstone1/ Freestone
GA SC Total
2005
PEACH TOTAL PRODUCTION SELECTED STATES 2006
--Tons--
869,000 484,000 385,000
40,000 75,000 984,000
712,000 359,000 353,000
41,000 60,000 813,000
Jun 1, 2007 Forecast
840,000 450,000 390,000
17,000 8,000
865,000
STEPHENS FEDERAL BLDG., SUITE 320 355 EAST HANCOC K AVE. ATHENS, GA 30601 PHONE 706-546-2236
ADDRESS SERVICE REQUEST ED