- Collection:
- Georgia Government Publications
- Serial:
- Georgia farm report.
- Title:
- Georgia farm report, vol. 07, no. 05 (2007 May 31)
- Creator:
- Georgia. Department of Agriculture
- Contributor to Resource:
- United States. Department of Agriculture
United States. National Agricultural Statistics Service
United States. National Agricultural Statistics Service. Georgia Office - Publisher:
- Athens, Ga. : United States Department of Agriculture, National Agricultural Statistics Service, in cooperation with the Georgia Department of Agriculture, Georgia Field Office
- Date of Original:
- 2007-05-31
- Subject:
- Agricultural productivity--Georgia--Statistics
Crop yields--Georgia--Statistics - Location:
- United States, Georgia, 32.75042, -83.50018
- Medium:
- state government records
- Type:
- Text
- Format:
- application/pdf
- Description:
- Began in 1975?; ceased with vol. 10, no. 02 (Feb. 26, 2010).
"Agricultural statistician and Georgia Department of Agriculture."
Numbering began again with Vol. 11, no. 1 (Jan. 14, 2000).
Vols. for Aug. 31, 2005- issued by: USDA-NASS Georgia Field Office.
Description based on: Vol. 94, no, 1 (Jan. 4, 1994); title from caption.
Latest issue consulted: Vol. 10, no. 02 (Feb. 26, 2010). - External Identifiers:
- Call Number GA A400.C7 P1 F2 2007/5
- Metadata URL:
- https://dlg.galileo.usg.edu/id:dlg_ggpd_i-ga-ba400-pc7-bp1-bf2-b2007-s5-belec-p-btext
- Digital Object URL:
- https://dlg.galileo.usg.edu/do:dlg_ggpd_i-ga-ba400-pc7-bp1-bf2-b2007-s5-belec-p-btext
- Language:
- eng
- Holding Institution:
- University of Georgia. Map and Government Information Library
- Rights:
-

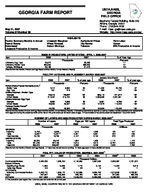
GEORGIA FARM REPORT
May 31, 2007 Volume 07-Number 05
USDA,NASS, GEORGIA
FIELD OFFICE
Stephens Federal Building, Suite 320 Athens, Georgia 30601 Phone: (706)546-2236 E-mail: nass -ga@nass.usda.gov Website: http://www.nass.usda.gov/ga/
Poultry Summary-Monthly & Annual Peanut Stocks Cottonseed Livestock Production & Income
HIGHLIGHTS
Livestock Slaughter
Agricultural Prices
Wheat Forecast
Hay Stocks
Cotton Ginnings
Tobacco
Farm Labor Cotton Milk Production & Income
EGGS IN INCUBATORS, UNITED STATES-- APRIL 1, 2006-2007
Item
2006
2007
--Thousands--
Chickens, Egg Type Chickens, Broiler Type
35,672 660,060
39,493 666,950
Turkeys, All Breeds
30,189
31,470
[Results from the Monthly Chicken and Egg Report and the Monthly Turkey Hatchery Report].
% of Year Ago
--Percent--
111 101 104
POULTRY HATCHING AND PLACEMENT--MARCH 2006-2007
January thru March
Item
2006
2007
% of year ago
2006
2007
% of year ago
Pullet Chicks Placed Domestic (U.S.)1/
--Thousands--
--Percent--
--Thousands--
--Percent--
Broiler Type
7,012
6,660
95
21,430
20,746
97
Egg Type
261
316
121
684
747
109
Chicks Hatched - Broiler Type
Georgia
126,415
128,847
102
363,116
371,512
102
United States
817,842
810,732
99
2,356,068
2,331,551
99
Chicks Hatched- Egg Type
Georgia
2,393
2,356
98
6,961
6,786
97
United States Turkeys Poults Placed2/
38,805
40,537
104
107,373
114,229
106
United States
25,230
26,630
106
164,564
173,043
105
Results from the monthly Chicken and Egg Report and the monthly Turkey Hatchery Report]. 1/ Domestic placements as reported by leading breeders includes expected pullet replacements
from eggs sold during the preceding month at the rate of 125 pullet chicks per 30 dozen case of eggs. 2/ Accumulated turkey poults placed are September 1 to current month.
NUMBER OF LAYERS AND EGG PRODUCTION DURING MARCH 2006-20071/
Number of Layers
Eggs per 100 Layers
Total Eggs Produced
2006
2007
2006
2007
2006
2007
GEORGIA Hatching Table Total Georgia UNITED STATES Hatching Table Total U.S.
--Thousands--
9,743 9,897 2/ 19,740
9,659 10,021 2/ 19,780
59,030 291,440 350,470
59,242 287,195 346,437
--Number--
1,919 2,291 2,107
1,936 2,361 2,154
1,884 2,310 2,238
1,896 2,314 2,243
--Millions--
169
167
204
205
373
372
1,112 6,732 7,843
1,123 6,646 7,769
[Results from the Monthly Chicken and Egg Report]. 1/ Totals may not add due to rounding. 2/ Table egg layers in flocks 30,000 and above.
POULTRY--VALUE OF PRODUCTION, GEORGIA, 2001-20061/
2001
2002
2003
2004
Commercial Broilers Mature Chickens,
Hatching Egg Flocks Table Egg Flocks All Chickens, Including Commercial Broilers Eggs All Poultry
2,432,235
11,380 104
2,443,719 367,887
2,811,606
1,935,750
10,329 93
1,946,172 355,968
2,302,140
--Thousand Dollars--
2,142,850
2,857,580
7,713 93
8,154 14
2,150,656 395,769
2,546,425
2,865,748 394,120
3,259,868
1/ The production year begins Dec 1 previous year and ends Nov 30 current year.
20052/
2,903,532
12,044 10
2,915,586 347,680
3,263,266
2006
2,731,022
8,918 11
2,739,951 368,736
3,108,687
USDA, NASS, COOPERATING WITH THE GEORGIA DEPARTMENT OF AGRICULTURE
COMMERCIAL POULTRY SLAUGHTER1/--FEBRUARY AND MARCH 2007
Item
Feb
Mar
% of Last Month
Young Chickens
--Thousands--
--Percent--
Georgia
100,056
107,320
107
United States Mature Chickens
667,643
726,260
109
Light Type, U.S.
4,322
4,992
116
Heavy Type, U.S.
5,506
5,922
108
Total U.S.
9,828
10,914
111
Percent Condemned Young Chickens
--Percent--
Georgia
1.14
1.11
United States
1.29
1/ Federally inspected slaughter data as collected by Meat and Poultry Inspection Program.
1.22
January to Date --Thousands--
317,631 2,143,825
13,948 17,522 31,470
--Percent--
1.06 1.22
Commodity
Price per Unit
PRICES RECEIVED BY FARMERS--APRIL 15, 2007
Georgia
Apr 2006
Mar 2007
Apr 15, 2007
Apr 2006
United States Mar 2007
Cotton
/Lb
47.80
47.90
47.40
48.50
47.40
Peanuts, In Shell
/Lb
16.80
17.50
18.30
17.40
17.80
Calves Beef Cattle1/
Cows2/
/Lb /Lb /Lb
123.00 66.40 50.80
116.00 65.90 48.60
119.00 66.00 48.80
137.00 84.80 48.40
124.00 92.00 47.20
Steers & Heifers
/Lb
94.20
91.80
96.70
89.20
97.70
[Results from the monthly Prices Received by Farmers]. 1/ "Cows" and "steers and heifers" combined. 2/ Beef cows and cull dairy cows sold for slaughter.
Apr 15, 2007
47.60 18.50 126.00 94.60 48.80 100.00
Index 1990-92=100
INDEX NUMBERS--UNITED STATES
2006
2007
Mar
Apr
Mar
Apr
Prices Received
113
111
134
135
Prices Paid
147
148
155
157
Ratio1/
77
75
86
86
[Results from the monthly Prices Received by Farmers]. 1/ Ratio of index of prices received by farmers to index of prices paid.
Commodity
Price per Unit
FEED--PRICES PAID, APRIL 2007
Southeast1/
2005
2006
2007
Cottonseed Meal, 41%
$/Cwt
15.80
17.10
18.20
Soybean Meal, 44%
$/Cwt
20.40
20.50
22.00
Corn Meal
$/Cwt
11.50
12.60
15.60
Broiler Grower
$/Ton
195.00
216.00
271.00
Chick Starter
$/Ton
227.00
227.00
277.00
Laying Feed
$/Ton
221.00
216.00
254.00
Dairy Conct., 32-38%
$/Ton
239.00
219.00
218.00
Beef Cattle Conct., 32%-36% $/Ton
358.00
[Results from Prices Paid by Farmers]. 1/ Southeast: AL, FL, GA, and SC.
321.00
354.00
2005
17.20 16.10
9.57 237.00 268.00 226.00 331.00 316.00
United States 2006
18.20 16.90 10.10 255.00 273.00 240.00 341.00 336.00
2007
20.00 18.20 12.30 306.00 327.00 278.00 378.00 370.00
HIRED WORKERS: WAGE RATES FOR TYPE OF WORKER AND ALL HIRED WORKERS BY REGION AND UNITED STATES1/
APRIL 9-15, 2006, AND APRIL 8-14, 2007
Type of Hired Worker
Field
Livestock
Field and Livestock
Wage Rates for All Hired Workers
Region
2006
2007
2006
2007
2006
2007
2006
2007
--Dollars per Hour--
Southeast2/
8.49
8.00
8.68
9.04
8.55
8.20
US3/
8.95
9.35
9.31
9.55
9.06
9.41
See footnotes below.
9.19 9.78
8.83 10.17
2
HIRED WORKERS: NUMBER AND HOURS WORKED BY REGION AND UNITED STATES1/ APRIL 9-15, 2006, AND APRIL 8-14, 2007
Expected to be Employed
Number of Workers
150 Days or More
149 Days or Less
Region
2006
2007
2006
2007
2006
2007
Southeast2/ US3/
--1,000--
31
33
720
720
--Hours per Week--
24
25
7
8
581
580
139
140
[Results from the Agricultural Labor Survey]. 1/ Excludes agricultural service workers. 2/ Southeast: AL, GA, SC. 3/ Excludes AK.
Number of Hours Worked
2006
2007
--1,000--
36.5
37.4
40.8
40.6
STOCKS OF PEANUTS AND SPECIFIED PRODUCTS AT MONTH'S END, UNITED STATES--20071/
Month Ending
Farmer Stocks
Shelled Peanuts2/
Roasting Stock (In Shell)
Farmer Stock Equivalent
Shelled Peanuts
Total3/
--Thousand Pounds--
Mar
2,042,672
607,715
54,281
808,261
2,905,214
[Results from the Peanut Stocks and Processing Report]. 1/ Excludes stocks on farms. Includes stocks owned by or held for account of CCC in commercial storages. Farmer stock on net weight basis. 2/ Includes shelled edible grades, shelled oil stock, and shelled seed (untreated). 3/ Actual farmer stock, plus roasting stock, plus shelled peanuts x 1.33.
Area Harvested
State
2006
2007
--1000 Acres--
GA
120
250
US
31,117
37,172
[Results based on the May Yield Survey].
WINTER WHEAT, 2006-2007
Yield
2006
2007
--Bushels--
49.0
40.0
41.7
43.5
Production
2006
2007
--1,000 Bushels--
5,880
10,000
1,298,081
1,615,613
State
2004
GA
1,345
US
114,516
[Results based on the May Yield Survey].
Dec 1 2005
1,350 105,205
HAY STOCKS ON FARMS, 2004-2007
2006
2005
--1,000 Tons--
878
292
96,397
27,758
May 1 2006
198 21,345
2007
82 14,988
State
GA US
Planted
1,400.0 15,274.0
UPLAND COTTON--ACREAGE, YIELD, AND PRODUCTION, 2006
Harvested
Yield
Production in 480-Lb. Net Weight Bales
--1,000 Acres--
--Pounds--
--1,000 Bales--
1,370.0
818
2,334.0
12,731.5
814
21,587.8
COTTONSEED--PRODUCTION AND FARM DISPOSITION, 2006
State
Production
Farm Disposition Sales to Oil Mills
Other1/
Seed for Planting2/
--1,000 Tons--
GA
699.0
447.0
252.0
5.8
US
7,347.9
3,608.3
3,739.6
72.8
1/ Includes planting seed, feed, exports, inter-farm sales, shrinkage, loss, and other uses. 2/ Included in "other" farm disposition. Planting seed from previous year's crop.
Type and State
Upland GA
All
US
COTTON GINNINGS: EQUIVALENT 480-POUND BALES GINNED, CROP YEARS 2005-2006
2005
2006
2,099,800 22,255,400
2,267,750 20,589,600
ALL TOBACCO--ACREAGE, YIELD, PRODUCTION AND VALUE OF PRODUCTION 20061/
State
Area Harvested
Yield
Production
Price per Pound
Value of Production
--Acres--
--Pounds--
--1,000 Pounds--
--Dollars--
--1,000 Dollars--
GA
17,000
US
338,900
1,770 2,144
30,090 726,644
1.440 1.668 2/
43,330 1,211,904 2/
1/ Revised. 2/ Includes estimated 2006 value of production for CT and MA type 61. Used 2005 CT and MA type 61 price to compute the 2006 value of production.
3
MILK--PRODUCTION AND INCOME, 20051/-20062/
Georgia
United States
Item
Unit
2005
2006
2005
2006
Number of Milk Cows3/
Thous Head
81
77
9,043
9,112
Milk Production per Cow
Pounds
17,259
18,234
19,565
19,951
Total Milk Production
Mil Lbs
1,398
1,404
176,929
181,798
Cash Receipts
Mil Dol
Value of Home Consumption4/ Mil Dol
Gross Income5/
Mil Dol
221.8 0.2
221.9
201.0 0.1
201.2
26,697.6 23.8
27,721.4
23,422.0 20.2
23,442.2
[Results from the Milk Production Report]. 1/ Revised. 2/ May not add due to rounding. 3/ Average number during year, excluding heifers not yet fresh. 4/ Valued at averaged returns per 100 pounds of milk in combined marketings of milk and cream. 5/ Cash receipts from marketings of milk and cream plus value of milk used for home consumption.
CATTLE--PRODUCTION AND INCOME, 2005-2006
Production1/
Average Price per 100 Pounds
Marketings2/
Cattle
Calves
Value of Production
Cash Receipts3/
Value of Home Consumption
Gross Income
--Thousand Pounds--
--Dollars--
--Thousand Dollars--
20055/
GA
382,103
432,135
68.60
125.00
315,397
357,433
4,547
361,980
US
41,448,342
53,161,063
89.70
135.00
36,628,658
49,295,310
459,077
49,754,387
2006
GA
361,027
390,945
63.90
122.00
281,506
308,196
4,089
312,285
US
42,102,317
54,739,022
87.20
133.00
35,740,774
49,148,364
448,739
49,597,103
[Results published in the Meat Animals Production, Disposition, and Income 2005 Summary]. 1/ Adjustments made for changes in inventory and for inshipments. 2/ Excludes custom slaughter for use on farms where produced and interfarm sales within the State. 3/ Receipts from marketings and sale of farm slaughter. 5/ Revised.
HOGS--PRODUCTION AND INCOME, 2005-2006
Production1/
Marketings2/
Average Price per 100 Pounds
Value of Production3/
Cash Receipts3/4/
Value of Home Consumption
Gross Income
20055/
--Thousand Pounds--
--Dollars--
--Thousand Dollars--
GA
148,470
151,826
52.00
78,254
82,267
520
82,787
US
27,416,074
28,378,188
50.20
13,606,780
14,992,406
34,761
15,027,167
2006
GA
125,083
132,444
46.10
60,835
65,929
457
66,386
US
28,140,468
29,171,884
46.00
12,703,842
14,085,346
31,374
14,116,720
[Results published in the Meat Animals Production, Disposition, and Income 2005 Summary]. 1/ Adjustments made for changes in inventory and for inshipments. 2/ Excludes custom slaughter for use on farms where produced and interfarm sales within the State. 3/ Includes allowance for higher average price of State inshipments and outshipments of feeder pigs. 4/ Receipts from marketings and sale of farm slaughter. 5/ Revised.
STEPHENS FEDERAL BLDG., SUITE 320 355 EAST HANCOC K AVE. ATHENS, GA 30601 PHONE 706-546-2236
ADDRESS SERVICE REQUEST ED