- Collection:
- Georgia Government Publications
- Serial:
- Georgia farm report.
- Title:
- Georgia farm report, vol. 07, no. 12 (2007 December 31)
- Creator:
- Georgia. Department of Agriculture
- Contributor to Resource:
- United States. Department of Agriculture
United States. National Agricultural Statistics Service
United States. National Agricultural Statistics Service. Georgia Office - Publisher:
- Athens, Ga. : United States Department of Agriculture, National Agricultural Statistics Service, in cooperation with the Georgia Department of Agriculture, Georgia Field Office
- Date of Original:
- 2007-12-31
- Subject:
- Agricultural productivity--Georgia--Statistics
Crop yields--Georgia--Statistics - Location:
- United States, Georgia, 32.75042, -83.50018
- Medium:
- state government records
- Type:
- Text
- Format:
- application/pdf
- Description:
- Began in 1975?; ceased with vol. 10, no. 02 (Feb. 26, 2010).
"Agricultural statistician and Georgia Department of Agriculture."
Numbering began again with Vol. 11, no. 1 (Jan. 14, 2000).
Vols. for Aug. 31, 2005- issued by: USDA-NASS Georgia Field Office.
Description based on: Vol. 94, no, 1 (Jan. 4, 1994); title from caption.
Latest issue consulted: Vol. 10, no. 02 (Feb. 26, 2010). - External Identifiers:
- Call Number GA A400.C7 P1 F2 2007/12
- Metadata URL:
- https://dlg.galileo.usg.edu/id:dlg_ggpd_i-ga-ba400-pc7-bp1-bf2-b2007-s12-belec-p-btext
- Digital Object URL:
- https://dlg.galileo.usg.edu/do:dlg_ggpd_i-ga-ba400-pc7-bp1-bf2-b2007-s12-belec-p-btext
- Language:
- eng
- Holding Institution:
- University of Georgia. Map and Government Information Library
- Rights:
-

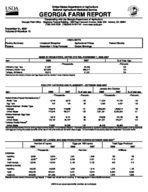
United States Department of Agriculture National Agricultural Statistics Service
GEORGIA FARM REPORT
Cooperating with the Georgia Department of Agriculture Georgia Field Office Stephens Federal Building 355 East Hancock Avenue, Suite 320 Athens, GA 30601
(706) 546-2236 (706)546-2416 FAX www.nass.usda.gov
December 31, 2007 Volume 07-Number 12
Poultry Summary Pecans
HIGHLIGHTS
Livestock Slaughter
Agricultural Prices
December 1 Crop Forecast
Cotton Ginnings
Peanut Stocks
EGGS IN INCUBATORS, UNITED STATES--NOVEMBER 1, 2006-2007
Item
2006
2007
--Thousands--
Chickens, Egg Type
31,562
Chickens, Broiler Type
607,694
Turkeys, All Breeds
29,615
[Results from the monthly Chicken and Egg Report and the monthly Turkey Hatchery Report].
34,450 633,577
31,081
% of Year Ago
--Percent--
109 104 105
POULTRY HATCHING AND PLACEMENT-- OCTOBER 2006-2007
January thru October
Item
2006
2007
% of year ago
2006
2007
% of year ago
Pullet Chicks Placed Domestic (U.S.)1/
--Thousands--
--Percent--
--Thousands--
--Percent--
Broiler Type
6,744
6,970
103
71,084
72,702
102
Egg Type
222
184
83
2,462
2,457
100
Chicks Hatched - Broiler Type
Georgia
123,370
124,959
101
1,238,484
1,268,814
102
United States
772,942
795,371
103
7,901,081
8,009,059
101
Chicks Hatched- Egg Type
Georgia
2,319
2,151
93
22,605
22,185
98
United States Turkeys Poults Placed2/
36,162
35,767
99
361,331
375,871
104
United States
24,891
25,395
102
48,425
49,468
102
Results from the monthly Chicken and Egg Report and the monthly Turkey Hatchery Report]. 1/ Domestic placements as reported by leading breeders includes expected pullet replacements from eggs sold during the preceding month at the rate of 125 pullet chicks per 30 dozen case of eggs. 2/ Accumulated turkey poults placed are September 1 to current month.
NUMBER OF LAYERS AND EGG PRODUCTION DURING OCTOBER 2006-20071/
Number of Layers
Eggs per 100 Layers
Total Eggs Produced
2006
2007
2006
2007
2006
2007
--Thousands--
--Number--
--Millions--
GEORGIA
Hatching Table
9,636 9,609 2/
9,604 9,548 2/
1,961 2,256
1,968 2,291
189
189
219
221
Total Georgia
19,345
19,252
2,109
2,130
408
410
UNITED STATES
Hatching
56,509
58,989
1,908
1,916
1,078
1,130
Table
288,029
282,501
2,291
2,324
6,600
6,565
Total U.S.
344,538
341,490
2,228
2,253
7,678
[Results from the monthly Chicken and Egg Report]. 1/ Totals may not add due to rounding. 2/ Table egg layers in flocks 30,000 and above.
7,695
USDA is an equal opportunity provider and employer.
COMMERCIAL POULTRY SLAUGHTER1/-- SEPTEMBER AND OCTOBER 2007
Item
Sep
Oct
% of Last Month
--Thousands--
--Percent--
Young Chickens
Georgia
107,240
119,608
112
United States
707,937
810,298
114
Mature Chickens
Light Type, U.S.
3,827
4,781
125
Heavy Type, U.S.
5,529
7,390
134
Total U.S.
9,356
12,171
130
Percent Condemned Young Chickens
--Percent--
Georgia
0.72
0.70
United States
0.96
1/ Federally inspected slaughter data as collected by Meat and Poultry Inspection Program.
0.95
January to Date --Thousands--
1,108,515 7,460,011
46,748 64,176 110,924
--Percent--
0.90 1.10
LIVESTOCK SLAUGHTER--UNITED STATES,1/ OCTOBER 2006, 2007
Number Slaughtered
Average Live Weight
Total Live Weight
Species
2006
2007
2007 as % of 2006
2006
2007
2006
2007
--Thousand Head--
--Percent--
--Pounds--
--Thousand Pounds--
Cattle
2,858.1
3,099.6
108
1,291
1,300
3,676,944
4,015,128
Calves
63.6
65.2
103
347
288
21,900
18,559
Hogs
9,632.0
10,654.4
111
269
270
2,589,179
2,870,108
Sheep & Lambs
237.3
248.0
105
131
132
31,139
[Results form the U.S. Livestock Slaughter release]. 1/ Includes slaughter under Federal Inspection and other commercial slaughter, excludes farm slaughter.
32,710
PRICES RECEIVED BY FARMERS-- NOVEMBER 15, 2007
Georgia
United States
Commodity
Price per Unit Nov 2006
Oct 2007
Nov 15, 2007
Nov 2006
Oct 2007
Nov 15, 2007
Cotton Cottonseed1/
/Lb $/Ton
51.10 93.00
54.60 140.00
55.30 148.00
47.40 113.00
55.20 153.00
54.00 160.00
Peanuts, In Shell
/Lb
16.80
20.20
2/
17.20
21.40
21.80
Calves Beef Cattle3/
Cows4/
/Lb /Lb /Lb
109.00 58.40 45.80
110.00 62.00 46.00
107.00 59.50 45.50
119.00 84.40 43.60
122.00 90.60 46.60
118.00 89.30 43.60
Steers & Heifers
/Lb
83.90
93.00
88.00
90.00
96.40
95.40
[Results from the monthly Prices Received by Farmers]. 1/ Marketing year August-February. 2/ Price not published to avoid disclosure of individual firms. 3/ "Cows," "Steers and Heifers"
combined. 4/ Beef cows and cull dairy cows sold for slaughter.
3
INDEX NUMBERS--UNITED STATES, 2006-2007
Index
2006
1990-92=100
Oct
Nov
Oct
Prices Received
115
119
141
Prices Paid Ratio1/
148
148
160
78
80
88
[Results from the monthly Prices Received by Farmers]. 1/ Ratio of index of prices received by farmers to index of prices paid.
2007
Nov
143 161
89
STOCKS OF PEANUTS AND SPECIFIED PRODUCTS AT MONTH'S END, UNITED STATES--20071/
Month Ending
Farmer Stocks
Shelled Peanuts2/
Roasting Stock (In Shell)
Farmer Stock Equivalent
Shelled Peanuts
Total3/
--Thousand Pounds--
Oct
2,120,138
405,019
31,984
538,675
2,690,797
[Results from the Peanut Stocks and Processing Report]. 1/ Excludes stocks on farms. Includes stocks owned by or held for account of CCC in commercial storages. Farmer stock on net weight basis. 2/ Includes shelled edible grades, shelled oil stock, and shelled seed (untreated). 3/ Actual farmer stock, plus roasting stock, plus shelled peanuts x 1.33.
2
PECANS: UTILIZED PRODUCTION BY CROP, STATE, AND UNITED STATES, 2005-2006 AND FORECAST DECEMBER 1, 2007
Crop and State
2005
2006
2007
Improved Varieties1/ AL AZ AR2/ CA2/ FL2/
3,200 22,000
1,100 3,950
300
--1,000 Pounds--
5,400 14,000
1,150 3,400
200
13,000 23,000
850 4,200
900
GA LA MS2/ MO2/ NM NC2/ OK SC2/ TX US
72,000 1,000 800 200
65,000 1,650 6,000 1,500
50,000 228,700
36,000 3,500 2,000 160
46,000 420
5,000 900
33,000 151,130
100,000 3,000 2,400 1
71,000 510
6,000 1,500 44,000 270,361
Native & Seedling AL AR2/ FL2/ GA KS2/ LA MS2/ MO2/ NC2/ OK SC2/ TX US
800 1,200
700 8,000 3,200 4,000
200 2,400
350 15,000
700 15,000 51,550
600 1,050
300 6,000 2,000 17,500
500 940
80 12,000
200 14,000 55,170
2,000 750 100
10,000 200
9,000 600 4 90
14,000 500
26,000 63,244
All Pecans AL AZ AR2/ CA2/ FL2/ GA KS2/ LA MS2/ MO2/ NM NC2/ OK SC2/ TX US
4,000 22,000
2,300 3,950 1,000 80,000 3,200 5,000 1,000 2,600 65,000 2,000 21,000 2,200 65,000 280,250
6,000 14,000
2,200 3,400
500 42,000
2,000 21,000
2,500 1,100 46,000
500 17,000
1,100 47,000 206,300
1/ Budded, grafted, or topworked varieties. 2/ Estimates for current year carried forward from earlier forecast.
15,000 23,000
1,600 4,200 1,000 110,000
200 12,000
3,000 5
71,000 600
20,000 2,000
70,000 333,605
Crop
GEORGIA ACREAGE, YIELD AND PRODUCTION, 2006 AND DECEMBER 1, 2007 FORECAST1/
Area Harvested2/
Yield per Acre
Production
Unit
2006
Ind Dec 1, 2007
2006
Ind Dec 1, 2007
2006
Ind Dec 1, 2007
--Thousand Acres--
--Thousands--
Corn for Grain Cotton, Upland3/
Bu Bale
225 1,370.0
470 1,010.0
112.0 818
118.0 784
25,200 2,334.0
55,460 1,650.0
Hay, All Other
Ton
650
600
1.80
1.70
1,170
1,020
Peanuts
Lb
575.0
520.0
2,780
3,050
1,598,500
1,586,000
Soybeans for Beans Bu
140
265
25.0
30.0
3,500
7,950
Tobacco, Type 14 Lbs
17.0
20.0
1,770
2,000
30,090
40,000
Wheat, Winter Apples4/ Grapes4/ Peaches4/ Pecans6/
Bu Lbs Tons Tons Lbs
120 1.3 1.1 11.5
7/
230
49.0
5/
10,000
5/
2.64
5/
3.57
7/
7/
40.0
5,880
5/
13,000.0
5/
2.9
5/
41.0
7/
42,000
9,200 3,000.0
3.1 13.0 100,000
[Results from the December Yield Survey]. 1/ Updated from "Crop Production" released November 9, 2007. 2/ Harvested for principal use. 3/ Cotton yield in pounds per harvested acre,
production in 480 pound net weight bales. 4/ Estimates brought forward from earlier forecast. 5/ Bearing acres and yield released January 2008 in Noncitrus Fruits and Nuts 2007 Preliminary
Summary. 6/ Utilized production. 7/ Not available.
3
ALL COTTON-- DECEMBER 1, 2007 FORECAST BY STATES AND UNITED STATES
State
Acres for Harvest --1,000 Acres--
Yield --Pounds--
Production1/ --1,000 Bales2/--
2007 as % of 2006 --Percent--
AL
390.0
492
400.0
59
GA
1,010.0
784
1,650.0
71
SC
178.0
418
155.0
36
TN
495.0
596
615.0
45
US
10,543.0
864
18,986.5
88
1/ Production ginned and to be ginned. 2/ 480 lb. net weight bales.
Crop and State All Cotton
AL GA SC TN US
COTTON GINNINGS: EQUIVALENT 480-POUND BALES GINNED, CROP YEARS 2006-2007
2006
2007
444,100 1,066,900
174,250 789,650 11,832,450
282,200 643,750
98,200 577,550 10,122,200