- Collection:
- Georgia Government Publications
- Serial:
- Georgia farm report.
- Title:
- Georgia farm report, vol. 06, no. 03 (2006 March 31)
- Creator:
- Georgia. Department of Agriculture
- Contributor to Resource:
- United States. Department of Agriculture
United States. National Agricultural Statistics Service
United States. National Agricultural Statistics Service. Georgia Office - Publisher:
- Athens, Ga. : United States Department of Agriculture, National Agricultural Statistics Service, in cooperation with the Georgia Department of Agriculture, Georgia Field Office
- Date of Original:
- 2006-03-31
- Subject:
- Agricultural productivity--Georgia--Statistics
Crop yields--Georgia--Statistics - Location:
- United States, Georgia, 32.75042, -83.50018
- Medium:
- state government records
- Type:
- Text
- Format:
- application/pdf
- Description:
- Began in 1975?; ceased with vol. 10, no. 02 (Feb. 26, 2010).
"Agricultural statistician and Georgia Department of Agriculture."
Numbering began again with Vol. 11, no. 1 (Jan. 14, 2000).
Vols. for Aug. 31, 2005- issued by: USDA-NASS Georgia Field Office.
Description based on: Vol. 94, no, 1 (Jan. 4, 1994); title from caption.
Latest issue consulted: Vol. 10, no. 02 (Feb. 26, 2010). - External Identifiers:
- Call Number GA A400.C7 P1 F2 2006/3
- Metadata URL:
- https://dlg.galileo.usg.edu/id:dlg_ggpd_i-ga-ba400-pc7-bp1-bf2-b2006-s3-belec-p-btext
- Digital Object URL:
- https://dlg.galileo.usg.edu/do:dlg_ggpd_i-ga-ba400-pc7-bp1-bf2-b2006-s3-belec-p-btext
- Language:
- eng
- Holding Institution:
- University of Georgia. Map and Government Information Library
- Rights:
-

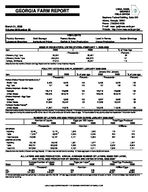
GEORGIA FARM REPORT
March 31, 2006 Volume 06-Number 03
USDA, NASS, GEORGIA
FIELD OFFICE
Stephens Federal Building, Suite 320 Athens, Georgia 30601 Phone: (706)546-2236 E-mail: nass -ga@nass.usda.gov Website: http://www.nass.usda.gov/ga/
Poultry Summary Livestock Slaughter
Cold Storage Agricultural Prices
HIGHLIGHTS Peanut Stocks Catfish & Trout Production
Land in Farms Honey Production
Cotton Ginnings
EGGS IN INCUBATORS, UNITED STATES--FEBRUARY 1, 2005-2006
Item
2005
2006
--Thousands--
Chickens, Egg Type
34,202
33,497
Chickens, Broiler Type
654,044
660,973
Turkeys, All Breeds
27,015
29,847
[Results from the monthly Chicken and Egg Report and the monthly Turkey Hatchery Report].
% of Year Ago --Percent--
98 101 110
POULTRY HATCHING AND PLACEMENT--JANUARY 2005-2006
January thru January
Item
2005
2006
% of year ago
2005
2006
% of year ago
Pullet Chicks Placed Domestic (U.S.)1/
--Thousands--
--Percent--
--Thousands--
--Percent--
Broiler Type
6,409
6,825
106
6,409
6,825
106
Egg Type
157
188
120
157
188
120
Chicks Hatched - Broiler Type
Georgia
123,719
123,833
100
123,719
123,833
100
United States
796,026
804,073
101
796,026
804,073
101
Chicks Hatched - Egg Type
Georgia
2,327
2,389
103
2,327
2,389
103
United States
37,936
35,422
93
37,936
35,422
93
Turkeys Poults Placed2/
United States
21,887
24,375
111
108,423
114,045
105
[Results from the monthly Chicken and Egg Report and the monthly Turkey Hatchery Report]. 1/ Domestic placements as reported by leading breeders includes expected pullet replacements from eggs sold during the preceding month at the rate of 125 pullet chicks per 30 dozen case of eggs. 2/ Accumulated turkey poults placed are September 1 to current month.
NUMBER OF LAYERS AND EGG PRODUCTION DURING JANUARY 2005-20061/
Number of Layers
Eggs per 100 Layers
Total Eggs Produced
2005
2006
2005
2006
2005
2006
--Thousands--
--Number--
--Millions--
GEORGIA
Hatching
9,245
9,174
1,925
1,929
178
177
2/
2/
Table
11,020
9,923
2,284
2,245
254
225
Total Georgia
20,365
19,197
2,121
2,094
432
402
UNITED STATES
Hatching
59,163
58,445
1,861
1,877
1,101
1,097
Table
288,701
290,808
2,260
2,278
6,526
6,624
Total U.S.
347,864
349,253
2,192
2,211
7,626
7,721
[Results from the Monthly Chicken and Egg Report]. 1/ Totals may not add due to rounding. 2/ Table egg layers in flocks 30,00 and above.
ALL LAYERS AND EGG PRODUCTION: ANNUAL AVERAGE NUMBER OF LAYERS, EGGS PER LAYER, AND TOTAL EGG PRODUCTION BY GEORGIA AND UNITED STATES, 2005-20061/
State
Average Number of Layers
2005
2006
Eggs per Layer2/
2005
2006
Total Egg Production
2005
2006
--Thousand--
--Number--
--Million Eggs--
GA
20,323
19,489
248
249
5,038
4,850
US3/
341,956
343,501
261
262
89,091
89,960
1/ Annual estimates cover the period Dec 1, previous year thru Nov 30. 2/ Total egg production divided by average number of layers on hand. 3/ Sum of States may not add to U.S. total due to rounding.
USDA, NASS COOPERATING WITH THE GEORGIA DEPARTMENT OF AGRICULTURE
COMMERCIAL POULTRY SLAUGHTER1/--DECEMBER 2005 AND JANUARY 2006
Item
Dec
Jan
% of Last Month
--Thousands--
--Percent--
Young Chickens
Georgia
103,478
106,567
103
United States
717,637
744,669
104
Mature Chickens
Light Type, U.S.
5,735
6,437
112
Heavy Type, U.S.
6,092
6,131
101
Total U.S.
11,827
12,568
106
Percent Condemned Young Chickens
--Percent--
Georgia
0.68
0.67
United States
1.02
1.00
1/ Federally inspected slaughter data as collected by Meat and Poultry Inspection Program.
January to Date --Thousands--
106,567 744,669
6,437 6,131 12,568
--Percent--
0.67 1.00
LIVESTOCK SLAUGHTER--UNITED STATES1/, JANUARY 2005-2006
Number Slaughtered
Average Live Weight
Species
2005
2006
2006 as % of 2005
2005
2006
--Thousand Head--
--Percent--
--Pounds--
Cattle
2,527.8
2,641.7
105
1,262
1,281
Calves
68.0
55.7
82
329
368
Hogs
8,480.0
8,915.7
105
270
273
Sheep & Lambs
208.5
223.7
107
138
144
1/ Includes slaughter under Federal Inspection and other commercial slaughter, excludes farm slaughter.
Total Live Weight
2005
2006
--Thousand Pounds--
3,189,651
3,385,304
22,342
20,463
2,288,913
2,435,864
28,760
32,236
Species
Cattle Calves Hogs Sheep
1/ Preliminary.
NUMBER OF HEAD SLAUGHTERED--BY SPECIES, COMMERCIAL AND FARM, UNITED STATES, 2005
Total Commercial
Farm1/
Total Slaughter
--1,000 Head--
32,387.7
148.0
32,535.7
734.4
36.0
770.4
103,581.5
110.0
103,691.5
2,697.8
64.0
2,761.8
Commodity
Eggs, Frozen Meats, Red
Beef, Frozen Pork, Frozen Poultry, Frozen Peanuts, Shelled Peanuts, In Shell Pecans, Shelled Pecans, In Shell
SELECTED COLD STORAGE STOCKS--UNITED STATES, JANUARY 31, 2006
Jan 31, 2005
Dec 31, 2005
Jan 31, 2006
% of Jan 2005
% of Dec 2005
--Thousand Pounds--
--Percent--
18,577
21,018
22,751
122
108
966,846
884,373
1,005,542
104
114
453,261
434,442
456,366
101
105
498,681
428,529
528,464
106
123
980,549
1,134,544
1,213,883
124
107
357,520
263,923
282,222
79
107
14,585
21,670
17,829
122
82
21,494
17,020
22,603
105
133
137,743
98,287
193,050
140
196
PRICES RECEIVED BY FARMERS--FEBRUARY 15, 2006
Georgia
United States
Commodity
Price per Unit Feb 2005
Jan 2006
Feb 15, 2006
Feb 2005
Jan 2006
Feb 15, 2006
Cotton
/Lb
38.80
50.70
1/
49.50
38.30
48.60
1/
48.30
Cottonseed Peanuts, In Shell2/
$/Ton /Lb
3/ 18.50
74.00 17.00
72.00 17.30
111.00 18.60
102.00 17.60
98.20 18.20
Calves Beef Cattle4/ Cows5/
/Lb /Lb /Lb
125.00 68.60 53.20
130.00 65.60 47.60
135.00 70.00 51.50
129.00 88.80 52.50
141.00 95.10 47.30
142.00 92.60 48.50
Steers & Heifers /Lb
95.90
102.00
103.00
93.10
102.00
98.10
[Results from the monthly Prices Received by Farmers]. 1/ Based on sales during the first half of the month. 2/ Includes additional loan peanuts at loan value. 3/ Insufficient movement to establish a price. 4/ "Cows" and "Steers and Heifers" combined. 5/ Beef cows and cull dairy cows sold for slaughter.
2
INDEX NUMBERS, UNITED STATES
Index
2005
1990-92=100
Jan
Feb
Prices Received
111
114
Prices Paid Ratio1/
137
137
81
83
[Results from the monthly Prices Received by Farmers]. 1/ Ratio of index of prices received by farmers to index of prices paid.
Jan
113 146
77
2006
Feb
113 146
77
STOCKS OF PEANUTS AND SPECIFIED PRODUCTS AT MONTH'S END, UNITED STATES--20061/
Farmer Stock Equivalent
Month Ending Farmer Stocks
Shelled Peanuts2/ Roasting Stock (In Shell)
Shelled Peanuts
Total3/
--Thousand Pounds--
Jan
3,326,236
499,717
49,049
664,624
4,039,909
[results from the Peanut Stocks and Processing Report]. 1/ Excludes stocks on farms. Includes stocks owned by or held for account of CCC in commercial storages. Farmer stock on net weight basis. 2/ Includes shelled edible grades, shelled oil stock, and shelled seed (untreated). 3/ Actual farmer stock, plus roasting stock, plus shelled peanuts x 1.33.
TROUT--SALES OF FISH 12" OR LONGER, GEORGIA AND UNITED STATES
Number Sold
Pounds Sold
Average Value per Pound
20041/
2005
20041/
2005
20041/
2005
--Thousand--
--Dollars--
GA
300
450
420
500
1.97
1.66
US
49,591
55,501
57,636
59,672
1.03
1.05
[Results from the Trout Survey]. 1/ Revised.
Value of Sales
20041/
2005
--Thousand Dollars--
827
830
59,397
62,554
CATFISH--NUMBER OF OPERATIONS, WATER SURFACE, AND TOTAL SALES, GEORGIA AND UNITED STATES
Number of Operations
Water Surface Acres
Total Sales
State
Jan 1, 20051/
Jan 1, 2006
Jan 1, 20051/
Jan 1, 2006
20041/
2005
--Number--
--Acres--
--Thousand Dollars--
GA
55
60
1,090
1,300
1,475
2,066
US
1,158
1,035
173,590
170,370
480,175
482,125
[Results from the Catfish Grower Survey]. 1/ Revised.
NUMBER OF FARMS AND LAND IN FARMS, GEORGIA AND UNITED STATES 2003-2005
Number of Farms
Land in Farms
State
2004
2005
2004
--Number--
--Thousand Acres--
GA
49,000
49,000
10,700
US
2,112,970
2,100,990
936,295
[Results from the June Agricultural Survey].
2005
10,500 933,400
NUMBER OF FARMS: ECONOMIC SALES CLASS BY GEORGIA AND UNITED STATES, 2005
Economic Sales Class
$1,000 - $9,999 $10,000 - $99,999 $100,000 - $249,999 $250,000 - $499,999 $500,000 & Over
--Number--
GA
31,800
11,200
1,800
1,700
2,500
US
1,168,220
596,440
166,880
90,040
79,410
[Results from the June Agricultural Survey].
Total
49,000 2,100,990
LAND IN FARMS: ECONOMIC SALES CLASS BY GEORGIA AND UNITED STATES, 2005
Economic Sales Class
$1,000 - $9,999 $10,000 - $99,999 $100,000 - $249,999 $250,000 - $499,999 $500,000 & Over
--1,000 Acres--
GA
3,500
2,700
1,000
1,000
2,300
US
118,350
260,705
192,195
152,295
209,855
[Results from the June Agricultural Survey].
Total
10,500 933,400
3
COLONIES OF BEES: PRODUCTION, PRICE AND VALUE, GEORGIA AND UNITED STATES, 2004-20051/
Georgia
United States
Item
Unit
2004
2005
2004
2005
Honey Producing Colonies
1,000 Colonies
63
59
2,556
2,410
Yield per Colony
Pounds
49.0
49.0
71.8
72.5
Honey Production Stocks Dec 152/ Avg Price per Pound3/
1,000 Pounds 1,000 Pounds Cents
3,087 648 119
2,891 434 84
183,582 61,222 106.9
174,643 62,406 90.4
Value of Honey Production
1,000 Dollars
3,674
2,428
196,259
157,795
[Results from the Bee and Honey Inquiry]. 1/ For producers with 5 or more colonies. 2/ Stocks held by producers. 3/ Prices weighted by sales.
COTTON GINNINGS: RUNNING BALES GINNED PRIOR TO FEBRUARY 1, BY CROP, SELECTED STATES, AND UNITED STATES, CROP YEARS 2002-20051/
Crop and State
2002
2003
2004
All Cotton
AL
565,200
798,250
797,100
GA
1,544,250
2,037,050
1,749,150
SC
125,500
309,900
368,500
US
16,576,250
17,601,100
21,249,400
[Results from the Cotton Ginnings Report]. 1/ Excluding Linters.
2005
830,700 2,099,850
390,250 22,321,200
USDA, NASS, GEORGIA FIELD OFFICE
STEPHENS FEDERAL BLDG., SUITE 320 355 EAST HANCOCK AVE. ATHENS, GA 30601 PHONE 706-546-2236
ADDRESS SERVICE REQUESTED
FARM REPORT (ISSN 744-7280) is published monthly by the USDA, NASS, Georgia Field Office, 355 East Hancock Ave., Athens, GA 30601-5099. Periodicals postage paid at Athens, GA, and additional mailing offices. Postmaster: Send address changes to FARM REPORT, USDA, NASS, Georgia Field Office, Stephens Federal Building, Suite 320, 355 East Hancock Ave., Athens, GA 30601-5099.
NEWS PAPER TIME VALUE