- Collection:
- Georgia Government Publications
- Serial:
- Georgia farm report.
- Title:
- Georgia farm report, vol. 05, no. 07 (2005 July 29)
- Creator:
- Georgia. Department of Agriculture
- Contributor to Resource:
- United States. Department of Agriculture
United States. National Agricultural Statistics Service
United States. National Agricultural Statistics Service. Georgia Office - Publisher:
- Athens, Ga. : United States Department of Agriculture, National Agricultural Statistics Service, in cooperation with the Georgia Department of Agriculture, Georgia Field Office
- Date of Original:
- 2005-07-29
- Subject:
- Agricultural productivity--Georgia--Statistics
Crop yields--Georgia--Statistics - Location:
- United States, Georgia, 32.75042, -83.50018
- Medium:
- state government records
- Type:
- Text
- Format:
- application/pdf
- Description:
- Began in 1975?; ceased with vol. 10, no. 02 (Feb. 26, 2010).
"Agricultural statistician and Georgia Department of Agriculture."
Numbering began again with Vol. 11, no. 1 (Jan. 14, 2000).
Vols. for Aug. 31, 2005- issued by: USDA-NASS Georgia Field Office.
Description based on: Vol. 94, no, 1 (Jan. 4, 1994); title from caption.
Latest issue consulted: Vol. 10, no. 02 (Feb. 26, 2010). - External Identifiers:
- Call Number GA A400.C7 P1 F2 2005/7
- Metadata URL:
- https://dlg.galileo.usg.edu/id:dlg_ggpd_i-ga-ba400-pc7-bp1-bf2-b2005-s7-belec-p-btext
- Digital Object URL:
- https://dlg.galileo.usg.edu/do:dlg_ggpd_i-ga-ba400-pc7-bp1-bf2-b2005-s7-belec-p-btext
- Language:
- eng
- Holding Institution:
- University of Georgia. Map and Government Information Library
- Rights:
-

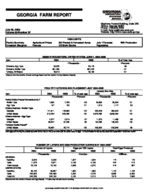
GEORGIA FARM REPORT
July 29, 2005 Volume 05-Number 07
Poultry Summary Livestock Slaughter
Agricultural Prices Peanuts
HIGHLIGHTS
GA Planted & Harvested Acres US Grain Stocks
Stephens Federal Building, Suite 320 Athens, Georgia 30601 Phone: (706)546-2236 E-mail: nass-ga@nass.usda.gov Website: http://www.nass.usda.gov/ga
July 1 Forecast Vegetables
Milk Production
EGGS IN INCUBATORS, UNITED STATES--JUNE 1, 2004-2005
Item
2004
2005
Chickens, Egg Type Chickens, Broiler Type Turkeys, All Breeds
34,678 661,255
29,910
--Thousands--
33,179 667,473
30,160
[Results from the monthly Chicken and Egg Report and the monthly Turkey Hatchery Report].
% of Year Ago --Percent--
96 101 101
POULTRY HATCHING AND PLACEMENT--MAY 2004-2005
January thru May
Item
2004
2005
% of year ago
2004
2005
% of year ago
--Thousands--
--Percent--
--Thousands--
--Percent--
Pullet Chicks Placed Domestic (U.S.)1/
Broiler Type
7,590
7,783
103
34,958
35,394
101
Egg Type
157
190
121
1,310
1,177
90
Chicks Hatched - Broiler Type
Georgia
121,611
123,890
102
592,348
600,604
101
United States
810,484
823,406
102
3,879,433
3,956,268
102
Chicks Hatched - Egg Type
Georgia
2,377
2,315
97
11,970
11,499
96
United States Turkeys Poults Placed2/
38,347
37,449
98
180,436
189,408
105
United States
23,692
23,714
100
209,304
200,349
96
[Results from the monthly Chicken and Egg Report and the monthly Turkey Hatchery Report]. 1/ Domestic placements as reported by leading breeders includes expected pullet replacements from eggs sold during the preceding month at the rate of 125 pullet chicks per 30 dozen case of eggs. 2/ Accumulated turkey poults placed are September 1 to current month.
NUMBER OF LAYERS AND EGG PRODUCTION DURING MAY 2004-20051/
Number of Layers
Eggs per 100 Layers
Total Eggs Produced
2004
2005
2004
2005
2004
2005
--Thousands--
--Number--
--Millions--
GEORGIA
Hatching
9,028
9,209
1,927
1,944
174
179
Table
11,078
9,971
2,185
2,186
242
218
Total Georgia
20,106
19,180
2,069
2,070
416
397
UNITED STATES
Hatching
60,163
59,697
1,862
1,898
1,120
1,133
Table
282,623
282,493
2,262
2,276
6,393
6,430
Total U.S.
342,786
342,190
2,192
2,210
7,513
7,563
[Results from the monthly Chicken and Egg Report]. 1/ Totals may not add due to rounding.
USDA/NASS COOPERATING WITH THE GEORGIA DEPARTMENT OF AGRICULTURE
COMMERCIAL POULTRY SLAUGHTER1/--APRIL AND MAY 2005
Item
Apr
May
% of Last Month
--Thousands--
--Percent--
Young Chickens
Georgia
100,761
107,405
107
United States
714,619
758,338
106
Mature Chickens
Light Type, U.S.
7,103
6,829
96
Heavy Type, U.S.
5,909
6,148
104
Total U.S.
13,012
12,977
100
Percent Condemned Young Chickens
--Percent--
Georgia
0.75
0.73
United States
0.99
1.00
1/ Federally inspected slaughter data as collected by Meat and Poultry Inspection Program.
January to Date --Thousands--
515,522 3,630,159
32,592 28,796 61,388
--Percent--
0.94 1.06
LIVESTOCK SLAUGHTER, UNITED STATES1/--MAY 2004-2005
Number Slaughtered
Average Live Weight
Total Live Weight
State
2004
2005
2005 as % of 2004
2004
2005
2004
2005
--1,000 Head--
--Percent--
--Pounds--
--1,000 Pounds--
Cattle
2,836.1
2,792.1
98
1,204
1,224
3,415,402
3,416,695
Calf
64.7
58.5
90
354
376
22,911
21,980
Hog
7,578.6
8,030.2
106
266
270
2,016,047
2,167,449
Sheep & Lambs
188.7
208.0
110
138
143
26,098
29,639
[Results from the U.S. Livestock Slaughter Release]. 1/ Includes slaughter under Federal Inspection and other commercial slaughter, excludes farm slaughter.
PRICES RECEIVED BY FARMERS--JUNE 15, 2005
Georgia
United States
Commodity
Price per Unit Jun 2004
May 2005
Jun 15, 2005
Jun 2004
May 2005
Jun 15, 2005
Cotton
/Lb
58.90
39.50
1/
39.50
59.90
42.00
40.70 1/
Peanuts, In-Shell
/Lb
19.70
2/
3/
20.30
17.80
17.80
Calves Cattle, All Beef 4/
Cows5/
/Lb /Lb /Lb
122.00 69.20 53.30
135.00 74.70 58.50
134.00 73.00 57.60
125.00 89.80 53.70
141.00 92.40 58.50
140.00 89.50 57.30
Steers & Heifers
/Lb
100.00
106.00
103.00
93.80
96.40
93.10
[Results from the monthly Prices Received by Farmers]. 1/ Based on sales during the first half of the month. 2/ Not published to avoid disclosure of individual firms. 3/ Insufficient sales to establish a price. 4/ "Cows," "Steers and Heifers" combined. 5/ Beef cows and cull dairy cows sold for slaughter.
INDEX NUMBERS, UNITED STATES--2004-2005
2004
May
Jun
UNITED STATES (1990-92 =100)
Prices Received
129
128
Prices Paid Ratio1/
135
135
96
95
[Results from the monthly Prices Received by Farmers]. 1/ Ratio of index of prices received by farmers to index of prices paid.
May
120 139
86
2005
Jun
120 139
86
STOCKS OF PEANUTS AND SPECIFIED PRODUCTS AT MONTH'S END, UNITED STATES--20051/
Farmer Stock Equivalent
Month Ending Farmer Stocks
Shelled Peanuts2/ Roasting Stock (In Shell)
Shelled Peanuts
Total3/
--Thousand Pounds--
May
990,830
688,727
92,026
916,007
1,998,863
[Results from the Peanut Stocks and Processing Report]. 1/ Excludes stocks on farms. Includes stocks owned by or held for account of CCC in commercial storages. Farmer stock on net weight basis. 2/ Includes shelled edible grades, shelled oil stock, and shelled seed (untreated). 3/ Actual farmer stock, plus roasting stock, plus shelled peanuts x 1.33.
2
AREA PLANTED AND FORECAST HARVESTED, GEORGIA AND UNITED STATES, 2004-2005
Georgia
United States
Area Planted
Area Harvested
Area Planted
Area Harvested
Crop
2004
2005
2004
2005
2004
2005
2004
2005
--Thousand Acres--
Corn
335
260
280
220
80,930
81,592
73,632
74,368
Cotton, Upland
1,290
1,200
1,280
1/
13,659
14,026
13,057
1/
Hay, All Oats2/
600
650
61,916
61,723
90
80
25
25
4,085
4,342
1,792
1,976
Peanuts Rye2/
620
780
610
770
1,430
1,649
1,394
1,612
250
270
25
20
1,380
1,440
320
323
Sorghum
45
50
25
30
7,486
7,013
6,517
6,030
Soybeans
280
200
270
190
75,208
73,303
73,958
72,384
Tobacco
23
16
408,040
316,860
Wheat, Winter2/
330
320
190
160
43,350
41,408
34,462
34,271
1/ Estimates to be released August 12, 2005 in the August Crop Production report. 2/ Includes area planted in preceding fall.
U.S. GRAIN STOCKS--JUNE 1, 2004-2005
2004
Grain
On Farms
Off Farms1/
All Positions
On Farms
--1,000 Bushels--
Barley (Old Crop)
28,320
91,988
120,308
41,100
Corn
1,540,000
1,430,140
2,970,140
2,462,300
Oats (Old Crop)
27,500
37,348
64,848
25,350
Sorghum
7,650
72,944
80,594
16,000
Soybeans
110,000
300,604
410,604
356,100
All Wheat (Old Crop)
131,880
414,559
546,439
161,275
1/ Includes stocks at mills, elevators, warehouses, terminals, and processors.
2005 Off Farms1/
87,604 1,857,657
32,613 88,369 343,544 378,566
All Positions
128,704 4,319,957
57,963 104,369 699,644 539,841
WINTER WHEAT: AREA HARVESTED, YIELD, PRODUCTION, GEORGIA AND UNITED STATES, 2004 AND FORECAST JULY 1, 2005
Area Harvested
Yield
Production
State
2004
2005
2004
2005
2004
2005
--1,000 Acres--
--Bushels--
--1,000 Bushels--
GA
190
160
45.0
52.0
8,550
8,320
US
34,462
34,271
43.5
44.5
1,499,434
1,525,302
[Results from the July Yield Survey].
TYPE 14 TOBACCO: AREA HARVESTED, YIELD, PRODUCTION, GEORGIA AND UNITED STATES, 2004 AND FORECAST JULY 1, 2005
Harvested Acres
Yield per Acre
Production
State
2004
2005
2004
2005
2004
2005
--Acres--
--Pounds--
--Thousand Lbs--
GA
23,000
16,000
2,030
1,900
46,690
30,400
US
27,000
18,800
2,092
1,989
56,490
37,400
[Results from the July Yield Survey].
PEACHES: TOTAL PRODUCTION, GEORGIA AND UNITED STATES, 2003-2004 AND FORECAST JULY 1, 2005
State
2003
2004
2005
2005 as % of 2004
--Tons--
--Percent--
GA
55,000
52,500
40,000
76
US
1,259,500
1,307,110
1,240,350
95
[Results from the Peach Inquiry].
3
ONIONS--SPRING SEASON, GEORGIA AND TOTAL, 2004 AND 2005
Area Planted
Area Harvested
Yield per Acre
State
2004
2005
2004
2004
2004
2005
--Acres--
--Acres--
--Cwt--
GA
16,500
13,500
14,500
11,000
260
240
Total
39,900
38,800
35,700
34,600
337
314
[Results from the Georgia Onions, Acreage, and Yield Inquiry].
Production
2004
Ind 2005
--1,000 Cwt--
3,770
2,640
12,031
10,875
Crop and State
SNAP BEANS GA MI NY VA
SELECTED FRESH MARKET VEGETABLES AND MELONS, AREA FOR HARVEST BY CROP, STATE AND TOTAL, SUMMER SEASON, 2004 AND FORECASTED AREA, 2005
Usual Harvest Period
Area Harvested
2004
Area for Harvest
2005
2005 as % of
2004
Crop and State
Usual Harvest Period
Area Harvested
2004
Area for Harvest
2005
--Acres--
--Percent--
--Acres--
CANTALOUP
Jun-Sep
2,500
3,000
120
CA
Jul-Sep
36,200
35,000
Jul-Oct
4,100
4,300
105
GA
Jun-Sep
2,000
1,900
Jun-Oct
7,600
7,500
99
SC
Jun-Sep
1,100
1,100
Jul-Sep
3,000
2,600
87
TX
Jul-Sep
4,000
3,200
2005 as % of
2004 --Percent--
97 95 100 80
Total
17,200
17,400
101
Total
43,300
41,200
95
CABBAGE GA MI NY
Jun-Sep Jun-Nov Jun-Sep
700 1,600 10,600
900 1,700 10,200
WATERMELON
129
CA
Jul-Sep
106
GA
Jun-Sep
96
MS
Jun-Sep
SC
Jun-Sep
TX
Jul-Sep
10,000
9,000
90
23,000
20,000
87
2,700
2,900
107
7,000
6,500
93
13,000
15,700
121
Total
12,900
12,800
[Results from the Fresh Market Vegetable Acreage Inquiry].
99
Total
55,700
54,100
97
MILK COWS AND MILK PRODUCTION, GEORGIA AND UNITED STATES--BY QUARTER, APRIL-JUNE 2004-2005
Georgia
United States
Item
Unit
2004
2005
Percent
2004
2005
Percent
Milk Cows1/
Thousand Head
84
82
98
9,001
9,035
100
Milk per Cow2/
Pounds
4,550
4,660
102
4,869
5,051
104
Milk Production Million Pounds
382
382
100
43,824
45,633
104
[Results from the Milk Production Report]. 1/ Includes dry cows, excludes heifers not yet fresh. 2/ Excludes milk sucked by calves.
STEPHENS FEDERAL BLDG., SUITE 320 355 EAST HANCOCK AVE. ATHENS, GA 30601 PHONE 706-546-2236
ADDRESS SERVICE REQUESTED
FARM REPORT (ISSN 744-7280) is published monthly by the GA Agricultural Statistics Service, 355 East Hancock Ave., Athens, GA 30601-5099. Periodicals postage paid at Athens, GA, and additional mailing offices. Postmaster: Send address changes to FARM REPORT, GA Agricultural Statistics Service, Stephens Federal Building, Suite 320, 355 East Hancock Ave., Athens, GA 30601-5099.
NEWS PAPER TIME VALUE