- Collection:
- Georgia Government Publications
- Serial:
- Georgia farm report.
- Title:
- Georgia farm report, vol. 05, no. 04 (2005 April 29)
- Creator:
- Georgia. Department of Agriculture
- Contributor to Resource:
- United States. Department of Agriculture
United States. National Agricultural Statistics Service
United States. National Agricultural Statistics Service. Georgia Office - Publisher:
- Athens, Ga. : United States Department of Agriculture, National Agricultural Statistics Service, in cooperation with the Georgia Department of Agriculture, Georgia Field Office
- Date of Original:
- 2005-04-29
- Subject:
- Agricultural productivity--Georgia--Statistics
Crop yields--Georgia--Statistics - Location:
- United States, Georgia, 32.75042, -83.50018
- Medium:
- state government records
- Type:
- Text
- Format:
- application/pdf
- Description:
- Began in 1975?; ceased with vol. 10, no. 02 (Feb. 26, 2010).
"Agricultural statistician and Georgia Department of Agriculture."
Numbering began again with Vol. 11, no. 1 (Jan. 14, 2000).
Vols. for Aug. 31, 2005- issued by: USDA-NASS Georgia Field Office.
Description based on: Vol. 94, no, 1 (Jan. 4, 1994); title from caption.
Latest issue consulted: Vol. 10, no. 02 (Feb. 26, 2010). - External Identifiers:
- Call Number GA A400.C7 P1 F2 2005/4
- Metadata URL:
- https://dlg.galileo.usg.edu/id:dlg_ggpd_i-ga-ba400-pc7-bp1-bf2-b2005-s4-belec-p-btext
- Digital Object URL:
- https://dlg.galileo.usg.edu/do:dlg_ggpd_i-ga-ba400-pc7-bp1-bf2-b2005-s4-belec-p-btext
- Language:
- eng
- Holding Institution:
- University of Georgia. Map and Government Information Library
- Rights:
-

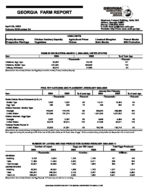
GEORGIA FARM REPORT
April 29, 2005 Volume 05-Number 04
Poultry Summary Prospective Plantings
Chicken Hatchery Capacity Vegetables
HIGHLIGHTS Agricultural Prices Onions
Stephens Federal Building, Suite 320 Athens, Georgia 30601 Phone: (706)546-2236 E-mail: nass-ga@nass.usda.gov W ebsite: http://www.nass.usda.gov/ga
Livestock Slaughter Grain Stocks
Peanut Stocks Milk Production
EGGS IN INCUBATORS--MARCH 1, 2004-2005, UNITED STATES
Item
2004
2005
--Thousands--
Chickens, Egg Type
34,263
34,706
Chickens, Broiler Type
647,596
658,866
Turkeys, All Breeds
29,613
27,880
[Results from the m onthly Chicken and Egg Report and the m onthly Turkey Hatchery Report].
% of Year Ago --Percent--
101 102
94
POULTRY HATCHING AND PLACEMENT--FEBRUARY 2004-2005
January thru February
Item
2004
2005
% of year ago
2004
2005
% of year ago
--Thousands--
--Percent--
--Thousands--
--Percent--
Pullet Chicks Placed Domestic (U.S.) 1/
Broiler Type
7,340
7,205
98
14,151
13,494
95
Egg Type
285
208
73
449
365
81
Chicks Hatched - Broiler Type
Georgia
113,447
111,770
99
233,341
235,489
101
United States
727,936
731,274
100
1,501,906
1,527,300
102
Chicks Hatched - Egg Type
Georgia
2,327
2,167
93
4,846
4,494
93
United States
32,078
32,910
103
67,428
69,671
103
Turkeys Poults Placed 2/
United States
22,905
21,321
93
136,733
129,719
95
[Results from the m onthly Chicken and Egg Report and the m onthly Turkey Hatchery Report]. 1/ Dom estic placem ents as reported by leading breeders includes expected pullet replacem ents from eggs sold during the preceding m onth at the rate of 125 pullet chicks per 30 dozen case of eggs. 2/ Accum ulated turkey poults placed are Septem ber 1 to current m onth.
NUMBER OF LAYERS AND EGG PRODUCTION DURING FEBRUARY 2004-2005 1/
Number of Layers
Eggs per 100 Layers
Total Eggs Produced
2004
2005
2004
2005
2004
2005
--Thousands--
--Number--
--Millions--
GEORGIA
Hatching
9,182
9,324
1,753
1,748
161
163
Table
11,385
11,634
2,090
2,011
238
234
Total Georgia
20,567
20,958
1,940
1,894
399
397
UNITED STATES
Hatching
59,300
59,550
1,698
1,703
1,007
1,014
Table
280,347
289,424
2,103
2,037
5,895
5,895
Total U.S.
339,647
348,974
2,032
1,980
6,901
6,908
[Results from the m onthly Chicken and Egg Report]. 1/ Totals m ay not add due to rounding.
USDA/NASS COOPERATING WITH THE GEORGIA DEPARTMENT OF AGRICULTURE
CHICKEN HATCHERIES: NUMBER AND INCUBATOR EGG CAPACITY BY REGION AND UNITED STATES, JANUARY 1, 2004 AND 2005 1/
Hatcheries
Incubator Egg Capacity
Geographic Region 2/
2004
2005
2004
2005
--Number--
--1,000--
North Atlantic
25
29
23,025
27,346
E North Central
26
23
22,320
23,234
W North Central
33
32
51,522
51,712
South Atlantic
90
89
293,982
293,098
South Central
117
117
429,207
437,570
West
25
24
44,607
44,330
US
316
314
864,663
877,290
1/ Hatchery capacity is defined as the num ber of eggs the m achines can hold in a controlled environm ent favorable for hatching. All setter, hatcher, and inactive capacities are included. 2/ R egional Listing: North A tlantic: C T , M E, M A, N H , N J, N Y, P A , R I, V T. East N orth C entral: IL, IN , MI, O H , W I. W est N orth C entral: IA , K S, MN , MO , N E, N D , S D. South A tlantic: DE , FL, GA , MD , NC , SC , VA , W V. South C entral: AL, AR , KY, LA, MS, OK , TN , TX. W est: AK, AZ, CA , CO , HI, ID , MT, NM , NV , OR , UT , W A, W Y.
COMMERCIAL POULTRY SLAUGHTER 1/--JANUARY AND FEBRUARY 2005
Item
Jan
Feb
% of Last Month
--Thousands--
--Percent--
Young Chickens
Georgia
100,811
96,135
95
United States
711,739
675,731
95
Mature Chickens
Light Type, U.S.
5,833
5,489
94
Heavy Type, U.S.
5,254
5,318
101
Total U.S.
11,087
10,807
97
Percent Condemned Young Chickens
--Percent--
Georgia
0.80
0.86
United States
1.10
1.12
1/ Federally inspected slaughter data as collected by Meat and Poultry Inspection Program .
January to Date --Thousands--
196,946 1,387,470
11,322 10,572 21,894
--Percent--
0.83 1.11
LIVESTOCK SLAUGHTER--UNITED STATES 1/--FEBRUARY 2004-2005
Number Slaughtered
Average Live Weight
Total Live Weight
Species
2004
2005
2005 as % of 2004
2004
2005
2004
2005
--Thousand Head--
--Percent--
--Pounds--
--Thousand Pounds--
Cattle
2,429.4
2,341.2
96
1,233
1,254
2,993,963
2,936,554
Calves
71.5
61.9
87
336
328
24,011
20,291
Hogs
7,887.4
8,103.8
103
268
270
2,112,505
2,187,417
Sheep & Lambs
212.35
215.0
101
139
140
29,601
30,125
[R esults from the U .S. Livestock Slaughter R elease]. 1/ Includes slaughter under Federal Inspection and other com m ercial slaughter, excludes farm slaughter.
Commodity
Price per Unit
PRICES RECEIVED BY FARMERS--MARCH 15, 2004
Georgia
Mar 2004
Feb 2005
Mar 15, 2005
Mar 2004
United States Feb 2005 Mar 15, 2005
Cotton
/Lb
61.00
40.50
42.00 1/
61.60
39.00
42.20 1/
Cottonseed
$/Ton
3/
3/
3/
3/
112.00
3/
Peanuts, In Shell /Lb
17.20
18.50
4/
18.60
18.60
18.60
Calves
/Lb
113.00
125.00
131.00
115.00
128.00
132.00
Beef Cattle 5/
/Lb
63.70
68.60
72.60
83.70
89.00
91.90
Cows 6/
/Lb
47.10
53.20
55.10
46.50
52.40
53.60
Steers & Heifers /Lb
88.60
95.90
98.90
88.00
93.30
96.30
[R esults from the m onthly Prices R eceived by Farm ers]. 1/ Based on sales during first half of the m onth. 2/ Marketing year August-February. 3/ Insufficient sales to establish a price. 4/ Prices not published to avoid disclosure of individual firm s. 5/ "Cows," "Steers and Heifers" com bined. 6/ Beef cows and cull dairy cows sold for slaughter.
2
INDEX NUMBERS--UNITED STATES
2004
Feb
Mar
UNITED STATES (1990-92=100)
Prices Received
116
121
Prices Paid Ratio1 /
131
132
89
92
[Results from the m onthly Prices Received by Farm ers]. 1/ Ratio of index of prices received by farm ers to index of prices paid.
Feb
114 135
84
2005
Mar
118 135
87
STOCKS OF PEANUTS AND SPECIFIED PRODUCTS AT MONTH'S END, UNITED STATES--2005 1/
Farmer Stock Equivalent
Month Ending
Farmer Stocks
Shelled Peanuts 2/ Roasting Stock (In Shell)
Shelled Peanuts
Total 3/
--Thousand Pounds--
Feb
1,900,894
669,530
57,936
890,475
2,849,305
[R esults from the P eanut Stocks and Processing R eport]. 1/ Excludes stocks on farm s. Includes stocks owned by or held for account of C C C in com m ercial storages. Farm er stock on net weight basis. 2/ Includes shelled edible grades, shelled oil stock, and shelled seed (untreated). 3/ Actual farm er stock, plus roasting stock, plus shelled peanuts x 1.33.
2004 GEORGIA AND UNITED STATES PROSPECTIVE PLANTINGS
Planted Acreage
Georgia
United States
Crop
2004
Intended 2005 1/ 2005 as % of 2004
2004
Intended 2005 1/ 2005 as % of 2004
--Thousands--
--Percent--
--Thousands--
--Percent--
Corn, All Cotton Hay, All 2/ Oats 3/ Peanuts Sorghum, All Soybeans Tobacco 2/ Wheat 3/
335 1,290
600 90
620 45
280 23.0 330
270
81
80,930
81,413
101
1,200
93
13,658.6
13,815.0
101
600
100
61,916
62,940
102
100
111
4,085
4,267
104
750
121
1,430
1,597
112
55
122
7,486
7,400
99
220
79
75,208
73,910
98
19.0
83
409.1
319.9
78
350
106
59,674
58,592
98
[R esults from the March 1 Agricultural Survey]. 1/ Intended plantings in 2005 as indicated by reports from farm ers. 2/ Area harvested 2004; intended for harvest 2005. 3/ Includes acreage planted preceding fall.
Crop and State
SNAP BEANS FL GA NJ
TOTAL
SELECTED FRESH MARKET VEGETABLES AND MELONS, AREA HARVESTED
BY CROP, STATE AND TOTAL, SPRING SEASON, 2004 AND PROSPECTIVE AREA, 2005
Usual Harvest Period
Area
Area for
Harvested Harvest
2004
2005
2005 as % of
2004
Crop and State
Usual Harvest Period
Area Harvested
2004
Area for Harvest
2005
--Acres--
--Percent--
--Acres--
CANTALOUP
Apr-Jun
11,400
11,500
101
AZ
Apr-Jun
12,500
13,500
Apr-Jun
9,500
8,900
94
CA
Apr-Jun
11,500
11,500
Jun-Aug
1,500
1,700
113
GA
Apr-Jun
4,600
3,700
TX
Apr-Jun
3,500
2,000
22,400
22,100
99
TOTAL
32,100
30,700
2005 as % of
2004 --Percent--
108 100
80 57 96
CABBAGE
WATERMELONS
FL
Apr-Jun
1,800
1,800
100
CA
Apr-Jun
3,500
3,300
94
GA
Apr-Jun
4,500
4,000
89
FL
Apr-Jul
25,000
26,000
104
NJ
May-Aug
1,000
1,000
100
TX
Apr-Jun
14,500
15,000
103
TX
Apr-Jun
900
900
100
TOTAL
8,200
7,700
94
TOTAL
43,000
44,300
103
[Results from the Fresh Market Vegetable Acreage Inquiry].
ONIONS--SPRING SEASON, BY STATE, 2004 AND FORECAST 2005 1/
State
Harvested 2004
For Harvest 2005
Yield for Acre
2004
2005
Production
2004
2005
--Acres--
--Cwt--
--1,000 Cwt--
GA Total
14,500
13,500
260
35,700
37,100
337
215
3,770
2/
12,031
2,903 2/
[R esults from the G eorgia Onions, Acreage and Yield Inquiry]. 1/ Prim arily fresh m arket. 2/ Published July 8, 2005.
3
GEORGIA GRAIN STOCKS--MARCH 1, 2004-2005
2004
2005
Grain
On Farms
Off Farms 1/
All Positions
On Farms
Off Farms 1/
All Positions
--1,000 Bushels--
Corn
*
6,287
*
*
5,356
*
Oats
*
85
*
*
78
*
Wheat
*
*
*
*
*
*
[R esults from the G rain Stocks Report]. 1/ Includes stocks at m ills, elevators, warehouses, term inals and processors. * Data not published to avoid disclosure of individual operations.
U.S. GRAIN STOCKS--MARCH 1, 2004-2005
2004
Grain
On Farms
Off Farms 1/
All Positions
On Farms
--1,000 Bushels--
Barley
51,700
101,186
152,886
79,680
Corn
3,030,000
2,241,459
5,271,459
4,137,000
Oats
45,600
49,414
95,014
43,500
Sorghum
21,000
137,652
158,652
33,400
Soybeans
355,900
549,947
905,847
795,000
Wheat
257,890
762,727
1,020,617
304,710
[R esults from the G rain Stocks Report]. 1/ Includes stocks at m ills, elevators, warehouses, term inals and processors.
2005 Off Farms 1/
111,001 2,616,738
39,026 169,989 585,974 676,304
All Positions
190,681 6,753,738
82,526 203,389 1,380,974 981,014
MILK COWS AND MILK PRODUCTION--JANUARY-MARCH 2004-2005
Georgia
United States 1/
Item
Unit
2004
2005
2005 as % of 2004
2004
2005
2005 as % of 2004
Milk Cows 2/
Thous Head
84
83
99
8,993
8,995
100
Milk per Cow 3/ Pounds
4,540
4,540
100
4,755
4,807
101
Milk Production Mil Lbs
381
377
99
42,759
43,238
101
[R esults from the Milk Production R eport]. 1/ May not add due to rounding. 2/ Includes dry cows, excludes heifers not yet fresh. 3/ Excludes m ilk sucked by calves.