- Collection:
- Georgia Government Publications
- Serial:
- Georgia farm report.
- Title:
- Georgia farm report, vol. 05, no. 03 (2005 March 31)
- Creator:
- Georgia. Department of Agriculture
- Contributor to Resource:
- United States. Department of Agriculture
United States. National Agricultural Statistics Service
United States. National Agricultural Statistics Service. Georgia Office - Publisher:
- Athens, Ga. : United States Department of Agriculture, National Agricultural Statistics Service, in cooperation with the Georgia Department of Agriculture, Georgia Field Office
- Date of Original:
- 2005-03-31
- Subject:
- Agricultural productivity--Georgia--Statistics
Crop yields--Georgia--Statistics - Location:
- United States, Georgia, 32.75042, -83.50018
- Medium:
- state government records
- Type:
- Text
- Format:
- application/pdf
- Description:
- Began in 1975?; ceased with vol. 10, no. 02 (Feb. 26, 2010).
"Agricultural statistician and Georgia Department of Agriculture."
Numbering began again with Vol. 11, no. 1 (Jan. 14, 2000).
Vols. for Aug. 31, 2005- issued by: USDA-NASS Georgia Field Office.
Description based on: Vol. 94, no, 1 (Jan. 4, 1994); title from caption.
Latest issue consulted: Vol. 10, no. 02 (Feb. 26, 2010). - External Identifiers:
- Call Number GA A400.C7 P1 F2 2005/3
- Metadata URL:
- https://dlg.galileo.usg.edu/id:dlg_ggpd_i-ga-ba400-pc7-bp1-bf2-b2005-s3-belec-p-btext
- Digital Object URL:
- https://dlg.galileo.usg.edu/do:dlg_ggpd_i-ga-ba400-pc7-bp1-bf2-b2005-s3-belec-p-btext
- Language:
- eng
- Holding Institution:
- University of Georgia. Map and Government Information Library
- Rights:
-

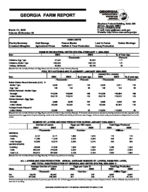
GEORGIA FARM REPORT
March 31, 2005 Volume 05-Number 03
Stephens Federal Building, Suite 320 Athens, Georgia 30601 Phone: (706)546-2236 E-mail: nass-ga@nass.usda.gov W ebsite: http://www.nass.usda.gov/ga
Poultry Summary Livestock Slaughter
Cold Storage Agricultural Prices
HIGHLIGHTS Peanut Stocks Catfish & Trout Production
Land in Farms
Cotton Ginnings
Honey Production
EGGS IN INCUBATORS, UNITED STATES--FEBRUARY 1, 2004-2005
Item
2004
2005
% of Year Ago
--Thousands--
--Percent--
Chickens, Egg Type
27,540
30,520
111
Chickens, Broiler Type
629,525
636,126
101
Turkeys, All Breeds
30,695
28,139
92
[Results from the m onthly Chicken and Egg Report and the m onthly Turkey Hatchery Report].
POULTRY HATCHING AND PLACEMENT--JANUARY 2004-2005 January thru January
Item
2004
2005
% of year ago
2004
2005
% of year ago
--Thousands--
--Percent--
--Thousands--
--Percent--
Pullet Chicks Placed Domestic (U.S.) 1/
Broiler Type
6,269
6,811
109
6,269
6,811
109
Egg Type
198
164
83
198
164
83
Chicks Hatched - Broiler Type
Georgia
111,320
119,894
108
111,320
119,894
108
United States
759,773
773,970
102
759,773
773,970
102
Chicks Hatched - Egg Type
Georgia
2,500
2,519
101
2,500
2,519
101
United States
33,499
35,350
106
33,499
35,350
106
Turkeys Poults Placed 2/
United States
25,389
23,273
92
119,834
113,828
95
[Results from the m onthly Chicken and Egg Report and the m onthly Turkey Hatchery Report]. 1/ Dom estic placem ents as reported by leading breeders includes expected pullet replacem ents from eggs sold during the preceding m onth at the rate of 125 pullet chicks per 30 dozen case of eggs. 2/ A ccum ulated turkey poults placed are Septem ber 1 to current m onth.
NUMBER OF LAYERS AND EGG PRODUCTION DURING JANUARY 2004-2005 1/
Number of Layers
Eggs per 100 Layers
Total Eggs Produced
2004
2005
2004
2005
2004
2005
--Thousands--
--Number--
--Millions--
GEORGIA
Hatching
9,107
9,171
1,889
1,875
172
172
Table
11,286
11,503
2,242
2,234
253
257
Total Georgia
20,393
20,674
2,084
2,075
425
429
UNITED STATES
Hatching
58,848
57,929
1,849
1,823
1,088
1,056
Table
282,062
279,963
2,234
2,259
6,301
6,324
Total U.S.
340,910
337,892
2,168
2,184
7,390
7,380
[Results from the m onthly Chicken and Egg Report]. 1/ Totals m ay add due to rounding.
ALL LAYERS AND EGG PRODUCTION: ANNUAL AVERAGE NUMBER OF LAYERS, EGGS PER LAYER, AND TOTAL EGG PRODUCTION BY GEORGIA AND UNITED STATES, 2004-2005 1/
State
Average Number of Layers
2004
5004
Eggs per Layer 2/
2004
2005
Total Egg Production
2004
2005
--Thousand--
--Number--
--Million Eggs--
GA US 3/
20,473
20,442
243
337,380
335,368
257
247
4,967
5,047
259
87,179
87,196
1/ Annual estim ates cover the period Dec 1, previous year thru Nov 30. 2/ Total egg production divided by average num ber of layers on hand. 3/ Sum of States m ay not add to U.S. total due to rounding.
USDA/NASS COOPERATING WITH THE GEORGIA DEPARTMENT OF AGRICULTURE
COMMERCIAL POULTRY SLAUGHTER 1/--DECEMBER 2004 AND JANUARY 2005
Item
Dec
Jan
% of Last Month
January to Date
--Thousands--
--Percent--
--Thousands--
Young Chickens
Georgia
103,141
104,155
101
104,155
United States
715,407
726,279
102
726,279
Mature Chickens
Light Type, U.S.
5,932
5,838
98
5,838
Heavy Type, U.S.
5,497
5,487
100
5,487
Total U.S.
11,429
11,325
99
11,325
Percent Condemned Young Chickens
--Percent--
--Percent--
Georgia
0.97
0.72
0.72
United States
0.93
0.93
0.93
1/ Federally inspected slaughter data as collected by Meat and Poultry Inspection Program .
LIVESTOCK SLAUGHTER--UNITED STATES 1/, JANUARY 2004-2005
Number Slaughtered
Average Live Weight
Species
2004
2005
2005 as % of 2004
2004
2005
--Thousand Head--
--Percent--
--Pounds--
Cattle
3,007.0
2,571.0
86
1,268
1,249
Calves
93.7
79.0
84
318
336
Hogs
8,785.5
8,785.7
100
268
269
Sheep & Lambs
238.8
219.2
92
133
141
1/ Includes slaughter under Federal Inspection and other com m ercial slaughter, excludes farm slaughter.
Total Live Weight
2004
2005
--Thousand Pounds--
3,814,305
3,210,574
29,764
26,541
2,352,762
2,362,374
31,856
30,833
Species
Cattle Calves Hogs Sheep
1/ Preliminary.
NUMBER OF HEAD SLAUGHTERED--BY SPECIES, COMMERCIAL AND FARM, UNITED STATES, 2004
Total Commercial
Farm 1/
Total Slaughter
--1,000 Head--
35,493.4
154.0
35,647.4
1,000.8
38.0
1,038.8
100,930.7
112.0
101,042.7
2,978.8
63.5
3,042.3
Commodity
Eggs, Frozen Meats, Red
Beef, Frozen Pork, Frozen Poultry, Frozen Peanuts, Shelled Peanuts, In Shell Pecans, Shelled Pecans, In Shell
SELECTED COLD STORAGE STOCKS--UNITED STATES, JANUARY 31, 2005
Jan 31, 2004
Dec 31, 2004
Jan 31, 2005
% of Jan 2004 % of Dec 2004
--Thousand Pounds--
--Percent--
15,340
18,036
21,386
139
119
1,015,168
878,958
961,199
95
109
482,419
395,084
435,610
90
110
512,657
470,656
510,724
100
109
1,179,573
966,703
943,870
80
98
284,978
221,475
267,545
94
121
12,504
17,074
13,365
107
78
37,681
17,992
22,370
59
124
99,229
141,037
187,266
189
133
Commodity
Price per Unit
PRICES RECEIVED BY FARMERS--FEBRUARY 15, 2005
Georgia
Feb 2004
Jan 2005 Feb 15, 2005 Feb 2004
United States Jan 2005 Feb 15, 2005
Cotton
/Lb
43.90
63.10
61.40 1/
46.50
62.50
61.60 1/
Cottonseed
$/Ton
3/
101.00
104.00
110.00
127.00
140.00
Peanuts, In Shell 2/ /Lb
3/
20.30
3/
19.60
20.70
21.30
Calves
/Lb
90.60
103.00
105.00
97.20
110.00
110.00
Beef Cattle 4/
/Lb
50.80
59.50
59.70
73.90
80.90
77.80
Cows 5/
/Lb
38.80
48.30
47.20
38.90
46.10
46.20
Steers & Heifers /Lb
72.10
82.20
81.80
78.20
85.40
81.60
[R esults from the m onthly Prices Received by Farm ers]. 1/ Based on sales during the first half of the m onth. 2/ Includes additional loan peanuts at loan value. 3/ Insufficient sales to establish a price. 4/ "Cows" and "Steers and Heifers" com bined. 5/ Beef cows and cull dairy cows sold for slaughter.
2
INDEX NUMBERS, UNITED STATES
2004
Jan
Feb
UNITED STATES (1990-92= 100)
Prices Received
100
99
Prices Paid
126
128
Ratio 1/
79
77
[Results from the m onthly Prices Received by Farm ers]. 1/ Ratio of index of prices received by farm ers to index of prices paid.
Jan
111 130
85
2005
Feb
113 130
87
STOCKS OF PEANUTS AND SPECIFIED PRODUCTS AT MONTH'S END, UNITED STATES--2005 1/
Farmer Stock Equivalent
Month Ending Farmer Stocks Shelled Peanuts 2/ Roasting Stock (In Shell) Shelled Peanuts
Total 3/
--Thousand Pounds--
Jan
1,514,778
486,762
45,372
647,393
2,207,543
[R esults from the P eanut Stocks and P rocessing R eport]. 1/ E xcludes stocks on farm s. Includes stocks owned by or held for account of C C C in com m ercial storages. Farm er stock on net weight basis. 2/ Includes shelled edible grades, shelled oil stock, and shelled seed (untreated). 3/ Actual farm er stock, plus roasting stock, plus shelled peanuts x 1.33.
TROUT--SALES OF FISH 12" OR LONGER, GEORGIA AND UNITED STATES
Number Sold
Pounds Sold
Average Value per Pound
Value of Sales
2003 1/
2004
2003 1/
2004
2003 1/
2004
2003 1/
2004
--Thousand--
--Dollars--
--Thousand Dollars--
GA
160
105
215
125
2.46
2.90
529
363
US
50,191
45,941
54,401
50,716
1.08
1.09
58,492
55,361
[Results from the Trout Survey]. 1/ Revised.
CATFISH--NUMBER OF OPERATIONS, WATER SURFACE, AND TOTAL SALES, GEORGIA AND UNITED STATES
Number of Operations
Water Surface Acres
Total Sales
State
Jan 1, 2004 1/
Jan 1, 2005
Jan 1, 2004 1/
Jan 1, 2005
2003 1/
2004
--Number--
--Acres--
--Thousand Dollars--
GA
43
30
960
750
1,411
1,372
US
1,161
1,117
187,200
177,790
411,413
424,925
[Results from the Catfish Grower Survey]. 1/ Revised.
NUMBER OF FARMS AND LAND IN FARMS, GEORGIA AND UNITED STATES 2001-2004
Number of Farms
Land in Farms
State
2002
2003
2004
2002
2003
--Number--
--Thousand Acres--
GA
49,200
49,300
49,300
10,850
10,800
US
2,148,630
2,135,360
2,126,860
942,070
940,300
[Results from the June Agricultural Survey].
2004
10,800 938,750
NUMBER OF FARMS: ECONOMIC SALES CLASS BY GEORGIA AND UNITED STATES, 2004
Economic Sales Class
$1,000 - $9,999 $10,000 - $99,999 $100,000 - $249,999 $250,000 - $499,999 $500,000 & Over
--Number--
GA
32,200
10,800
2,000
1,800
2,500
US
1,199,270
600,530
167,230
86,550
73,280
[Results from the June Agricultural Survey].
Total
49,300 2,126,860
LAND IN FARMS: ECONOMIC SALES CLASS BY GEORGIA AND UNITED STATES, 2004
Economic Sales Class
$1,000 - $9,999 $10,000 - $99,999 $100,000 - $249,999 $250,000 - $499,999 $500,000 & Over
--1,000 Acres--
GA
3,700
2,800
1,100
1,100
2,100
US
124,780
270,055
196,145
150,135
197,635
[Results from the June Agricultural Survey].
3
Total
10,800 938,750
COLONIES OF BEES: PRODUCTION, PRICE AND VALUE, GEORGIA AND UNITED STATES, 2003-2004 1/
Georgia
United States
Item
Unit
2003
2004
2003
2004
Honey Producing Colonies
1,000 Colonies
50
52
2,574
2,590
Yield per Colony
Pounds
52.0
65.0
66.7
69.9
Honey Production
1,000 Pounds
2,600
3,380
171,718
181,096
Stocks Dec. 15
1,000 Pounds 2/
52
270
39,393
40,735
Avg. Price per Pound
Dollars 3/
1.130
1.280
1.327
1.404
Value of Honey Production 1,000 Dollars
2,938
4,326
228,338
255,791
[R esults from the Bee and H oney Inquiry]. 1/ For producers with 5 or m ore colonies. 2/ Stocks held by producers. 3/ U.S. price weighted by survey expanded sales.
COTTON GINNINGS: RUNNING BALES GINNED PRIOR TO FEBRUARY 1, BY CROP, SELECTED STATES, AND UNITED STATES, CROP YEARS 2001-2004 1/
Crop and State
2001
2002
2003
All Cotton
AL
531,500
901,450
565,200
GA
1,620,000
2,152,850
1,544,250
SC
357,300
403,550
125,500
US
16,627,250
19,532,450
16,576,250
[Results from the Cotton Ginnings Report]. 1/ Excluding Linters.
2004
798,250 2,052,950
309,900 17,620,400