- Collection:
- Georgia Government Publications
- Serial:
- Georgia farm report.
- Title:
- Georgia farm report, vol. 05, no. 02 (2005 February 28)
- Creator:
- Georgia. Department of Agriculture
- Contributor to Resource:
- United States. Department of Agriculture
United States. National Agricultural Statistics Service
United States. National Agricultural Statistics Service. Georgia Office - Publisher:
- Athens, Ga. : United States Department of Agriculture, National Agricultural Statistics Service, in cooperation with the Georgia Department of Agriculture, Georgia Field Office
- Date of Original:
- 2005-02-28
- Subject:
- Agricultural productivity--Georgia--Statistics
Crop yields--Georgia--Statistics - Location:
- United States, Georgia, 32.75042, -83.50018
- Medium:
- state government records
- Type:
- Text
- Format:
- application/pdf
- Description:
- Began in 1975?; ceased with vol. 10, no. 02 (Feb. 26, 2010).
"Agricultural statistician and Georgia Department of Agriculture."
Numbering began again with Vol. 11, no. 1 (Jan. 14, 2000).
Vols. for Aug. 31, 2005- issued by: USDA-NASS Georgia Field Office.
Description based on: Vol. 94, no, 1 (Jan. 4, 1994); title from caption.
Latest issue consulted: Vol. 10, no. 02 (Feb. 26, 2010). - External Identifiers:
- Call Number GA A400.C7 P1 F2 2005/2
- Metadata URL:
- https://dlg.galileo.usg.edu/id:dlg_ggpd_i-ga-ba400-pc7-bp1-bf2-b2005-s2-belec-p-btext
- Digital Object URL:
- https://dlg.galileo.usg.edu/do:dlg_ggpd_i-ga-ba400-pc7-bp1-bf2-b2005-s2-belec-p-btext
- Language:
- eng
- Holding Institution:
- University of Georgia. Map and Government Information Library
- Rights:
-

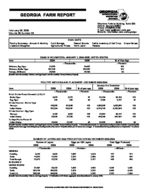
GEORGIA FARM REPORT
February 28, 2005 Volume 05-Number 02
Stephens Federal Building, Suite 320 Athens, Georgia 30601 Phone: (706)546-2236 E-mail: nass-ga@nass.usda.gov Website: http://www.nass.usda.gov/ga
Poultry Summary - Annual & Monthly Livestock Slaughter
HIGHLIGHTS
Cold Storage
Peanut Stocks
Agricultural Prices Farm Labor
Cattle Inventory & Calf Crop Crops Values Pecans
EGGS IN INCUBATORS--JANUARY 1, 2004-2005, UNITED STATES
Item
2004
2005
--Thousands--
Chickens, Egg Type
31,655
34,437
Chickens, Broiler Type
637,048
650,680
Turkeys, All Breeds
28,394
28,199
[Results from the monthly Chicken and Egg Report and the monthly Turkey Hatchery Report].
% of Year Ago --Percent--
109 102
99
POULTRY HATCHING AND PLACEMENT--DECEMBER 2003-2004
January thru December
Item
2003
2004
% of year ago
2003
2004
% of year ago
--Thousands--
--Percent--
--Thousands--
--Percent--
Pullet Chicks Placed Domestic (U.S.) 1/
Broiler Type
6,978
6,075
87
82,134
83,129
101
Egg Type
246
235
96
3,198
3,117
97
Chicks Hatched - Broiler Type
Georgia
119,326
121,845
102
1,368,328
1,423,686
104
United States
780,094
793,047
102
9,079,745
9,330,954
103
Chicks Hatched - Egg Type
Georgia
2,123
2,302
108
27,831
28,117
101
United States
33,645
37,035
110
416,069
437,497
105
Turkeys Poults Placed 2/
United States
23,424
22,197
95
90,555
86,503
96
[Results from the monthly Chicken and Egg Report and the monthly Turkey Hatchery Report]. 1/ Domestic placements as reported by leading breeders includes expected pullet replacements from eggs sold during the preceding month at the rate of 125 pullet chicks per 30 dozen case of eggs. 2/ Accumulated turkey poults placed are September 1 to current month.
NUMBER OF LAYERS AND EGG PRODUCTION DURING DECEMBER 2003-2004
Number of Layers
Eggs per 100 Layers
Total Eggs Produced
2003
2004
2003
2004
2003
2004
--Thousands--
--Number--
--Millions--
GEORGIA
Hatching
9,041
8,932
1,880
1,914
170
171
Table
11,631
11,091
2,261
2,389
263
265
Total Georgia
20,672
20,023
2,095
2,177
433
436
30 STATES 1/
UNITED STATES
Hatching
57,497
58,203
1,835
1,856
1,055
1,080
Table
280,746
286,330
2,303
2,312
6,466
6,619
Total U.S.
338,243
344,533
2,223
2,235
7,520
7,699
[Results from the monthly Chicken and Egg Report]. 1/ Publication of 30 States aggregate data discontinued in January 2005.
USDA/NASS COOPERATING WITH THE GEORGIA DEPARTMENT OF AGRICULTURE
COMMERCIAL POULTRY SLAUGHTER 1/--NOVEMBER AND DECEMBER 2004
Item
Nov
Dec
% of Last Month
January thru December
--Thousands--
--Percent--
--Thousands--
Young Chickens Georgia United States
Mature Chickens Light Type, U.S. Heavy Type, U.S. Total U.S.
Percent Condemned Young Chickens Georgia United States
101,471 708,218
5,705 5,738 11,443
--Percent--
0.76 1.03
106,096 722,753
6,140 6,119 12,259
0.93 1.12
105
1,252,378
102
8,762,095
108
72,438
107
71,335
107
143,773
--Percent--
0.91
1.08
1/ Federally inspected slaughter data as collected by Meat and Poultry Inspection Program.
LIVESTOCK SLAUGHTER--UNITED STATES, 1/ DECEMBER 2003-2004
Number Slaughtered
Average Live Weight
Total Live Weight
Species
2003
2004
2004 as % of 2003
2003
2004
2003
2004
--Thousand Head--
--Percent--
--Pounds--
--Thousand Pounds--
Cattle
2,675.3
2,690.5
101
Calves
97.4
74.7
77
Hogs
9,361.0
9,250.1
99
Sheep & Lambs
261.9
242.4
93
1,244 322 269 137
1,268 334 270 140
3,329,388 31,413
2,518,208 35,952
3,410,781 24,932
2,496,511 33,846
[Results from the U.S. Livestock Slaughter Release]. 1/ Includes slaughter under Federal Inspection and other commercial slaughter, excludes farm slaughter.
COLD STORAGE STOCKS--UNITED STATES, DECEMBER 31, 2004
Commodity
Dec 31, 2003
Nov 30, 2004
Dec 31, 2004
% of Dec 2003
% of Nov 2004
--Thousand Pounds--
--Percent--
Eggs, Frozen, Total
18,036
17,324
19,583
109
113
Meats, Red
878,958
912,602
974,878
111
107
Beef, Frozen, Total
395,084
463,297
479,584
121
104
Pork, Frozen, Total
470,656
436,332
483,643
103
111
Poultry, Frozen
966,703
1,064,635
1,018,686
105
96
Peanuts, Shelled
221,475
249,983
307,579
139
123
Peanuts, In Shell
17,074
15,136
15,699
92
104
Pecans, Shelled
17,992
18,515
18,531
103
100
Pecans, In Shell
141,037
48,476
93,657
66
193
[Results from the monthly Cold Storage Report].
Commodity
Price per Unit
PRICES RECEIVED BY FARMERS--JANUARY 15, 2005
Jan 2004
Georgia Dec 2004
Jan 15, 2005
Jan 2004
United States Dec 2004 Jan 15, 2005
Cotton
/Lb
62.70
42.60
42.60 1/
62.20
40.70
39.40 1/
Cottonseed
$/Ton
101.00
84.00
91.00
126.00
111.00
112.00
Peanuts, In Shell 2/ /Lb
20.30
18.00
18.20
20.60
18.30
18.60
Calves
/Lb
103.00
118.00
119.00
110.00
122.00
123.00
Beef Cattle 4/
/Lb
59.50
64.90
64.00
80.90
86.80
89.10
Cows 5/
/Lb
48.30
50.40
50.20
46.10
48.70
50.00
Steers & Heifers /Lb
82.20
93.00
92.00
85.40
91.80
94.20
[Results from the monthly Prices Received by Farmers]. 1/ Based on sales during first half of the month. 2/ Includes additional loan peanuts at loan value. 3/ Insufficient sales to establish a price. 4/ "Cows," "Steers and Heifers" combined. 5/ Beef cows and cull dairy cows sold for slaughter.
INDEX NUMBERS--UNITED STATES
2003 Dec
2004
Jan
Dec
UNITED STATES (1990-92 = 100)
Prices Received
114
112
111
Prices Paid
129
130
133
Ratio 1/
88
86
83
[Results from the monthly Prices Received by Farmers]. 1/ Ratio of index of prices received by farmers to index of prices paid.
2005 Jan
110 134
82
2
STOCKS OF PEANUTS AND SPECIFIED PRODUCTS AT MONTH'S END, CROP--2004 1/
Farmer Stock Equivalent
Month Ending Farmer Stock
Shelled Peanuts 2/ Roasting Stock (In Shell)
Shelled Peanuts
Total 3/
--Thousand Pounds--
Dec
1,737,366
482,572
40,216
641,821
2,419,403
[Results from the Peanut Stocks and Processing Report]. 1/ Excludes stocks on farms. Includes stocks owned by or held for account of CCC in commercial storage facilities. Farmer stock on net weight basis. 2/ Includes shelled edible grades, shelled oil stock, and shelled seed (untreated). 3/ Actual farmer stock, plus roasting stock, plus shelled peanuts X 1.33.
FARM WAGE RATES--JANUARY 11-17, 2004, AND JANUARY 9-15, 2005, BY REGION AND UNITED STATES 1/
Type of Hired Worker
Wage Rates for All Hired Workers
Field
Livestock
Field and Livestock
Region
2004
2005
2004
2005
2004
2005
2004
2005
--Dollars per Hour--
Southeast 2/
8.10
8.41
7.67
7.96
7.61
7.25
7.65
7.71
US 3/
9.41
9.81
8.39
8.73
8.83
9.19
8.55
8.91
See footnotes below.
NUMBER OF HIRED WORKERS ON FARMS AND HOURS WORKED FOR THE WEEK JANUARY 11-17, 2004, AND JANUARY 9-15, 2005, BY REGION AND UNITED STATES 1/
Region
Hired Workers
Number
2004
2005
Hours Worked
2004
2005
Expected to be Employed
150 Days or More
2004
2005
149 Days or Less
2004
2005
--1,000--
--Hours per Week--
--1,000--
Southeast 2/ US 3/
27
24
35.5
35.3
21
20
6
4
662
574
38.1
36.8
549
478
113
96
[Results from the Agricultural Labor Survey]. 1/ Excludes agricultural service workers. 2/ Southeast: AL, GA, SC. 3/ Excludes AK.
ALL PECANS: UTILIZED PRODUCTION, PRICE PER POUND, VALUE OF PRODUCTION, GEORGIA AND UNITED STATES, 2002-2004
Utilized Production
Price per Pound
Value of Production
State
2002
2003
2004
2002
2003
2004
2002
2003
2004
--1,000 Pounds--
--Dollars--
--1,000 Dollars--
GA
45,000
75,000
45,000
1.000
0.928
1.700
44,880
69,600
76,350
US
172,900
282,100
181,000
0.955
0.984
1.670
165,033
277,629
301,421
[Results from the January 1 Pecan Inquiry].
CATTLE AND CALVES: NUMBER BY CLASS AND CALF CROP, GEORGIA AND UNITED STATES, JANUARY 1, 2004-2005 1/
Georgia
United States
Class
2004
2005 2005 as % of 2004
2004
2005 2005 as % of 2004
--1,000 Head--
--Percent--
--1,000 Head--
--Percent--
Cattle and Calves
1,250
1,210
97
94,888
95,848
101
Cows and Heifers That Have Calved
700
680
97
41,851
42,060
101
Beef Cows
616
596
97
32,861
33,055
101
Milk Cows
84
84
100
8,990
9,005
100
Heifers 500 Pounds and Over
141
141
100
19,345
19,673
102
For Beef Cow Replacement
85
82
96
5,518
5,746
104
Expected to Calve
2/
2/
2/
3,493
3,586
103
For Milk Cow Replacement
26
24
92
4,020
4,133
103
Expected to Calve
2/
2/
2/
2,761
2,830
103
Other Heifers
30
35
117
9,806
9,793
100
Steers 500 Pounds and Over
40
49
123
16,277
16,511
101
Bulls 500 Pounds and Over
39
35
90
2,206
2,219
101
Calves Under 500 Pounds
330
305
92
15,210
15,385
101
Cattle on Feed
3/
3/
3/
13,813
13,749
100
2003
2004 2004 as % of 2003
2003
2004 2004 as % of 2003
Calf Crop
580
560
97
37,903
37,625
99
[Results from the Cattle Report]. 1/ Totals may not add due to rounding. 2/ Data not available. 3/ GA included in Other States beginning in 2004, which impacts 2004 as a percent of 2003.
3
State
Angora
GA
1,000
US
274,000
1/ Estimates began in 2005.
Angora Goats, Milk Goats, Meat and Other Goats and Total: Number by Class, State and United States, January 1, 2005 1/
Milk
Meat and Other Goats
--Head--
2,000
77,000
283,500
1,965,000
All Goats
80,000 2,522,500
GEORGIA ANNUAL CROP SUMMARY, 2004
Crop
Planted Acres Harvested Acres Yield per Acre Unit Production
Unit Price Value of Production
--1,000 Acres--
--1,000--
--Dollars--
--$1,000--
Corn, grain
335
280
130
Bu
36,400
2.20
80,080
Corn, silage
45
16
Ton
720
Cotton, lint 1/
1,290
1,280
675
Lb
1,800
0.470
406,080
Cottonseed
Ton
621
84.50
52,475
Hay 2/
600
600
2.7
Ton
1,620
55.00
89,100
Oats
90
25
50
Bu
1,250
1.70
2,125
Peanuts
620
610
3,000
Lb
1,830,000
0.190
347,700
Rye
250
25
24
Bu
600
4.00
2,400
Sorghum, Grain
45
25
47
Bu
1,175
2.02
2,369
Sorghum, Silage
15
10
Ton
150
Soybeans
280
270
31
Bu
8,370
5.30
44,361
Tobacco 2/
23.0
2,030
Lb
46,690
1.835
85,676
Wheat
330
190
45
Bu
8,550
3.45
29,498
Apples 3/ 4/
1.2
10,000
Lb
12,000
0.228
2,740
Blueberries 5/
4.8
4,380
Lb
21,000
1.130
23,770
Grapes 3/ 4/
1.1
3.00
Ton
3.3
1,160.00
3,724
Peaches 3/ 4/
12.0
4.38
Ton
52,500
667.00
33,017
Pecans
Lb
45,000
1.700
76,350
Cabbage
12.0
10.0
250
Cwt
2,500
11.00
27,500
Cantaloupes
7.2
6.6
150
Cwt
990
19.00
18,810
Cucumbers
15.0
14.0
140
Cwt
1,960
16.60
32,536
Onions
16.5
14.5
260
Cwt
3,770
23.50
88,595
Snap Beans
20.0
17.0
53
Cwt
901
28.00
25,228
Sweet Corn
28.0
27.0
135
Cwt
3,645
12.80
46,656
Tomatoes
6.0
5.8
170
Cwt
986
45.00
44,370
Watermelons
30.0
23.0
165
Cwt
3,395
7.00
26,565
Bell Pepper 6/
4.0
3.9
170
Cwt
663
30.00
19,890
Squash 6/
12.0
10.0
115
Cwt
1,150
29.00
33,350
Total
3,990.7
3,538.9
1,644,965
1/ Cotton yield pounds per acre; production 480 lb. bales. 2/ Harvested acres substituted for planted acres. 3/ Bearing age acreage and utilized production. 4/ Yield based on total production. 5/ Yield based on utilized production. 6/ Estimates began in 2000.