- Collection:
- Georgia Government Publications
- Serial:
- Georgia farm report.
- Title:
- Georgia farm report, vol. 05, no. 11 (2005 November 30)
- Creator:
- Georgia. Department of Agriculture
- Contributor to Resource:
- United States. Department of Agriculture
United States. National Agricultural Statistics Service
United States. National Agricultural Statistics Service. Georgia Office - Publisher:
- Athens, Ga. : United States Department of Agriculture, National Agricultural Statistics Service, in cooperation with the Georgia Department of Agriculture, Georgia Field Office
- Date of Original:
- 2005-11-30
- Subject:
- Agricultural productivity--Georgia--Statistics
Crop yields--Georgia--Statistics - Location:
- United States, Georgia, 32.75042, -83.50018
- Medium:
- state government records
- Type:
- Text
- Format:
- application/pdf
- Description:
- Began in 1975?; ceased with vol. 10, no. 02 (Feb. 26, 2010).
"Agricultural statistician and Georgia Department of Agriculture."
Numbering began again with Vol. 11, no. 1 (Jan. 14, 2000).
Vols. for Aug. 31, 2005- issued by: USDA-NASS Georgia Field Office.
Description based on: Vol. 94, no, 1 (Jan. 4, 1994); title from caption.
Latest issue consulted: Vol. 10, no. 02 (Feb. 26, 2010). - External Identifiers:
- Call Number GA A400.C7 P1 F2 2005/11
- Metadata URL:
- https://dlg.galileo.usg.edu/id:dlg_ggpd_i-ga-ba400-pc7-bp1-bf2-b2005-s11-belec-p-btext
- Digital Object URL:
- https://dlg.galileo.usg.edu/do:dlg_ggpd_i-ga-ba400-pc7-bp1-bf2-b2005-s11-belec-p-btext
- Language:
- eng
- Holding Institution:
- University of Georgia. Map and Government Information Library
- Rights:
-

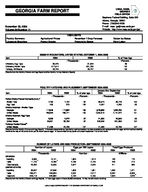
GEORGIA FARM REPORT
November 30, 2005 Volume 05-Number 11
USDA, NASS, GEORGIA
FIELD OFFICE
Stephens Federal Building, Suite 320 Athens, Georgia 30601 Phone: (706)546-2236 E-mail: nass -ga@nass.usda.gov Website: http://www.nass.usda.gov/ga/
Poultry Summary Livestock Slaughter
Agricultural Prices Peanut Stocks
HIGHLIGHTS November 1 Crop Forecast Peanuts by States
Cotton by States Farm Labor
EGGS IN INCUBATORS, UNITED STATES--OCTOBER 1, 2004-2005
Item
2004
2005
--Thousands--
Chickens, Egg Type
33,475
31,844
Chickens, Broiler Type
617,612
631,739
Turkeys, All Breeds
26,744
26,747
[Results from the Monthly Chicken and Egg Report and the Monthly Turkey Hatchery Report].
% of Year Ago --Percent--
95 102 100
POULTRY HATCHING AND PLACEMENT--SEPTEMBER 2004-2005
January thru September
Item
2004
2005
% of year ago
2004
2005
% of year ago
--Thousands--
--Percent--
--Thousands--
--Percent--
Pullet Chicks Placed Domestic (U.S.)1/
Broiler Type
7,758
7,132
92
63,574
63,776
100
Egg Type
205
375
183
2,267
2,239
99
Chicks Hatched - Broiler Type
Georgia
117,943
117,952
100
1,075,599
1,082,790
101
United States
769,934
769,771
100
7,052,913
7,141,372
101
Chicks Hatched- Egg Type
Georgia
2,339
2,272
97
21,383
20,568
96
United States
36,631
33,788
92
326,348
331,996
102
Turkeys Poults Placed2/
United States
21,268
22,735
107
21,268
22,735
107
[Results from the Monthly Chicken and Egg Report]. 1/ Domestic placements as reported by leading breeders includes expected pullet replacements from eggs sold during the preceding month at the rate of 125 pullet chicks per 30 dozen case of eggs. 2/ Accumulated turkey poults are placed September 1 to current month.
NUMBER OF LAYERS AND EGG PRODUCTION--SEPTEMBER 2004-2005
Number of Layers
Eggs per 100 Layers
Total Eggs Produced
2004
2005
2004
2005
2004
2005
--Thousands--
--Number--
--Millions--
GEORGIA
Hatching Table
9,060
9,141
1,854
1,914
168
175
1/
1/
11,120
9,768
2,166
2,128
243
210
Total Georgia
20,280
19,009
2,027
2,025
411
385
UNITED STATES
Hatching
58,847
57,848
1,806
1,851
1,063
1,071
Table Total U.S.
285,271 344,118
284,534 342,382
2,202 2,134
2,217 2,155
6,282 7,344
6,309
2/
7,379
[Results from the Monthly Chicken and Egg Report]. 1/ Table eggs layers in flocks 30,000 and above. 2/ May not add due to rounding.
USDA, NASS COOPERATING WITH THE GEORGIA DEPARTMENT OF AGRICULTURE
COMMERCIAL POULTRY SLAUGHTER1/--AUGUST AND SEPTEMBER 2005
Item
Aug
Sep
% of Last Month
--Thousands--
--Percent--
Young Chickens
Georgia
112,976
107,591
95
United States
793,031
750,054
95
Mature Chickens
Light Type, U.S.
6,153
5,410
88
Heavy Type, U.S.
6,919
6,113
88
Total U.S.
13,072
11,523
88
Percent Condemned Young Chickens
--Percent--
Georgia
0.65
0.62
United States
0.90
0.91
1/ Federally inspected slaughter data as collected by Meat and Poultry Inspection Program.
January to Date --Thousands--
947,926 6,666,101
56,873 54,779 111,652
--Percent--
0.81 1.00
LIVESTOCK SLAUGHTER--UNITED STATES,1/ SEPTEMBER 2004, 2005
Number Slaughtered
Average Live Weight
Total Live Weight
Species
2004
2005
2005 as % of 2004
2004
2005
2004
2005
--Thousand Head--
--Percent--
--Pounds--
--Thousand Pounds--
Cattle
2,737.1
2,777.6
101
1,265
1,276
3,463,716
3,543,498
Calves
67.3
60.7
90
320
363
21,546
22,035
Hogs
8,999.2
8,869.9
99
265
265
2,387,426
2,349,204
Sheep & Lambs
243.9
231.3
95
133
135
32,370
31,136
[Results form the U.S. Livestock Slaughter Release]. 1/ Includes slaughter under Federal Inspection and other commercial slaughter, excludes farm slaughter.
PRICES RECEIVED BY FARMERS--OCTOBER 15, 2005
Georgia
United States
Commodity
Price per Unit Oct 2004
Sep 2005
Oct 15, 2005
Oct 2004
Sep 2005
Oct 15, 2005
Cotton Cottonseed3/
/Lb $/Ton
52.60 88.00
2/
1/
52.90
50.60
44.30
4/
75.00
107.00
96.00
2/
46.90 89.40
Peanuts, In Shell /Lb
19.10
17.30
17.30
20.10
17.40
17.60
Calves Beef Cattle6/ Cows7/
/Lb /Lb /Lb
120.00 65.70 50.90
123.00 66.50 49.80
123.00 63.20 45.70
126.00 86.50 49.80
133.00 88.20 49.80
132.00 90.80 47.70
Steers & Heifers /Lb
94.30
98.80
97.20
91.10
92.30
96.00
[Results from the monthly Prices Received by Farmers]. 1/ Price not published to avoid disclosure of individual firms. 2/Based on sales during first half of the month. 3/ Marketing year August-February. 4/ Insufficient sales to establish a price. 5/ I"Cows," "Steers and Heifers" combined. 6/ Beef cows and cull dairy cows sold for slaughter.
INDEX NUMBERS--UNITED STATES
Index
2004
2005
1990-92=100
Sep
Oct
Sep
Oct
Prices Received
116
114
117
110
Prices Paid Ratio1/
135
136
142
143
86
84
82
77
[Results from the monthly Prices Received by Farmers]. 1/ Ratio of index of prices received by farmers to index of prices paid.
STOCKS OF PEANUTS AND SPECIFIED PRODUCTS AT MONTH'S END, UNITED STATES--20051/
Farmer Stock Equivalent
Month Ending
Farmer Stocks
Shelled Peanuts2/ Roasting Stock (In Shell)
Shelled Peanuts
Total3/
--Thousand Pounds--
Sep
1,460,614
400,744
47,426
532,990
2,041,030
[Results from the Peanut Stocks and Processing Report]. 1/ Excludes stocks on farms. Includes stocks owned by or held for account of CCC in commercial storages. Farmer stock on net weight basis. 2/ Includes shelled edible grades, shelled oil stock, and shelled seed (untreated). 3/ Actual farmer stock, plus roasting stock, plus shelled peanuts x 1.33.
2
GEORGIA ACREAGE, YIELD AND PRODUCTION, 2004 AND NOVEMBER 1, 2005 FORECAST
Area Harvested
Yield per Acre
Production
Crop
Unit
2004
Ind Nov 1, 2005
2004
Ind Nov 1, 2005
2004
Ind Nov 1, 2005
--Thousand Acres--
--Thousands--
Corn for Grain
Bu
280
230
130
127
36,400
29,210
Hay, All Other
Ton
600
650
2.7
2.8
1,620
1,820
Wheat, Winter
Bu
190
160
45
52
8,550
8,320
Peanuts
Lb
610
750
2,980
2,800
1,817,800
2,100,000
Soybeans for Beans Bu
Cotton, Upland1/
Bale
270 1,280
170
31
1,210
674
28
8,370
4,760
793
1,797
2,000
Tobacco, Type 14 Apples2/ Grapes2/ Peaches2/
Lbs Lbs Tons Tons
23.0 3/ 3/ 3/
16.0
2,030
3/
3/
3/
3/
3/
3/
1,700 3/ 3/ 3/
46,690 12,000
3.3 52.5
27,200 13,000
3.3 40.0
Pecans
Lbs
4/
4/
4/
4/
45,000
90,000
1/ Cotton yield in pounds per harvested acre, production in 480 lb. net weight bales. 2/ Bearing age acres. 3/ Acreage and yield estimates will be released in the Noncitrus Fruits and Nuts Summary, January 2006. 4/ Not available.
PEANUT PRODUCTION--NOVEMBER 1, 2005 FORECAST BY STATES AND UNITED STATES
Area Harvested
Yield
Production1/
State
Ind 2005
Ind 2005
Ind 2005
2005 as % of 2004
--1,000 Acres--
--Pounds--
--1,000 Lbs.--
--Percent--
AL
223.0
2,500
557,500
100
FL
145.0
2,600
377,000
104
GA
750.0
2,800
2,100,000
116
SC
59.0
2,800
165,200
147
US
1,607.0
2,898
4,657,700
109
1/ Estimates comprised of quota and non-quota peanuts.
ALL COTTON--NOVEMBER 1, 2005 FORECAST BY STATES AND UNITED STATES
State
Acres for Harvest
Yield
Production1/
--1,000 Acres--
--Pounds--
--1,000 Bales2/--
AL
545.0
766
870.0
GA
1,210.0
793
2,000.0
SC
263.0
785
430.0
TN
635.0
862
1,140.0
US
13,673.0
813
23,161.0
1/ Production ginned and to be ginned. 2/ 480 lb. net weight bales.
2005 as % of 2004 --Percent--
107 111 110 116 100
HIRED WORKERS: ANNUAL AVERAGE WAGE RATES IN GEORGIA AND UNITED STATES--2004 AND 2005
2004
2005
All Hired
Field
Field and Livestock
All Hired
Field
Field and Livestock
--Dollars per Hour--
GA US1/
9.10 9.23
8.52
8.51
8.45
8.56
8.99
8.34
8.50
9.50
8.69
8.83
[Results from the Agricultural Labor Survey]. 1/ Excludes AK.
3
HIRED WORKERS: WAGE RATES FOR TYPE OF WORKER AND ALL HIRED WORKERS BY REGION AND UNITED STATES1/ OCTOBER 10-16, 2004, AND OCTOBER 9-15, 2005
Type of Hired Worker
Field
Livestock
Field and Livestock
Wage Rates for All Hired Workers
Region
2004
2005
2004
2005
2004
2005
2004
2005
--Dollars per Hour--
Southeast2/
8.01
8.51
8.08
8.86
8.03
8.60
8.56
9.05
US3/
8.62
8.90
8.91
9.14
8.69
8.96
9.32
9.61
See footnotes below.
HIRED WORKERS: NUMBER AND HOURS WORKED BY REGION AND UNITED STATES1/ OCTOBER 10-16, 2004, AND OCTOBER 9-15, 2005
Expected to be Employed
Number of Workers
150 Days or More
149 Days or Less
Number of Hours Worked
Region
2004
2005
2004
2005
2004
2005
2004
2005
--1,000--
--Hours per Week--
--1,000--
Southeast2/ US3/
31
37
25
29
6
8
38.1
37.0
851
840
606
620
245
220
40.5
42.0
[Results from the Agricultural Labor Survey]. 1/ Excludes agricultural service workers. 2/ Southeast: AL, GA, SC. 3/ Excludes AK.
USDA, NASS, GEORGIA FIELD OFFICE
STEPHENS FEDERAL BLDG., SUITE 320 355 EAST HANCOCK AVE. ATHENS, GA 30601 PHONE 706-546-2236
ADDRESS SERVICE REQUESTED
FARM REPORT (ISSN 744-7280) is published monthly by the USDA, NASS, Georgia Field Office, 355 East Hancock Ave., Athens, GA 30601-5099. Periodicals postage paid at Athens, GA, and additional mailing offices. Postmaster: Send address changes to FARM REPORT, USDA, NASS, Georgia Field Office, Stephens Federal Building, Suite 320, 355 East Hancock Ave., Athens, GA 30601-5099.
NEWS PAPER TIME VALUE