- Collection:
- Georgia Government Publications
- Serial:
- Georgia farm report.
- Title:
- Georgia farm report, vol. 04, no. 02 (2004 February 27)
- Creator:
- Georgia. Department of Agriculture
- Contributor to Resource:
- United States. Department of Agriculture
United States. National Agricultural Statistics Service
United States. National Agricultural Statistics Service. Georgia Office - Publisher:
- Athens, Ga. : United States Department of Agriculture, National Agricultural Statistics Service, in cooperation with the Georgia Department of Agriculture, Georgia Field Office
- Date of Original:
- 2004-02-27
- Subject:
- Agricultural productivity--Georgia--Statistics
Crop yields--Georgia--Statistics - Location:
- United States, Georgia, 32.75042, -83.50018
- Medium:
- state government records
- Type:
- Text
- Format:
- application/pdf
- Description:
- Began in 1975?; ceased with vol. 10, no. 02 (Feb. 26, 2010).
"Agricultural statistician and Georgia Department of Agriculture."
Numbering began again with Vol. 11, no. 1 (Jan. 14, 2000).
Vols. for Aug. 31, 2005- issued by: USDA-NASS Georgia Field Office.
Description based on: Vol. 94, no, 1 (Jan. 4, 1994); title from caption.
Latest issue consulted: Vol. 10, no. 02 (Feb. 26, 2010). - External Identifiers:
- Call Number GA A400.C7 P1 F2 2004/2
- Metadata URL:
- https://dlg.galileo.usg.edu/id:dlg_ggpd_i-ga-ba400-pc7-bp1-bf2-b2004-s2-belec-p-btext
- Digital Object URL:
- https://dlg.galileo.usg.edu/do:dlg_ggpd_i-ga-ba400-pc7-bp1-bf2-b2004-s2-belec-p-btext
- Language:
- eng
- Holding Institution:
- University of Georgia. Map and Government Information Library
- Rights:
-

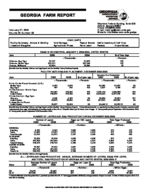
GEORGIA FARM REPORT
February 27, 2004 Volume 04-Number 02
Stephens Federal Building, Suite 320 Athens, Georgia 30601 Phone: (706)546-2236 E-mail: nass-ga@nass.usda.gov Website: http://www.nass.usda.gov/ga
Poultry Summary - Annual & Monthly Livestock Slaughter
HIGHLIGHTS
Cold Storage
Peanut Stocks Cattle Inventory & Calf Crop
Agricultural Prices
Farm Labor Pecans
Crops Values
EGGS IN INCUBATORS--JANUARY 1, 2003-2004, UNITED STATES
Item
2003
2004
--Thousands--
Chickens, Egg Type Chickens, Broiler Type Turkeys, All Breeds
30,117 623,171
30,804
31,655 637,048
28,394
[Results from the Monthly Chicken and Egg Report and the Monthly Turkey Hatchery Report].
% of Year Ago
--Percent--
105 102
92
POULTRY HATCHING AND PLACEMENT--DECEMBER 2002-2003
January thru December
Item
2002
2003
% of year ago
2002
2003
% of year ago
--Thousands--
--Percent--
--Thousands--
--Percent--
Pullet Chicks Placed Domestic (U.S.) Broiler Type Egg Type
Chicks Hatched - Broiler Type Georgia United States
Chicks Hatched - Egg Type Georgia United States
Turkeys Poults Placed United States
6,475 187
110,347 753,875
2,319 31,973
23,977
6,978 242
119,326 778,159
2,123 33,856
23,424
108
82,336
81,872
99
129
2,927
3,136
107
108
1,337,114
1,366,698
102
103
9,079,000
9,077,215
100
92
25,924
27,831
107
106
421,320
415,827
99
98
94,445 2/
90,555 3/
96
[Results from the Monthly Chicken and Egg Report and the Monthly Turkey Hatchery Report]. 1/ Domestic placements as reported by leading breeders includes expected pullet replacements from eggs sold during the preceding month at the rate of 125 pullet chicks per 30 dozen case of eggs. 2/ Turkey poults placed September 2002-December 2002. 3/ Turkey poults placed September 2003-December 2003.
NUMBER OF LAYERS AND EGG PRODUCTION DURING DECEMBER 2002-2003
Number of Layers
2002
2003
Eggs per 100 Layers
2002
2003
Total Eggs Produced
2002
2003
--Thousands--
--Number--
--Millions--
GEORGIA Hatching Table Total Georgia 30 STATES Hatching Table Total 30 States UNITED STATES Hatching Table Total U.S.
9,130 11,385 20,515
52,909 265,369 318,278
57,597 282,719 340,316
9,041 11,631 20,672
52,819 262,904 315,723
57,522 281,003 338,525
1,895 2,372 2,157
1,839 2,258 2,189
1,837 2,261 2,189
1,880 2,261 2,095
1,838 2,301 2,224
1,836 2,305 2,225
173 270 433
973 5,993 6,966
1,058 6,392 7,451
170 263 433
971 6,050 7,021
1,056 6,476 7,531
[Results from the Monthly Chicken and Egg Report].
ALL LAYERS AND EGG PRODUCTION: ANNUAL AVERAGE NUMBER OF LAYERS, EGGS PER LAYER, AND TOTAL EGG PRODUCTION BY GEORGIA AND UNITED STATES, 2002-2003 1/
State
Average Number of Layers
2002
2003
Eggs per Layer 2/
2002
2003
Total Egg Production
2002
2003
--Thousand--
--Number--
--Million Eggs--
GA US 3/
20,473
20,442
243
337,380
335,368
257
247
4,967
5,047
259
87,179
87,196
1/ Annual estimates cover the period Dec 1, previous year thru Nov 30. 2/ Total egg production divided by average number of layers on hand. 3/ Sum of States may not add to U.S. total due to rounding.
USDA/NASS COOPERATING WITH THE GEORGIA DEPARTMENT OF AGRICULTURE
COMMERCIAL POULTRY SLAUGHTER 1/--NOVEMBER AND DECEMBER 2003
Item
Nov
Dec
% of Last Month
January thru December
--Thousands--
--Percent--
--Thousands--
Young Chickens Georgia United States
Mature Chickens Light Type, U.S. Heavy Type, U.S. Total U.S.
Percent Condemned Young Chickens Georgia United States
89,376 625,960
101,792 706,615
4,356 5,031 9,387
--Percent-0.64 0.81
5,932 5,497 11,429
0.97 0.93
114
1,231,329
113
8,512,945
136
76,604
109
70,958
122
147,562
--Percent--
0.72
0.91
1/ Federally inspected slaughter data as collected by Meat and Poultry Inspection Program.
LIVESTOCK SLAUGHTER--UNITED STATES, 1/ DECEMBER 2002-2003
Number Slaughtered
Average Live Weight
Total Live Weight
Species
2002
2003
2003 as % of 2002
2002
2003
2002
2003
--Thousand Head--
--Percent--
--Pounds--
--Thousand Pounds--
Cattle
2,771.8
2,668.2
96
Calves
98.2
97.5
99
Hogs
8,657.4
9,346.6
108
Sheep & Lambs
278.7
262.0
94
1,265 305 268 133
1,244 322 269 137
3,506,036 29,998
2,316,087 37,145
3,320,134 31,427
2,513,068 35,954
[Results from the U.S. Livestock Slaughter Release]. 1/ Includes slaughter under Federal Inspection and other commercial slaughter, excludes farm slaughter.
COLD STORAGE STOCKS--UNITED STATES, DECEMBER 31, 2003
Commodity
Dec 31, 2002
Nov 30, 2003
Dec 31, 2003
% of Dec 2002
% of Nov 2003
--Thousand Pounds--
--Percent--
Eggs, Frozen, Total
13,525
14,909
18,055
133
121
Meats, Red
1,011,471
828,066
879,813
87
106
Beef, Frozen, Total
524,641
373,770
395,894
75
106
Pork, Frozen, Total
468,501
438,940
470,701
100
107
Poultry, Frozen
1,107,529
921,767
963,501
87
105
Peanuts, Shelled
275,060
192,444
224,096
81
116
Peanuts, In Shell
13,878
14,972
17,074
123
114
Pecans, Shelled
35,135
16,347
18,423
52
113
Pecans, In Shell
76,241
50,627
127,170
167
251
[Results from the Monthly Cold Storage Report].
Commodity
Price per Unit
PRICES RECEIVED BY FARMERS--JANUARY 15, 2004
Jan 2003
Georgia Dec 2003
Jan 15, 2004
Jan 2003
United States Dec 2003 Jan 15, 2004
Cotton
/Lb
43.40
62.90
66.00 1/
45.50
64.10
63.80 1/
Cottonseed
$/Ton
79.00
96.00
101.00
105.00
127.00
127.00
Peanuts, In Shell 2/ /Lb
3/
19.00
3/
19.10
19.60
20.60
Calves
/Lb
88.90
106.00
99.50
96.80
112.00
105.00
Beef Cattle 4/
/Lb
48.00
61.60
59.20
73.20
90.50
77.40
Cows 5/
/Lb
36.80
49.40
49.00
36.90
49.40
45.80
Steers & Heifers /Lb
70.80
85.30
79.80
77.80
95.70
81.20
[Results from the monthly Prices Received by Farmers]. 1/ Based on sales during first half of the month. 2/ Includes additional loan peanuts at loan value. 3/ Insufficient sales to establish a price. 4/ Cows, steers and heifers. 5/ Beef cows and cull dairy cows sold for slaughter.
INDEX NUMBERS--UNITED STATES
2002 Dec
2003
Jan
Dec
UNITED STATES (1990-92 = 100)
Prices Received
100
100
113
Prices Paid
125
126
130
Ratio 1/
80
79
87
[Results from the monthly Prices Received by Farmers]. 1/ Ratio of index of prices received by farmers to index of prices paid.
2
2004 Jan
111 130
85
STOCKS OF PEANUTS AND SPECIFIED PRODUCTS AT MONTH'S END, CROP--2003 1/
Farmer Stock Equivalent
Month Ending Farmer Stock Shelled Peanuts 2/ Roasting Stock (In Shell) Shelled Peanuts
Total 3/
--Thousand Pounds--
Dec
1,713,440
403,561
41,456
536,736
2,291,632
[Results from the Peanut Stocks and Processing Report]. 1/ Excludes stocks on farms. Includes stocks owned by or held for account of CCC in commercial storage facilities. Farmer stock on net weight basis. 2/ Includes shelled edible grades, shelled oil stock, and shelled seed (untreated). 3/ Actual farmer stock, plus roasting stock, plus shelled peanuts X 1.33.
FARM WAGE RATES--JANUARY 12-18, 2003, AND JANUARY 11-17, 2004, BY REGION AND UNITED STATES 1/
Region
Wage Rates for All Hired Workers
2003
2004
Field
2003
2004
Type of Hired Worker
Livestock
2003
2004
Field and Livestock
2003
2004
Southeast 2/
8.87
US 3/
9.34
--Dollars per Hour--
8.10
7.50
7.67
8.96
7.61
8.12
7.65
9.41
8.30
8.39
8.90
8.84
8.50
8.55
See footnotes below.
NUMBER OF HIRED WORKERS ON FARMS AND HOURS WORKED FOR THE WEEK JANUARY 12-18, 2003, AND JANUARY 11-17, 2004, BY REGION AND UNITED STATES 1/
Region
Hired Workers
Number
Hours Worked
2003
2004
2003
2004
Expected to be Employed
150 Days or More
149 Days or Less
2003
2004
2003
2004
--1,000--
--Hours per Week--
--1,000--
Southeast 2/ US 3/
24
27
35.6
35.5
22
729
667
37.7
38.1
614
21
2
6
554
115
113
[Results from the Agricultural Labor Survey]. 1/ Excludes agricultural service workers. 2/ Southeast: AL, GA, SC. 3/ Excludes AK.
ALL PECANS: UTILIZED PRODUCTION, PRICE PER POUND, VALUE OF PRODUCTION, GEORGIA AND UNITED STATES, 2001-2003
State
Utilized Production
2001
2002
2003
Price per Pound
2001
2002
2003
Value of Production
2001
2002
2003
--1,000 Pounds--
--Dollars--
--1,000 Dollars--
GA
110,000
45,000
60,000
0.612
1.000
US
338,500
172,900
262,200
0.594
0.955
0.950 1.000
67,350 201,101
44,880 165,033
57,000 263,211
[Results from the January 1 Pecan Inquiry].
CATTLE AND CALVES: NUMBER BY CLASS AND CALF CROP, GEORGIA AND UNITED STATES, JANUARY 1, 2003-2004 1/
Georgia
United States
Class
2003
2004 2004 as % of 2003
2003
2004 2004 as % of 2003
--1,000 Head--
--Percent--
--1,000 Head--
--Percent--
Cattle and Calves Cows and Heifers That Have Calved
Beef Cows Milk Cows Heifers 500 Pounds and Over For Beef Cow Replacement
Expected to Calve For Milk Cow Replacement
Expected to Calve Other Heifers Steers 500 Pounds and Over Bulls 500 Pounds and Over Calves Under 500 Pounds Cattle on Feed
1,290 710 625 85 155 90 2/ 29 2/ 36 50 40 335 3
1,250 700 616 84 141 85 2/ 26 2/ 30 40 39 330 3/
97
96,100
94,882
99
99
42,125
41,851
99
99
32,983
32,860
100
99
9,142
8,991
98
91
19,628
19,341
99
94
5,624
5,517
98
2/
3,548
3,492
98
90
4,114
4,020
98
2/
2,877
2,761
96
83
9,891
9,804
99
80
16,554
16,280
98
98
2,248
2,206
98
99
15,545
15,204
98
3/
13,220
13,811
104
2002
2003 2003 as % of 2002
2002
2003 2003 as % of 2002
Calf Crop
600
580
97
38,224
37,903
99
[Results from the Cattle Report]. 1/ Totals may not add due to rounding. 2/ Data not available. 3/ GA included in Other States beginning in 2004, which impacts 2004 as a percent of 2003.
3
GEORGIA ANNUAL CROP SUMMARY, 2003
Crop
Planted Acres Harvested Acres Yield per Acre Unit Production
Unit Price Value of Production
--1,000 Acres--
--1,000--
--Dollars--
--$1,000--
Corn, grain Corn, silage Cotton, lint 1/ Cottonseed Hay 2/ Oats Peanuts Rye Sorghum, Grain Sorghum, Silage Soybeans Tobacco 2/ Wheat Apples 3/4/ Blueberries 5/ Grapes 3/4/ Peaches 3/4/ Pecans Cabbage Cantaloupes
340
1,300
600 100 545 270
55
190 27.0 380
9.2 6.8
285 45
1,290
600 30
540 50 38 15
180 27.0 230
1.2 4.6 1.1 13.5
9.0 6.7
129 17
781
3.0 56 3,450 16 47 12 33 2,240 46 10,800 3,700 2.82 8,890
130 215
Bu
36,765
Ton
765
Lb
2,100
Ton
719
Ton
1,800
Bu
1,680
Lb
1,863,000
Bu
800
Bu
1,786
Ton
180
Bu
5,940
Lb
60,480
Bu
10,580
Lb
12,900
Lb
17,000
Ton
3.1
Lb
120,000
Lb
60,000
Cwt
1,170
Cwt
1,441
2.35
0.614 95.50 60.00
1.70 0.185
4.00 4.10
7.25 1.855
3.05 0.106 1.110 978.00 0.280 0.950 12.00 12.50
86,398
618,912 68,665
108,000 2,856
344,655 3,200 4,101
43,065 112,190
32,269 1,368
18,790 2,738
32,512 57,000 14,040 18,013
Cucumbers
15.0
14.6
170
Cwt
2,482
10.60
26,309
Onions
14.0
12.5
175
Cwt
2,188
34.30
75,048
Snap Beans Sweet Corn Tomatoes Watermelons Bell Pepper 6/ Squash 6/ Total
18.0 26.0
2.6 26.0
2.9 10.0 3,927.5
15.5 20.0
1.6 24.0
2.7 9.5 3,466.5
50
Cwt
755
140
Cwt
2,800
340
Cwt
544
215
Cwt
5,160
300
Cwt
810
130
Cwt
1,244
40.00 16.50 31.50
7.80 30.00 28.00
31,000 46,200 17,136 40,248 24,300 34,832 1,863,845
1/ Cotton yield pounds per acre; production 480 lb. bales. 2/ Harvested acres substituted for planted acres. 3/ Bearing age acreage and utilized production. 4/ Yield based on total production. 5/ Yield based on utilized production. 6/ Estimates began in 2000.