- Collection:
- Georgia Government Publications
- Serial:
- Georgia farm report.
- Title:
- Georgia farm report, vol. 04, no. 12 (2004 December 30)
- Creator:
- Georgia. Department of Agriculture
- Contributor to Resource:
- United States. Department of Agriculture
United States. National Agricultural Statistics Service
United States. National Agricultural Statistics Service. Georgia Office - Publisher:
- Athens, Ga. : United States Department of Agriculture, National Agricultural Statistics Service, in cooperation with the Georgia Department of Agriculture, Georgia Field Office
- Date of Original:
- 2004-12-30
- Subject:
- Agricultural productivity--Georgia--Statistics
Crop yields--Georgia--Statistics - Location:
- United States, Georgia, 32.75042, -83.50018
- Medium:
- state government records
- Type:
- Text
- Format:
- application/pdf
- Description:
- Began in 1975?; ceased with vol. 10, no. 02 (Feb. 26, 2010).
"Agricultural statistician and Georgia Department of Agriculture."
Numbering began again with Vol. 11, no. 1 (Jan. 14, 2000).
Vols. for Aug. 31, 2005- issued by: USDA-NASS Georgia Field Office.
Description based on: Vol. 94, no, 1 (Jan. 4, 1994); title from caption.
Latest issue consulted: Vol. 10, no. 02 (Feb. 26, 2010). - External Identifiers:
- Call Number GA A400.C7 P1 F2 2004/12
- Metadata URL:
- https://dlg.galileo.usg.edu/id:dlg_ggpd_i-ga-ba400-pc7-bp1-bf2-b2004-s12-belec-p-btext
- Digital Object URL:
- https://dlg.galileo.usg.edu/do:dlg_ggpd_i-ga-ba400-pc7-bp1-bf2-b2004-s12-belec-p-btext
- Language:
- eng
- Holding Institution:
- University of Georgia. Map and Government Information Library
- Rights:
-

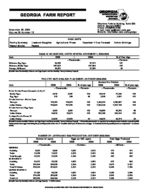
GEORGIA FARM REPORT
December 30, 2004 Volume 04-Number 12
Stephens Federal Building, Suite 320 Athens, Georgia 30601 Phone: (706)546-2236 E-mail: nass-ga@nass.usda.gov Website: http://www.nass.usda.gov/ga
Poultry Summary Livestock Slaughter
Peanut Stocks
Pecans
HIGHLIGHTS
Agricultural Prices
December 1 Crop Forecast
Cotton Ginnings
EGGS IN INCUBATORS, UNITED STATES--NOVEMBER 1, 2003-2004
Item
2003
2004
--Thousands--
Chickens, Egg Type
29,088
37,001
Chickens, Broiler Type
587,923
607,594
Turkeys, All Breeds
28,650
27,385
[Results from the Monthly Chicken and Egg Report and the Monthly Turkey Hatchery Report].
% of Year Ago --Percent--
127 103
96
POULTRY HATCHING AND PLACEMENT--OCTOBER 2003-2004
January thru October
Item
2003
2004
% of year ago
2003
2004
% of year ago
--Thousands--
--Percent--
--Thousands--
--Percent--
Pullet Chicks Placed Domestic (U.S.) 1/
Broiler Type
6,312
6,587
104
68,210
70,046
103
Egg Type
310
268
86
2,633
2,657
101
Chicks Hatched - Broiler Type
Georgia
113,151
116,221
103
1,142,731
1,190,327
104
United States
734,961
757,530
103
7,592,024
7,807,118
103
Chicks Hatched- Egg Type
Georgia
2,360
2,397
102
23,980
23,780
99
United States
34,812
35,971
103
352,183
362,041
103
Turkeys Poults Placed 2/
United States
22,805
20,806
91
44,976
42,074
94
[Results from the monthly Chicken and Egg Report and them monthly Turkey Hatchery Report]. 1/ Domestic placements as reported by leading breeders includes expected pullet replacements from eggs sold during the preceding month at the rate of 125 pullet chicks per 30 dozen case of eggs. 2/ Accumulated turkey poults placed are September 1 to current month.
NUMBER OF LAYERS AND EGG PRODUCTION--OCTOBER 2003-2004
Number of Layers
Eggs per 100 Layers
Total Eggs Produced
2003
2004
2003
2004
2003
2004
--Thousands--
--Number--
--Millions--
GEORGIA
Hatching
8,962
8,996
1,930
1,912
173
172
Table
11,238
11,327
2,305
2,322
259
263
Total Georgia
20,200
20,323
2,139
2,140
432
435
30 STATES 1/
Hatching
52,617
53,233
1,853
1,852
975
986
Table
260,424
268,668
2,294
2,295
5,973
6,167
Total 30 States
313,041
321,901
2,220
2,222
6,948
7,154
UNITED STATES 1/
Hatching
57,195
58,236
1,850
1,861
1,058
1,084
Table
278,138
285,958
2,294
2,294
6,381
6,559
Total U.S.
335,333
344,194
2,218
2,221
7,439
7,643
[Results from the Monthly Chicken and Egg Report]. 1/ 2003 revised.
USDA/NASS COOPERATING WITH THE GEORGIA DEPARTMENT OF AGRICULTURE
COMMERCIAL POULTRY SLAUGHTER 1/--SEPTEMBER AND OCTOBER 2004
Item
Sep
Oct
% of Last Month
--Thousands--
--Percent--
Young Chickens
Georgia
108,574
103,636
95
United States
753,919
730,381
97
Mature Chickens
Light Type, U.S.
6,155
5,922
96
Heavy Type, U.S.
6,565
6,213
95
Total U.S.
12,720
12,135
95
Percent Condemned Young Chickens
--Percent--
Georgia
0.90
0.83
United States
1.06
1.08
1/ Federally inspected slaughter data as collected by Meat and Poultry Inspection Program.
January to Date --Thousands--
1,044,811 7,332,981
60,593 59,478 120,071
--Percent--
0.92 1.08
LIVESTOCK SLAUGHTER, UNITED STATES 1/--OCTOBER 2003, 2004
Number Slaughtered
Average Live Weight
Total Live Weight
Species
2003
2004
2004 as% of 2003
2003
2004
2003
2004
--Thousand Head--
--Percent--
--Pounds--
--Thousand Pounds--
Cattle
3,009.5
2,745.7
91
1,231
1,267
3,704,306 3,479,458
Calves
87.2
62.5
72
308
330
26,881
20,645
Hogs
9,649.2
8,970.2
93
267
267
2,578,610 2,392,890
Sheep & Lambs
265.1
241.4
91
134
134
35,626
32,418
[Results from the U.S. Livestock Slaughter Release]. 1/ Includes slaughter under Federal Inspection and other commercial slaughter, excludes farm slaughter.
Commodity
Price per Unit
PRICES RECEIVED BY FARMERS--NOVEMBER 15, 2004
Georgia
Nov 2003
Oct 2004
Nov 15, 2004
Nov 2003
United States Oct 2004 Nov 15, 2004
Cotton
/Lb
61.90
47.10
43.20 1/
63.00
49.50
47.10 1/
Cottonseed
$/Ton
95.00
88.00
85.00
120.00
107.00
104.00
Peanuts, In Shell 2/ /Lb
18.70
19.10
21.10
18.40
20.30
21.60
Calves
/Lb
102.00
120.00
122.00
111.00
126.00
124.00
Beef Cattle 3/
/Lb
58.10
66.00
65.20
93.40
86.10
84.20
Cows 5/
/Lb
45.40
50.90
50.50
47.70
49.90
48.60
Steers & Heifers /Lb
84.00
95.30
95.10
99.90
91.00
89.10
[Results from the monthly Prices Received by Farmers]. 1/ Based on sales during first half of the month. 2/ Includes additional loan peanuts at loan value. 3/ "Cows," "Steers and Heifers" combined. 4/ Beef cows and cull dairy cows sold for slaughter.
INDEX NUMBERS--UNITED STATES
2003
Oct
Nov
UNITED STATES (1990-92= 100)
Prices Received
113
116
Prices Paid
129
129
Ratio 1/
88
90
[Results from the monthly Prices Received by Farmers]. 1/ Ratio of index of prices received by farmers to index of prices paid.
Oct
113 135
84
2004
Nov
114 134
85
2
GEORGIA ACREAGE, YIELD AND PRODUCTION, 2003 AND DECEMBER 1, 2004 FORECAST
Area Harvested
Yield per Acre
Production
Crop
Unit
2003
Ind Dec 1, 2004
2003
Ind Dec 1, 2004
2003
Ind Dec 1, 2004
--Thousand Acres--
--Thousands--
Corn for Grain
Bu
285
280
129
130
36,765
36,400
Hay, All Other
Ton
600
580
3.00
3.00
1,800
1,740
Wheat, Winter
Bu
230
200
46.0
46.0
10,580
9,200
Peanuts
Lb
540.0
610.0
3,450
3,000
1,863,000
1,830,000
Soybeans for Beans Bu
180
260
33.0
30.0
5,940
7,800
Cotton, Upland 1/
Bale
1,290.0
1,260.0
785
686
2,110.0
1,800.0
Tobacco, Type 14
Lb
27.0
24.0
2,200
1,950
59,400
46,800
Apples 2/
Lb
3/
3/
3/
3/
13,000
14,000
Grapes 2/
Ton
3/
3/
3/
3/
3.1
2.8
Peaches 2/
Lb
3/
3/
3/
3/
110,000
110,000
Pecans
Lb
4/
4/
4/
4/
75,000
40,000
Data are the latest estimates available. 1/ Cotton yield in pounds per harvested acre, production in 480 lb. net weight bales. 2/ Bearing age acres. 3/ Acreage and yield estimates will be released in the Noncitrus Fruits and Nuts Summary, January 2005. 4/ Not available.
ALL COTTON-DECEMBER 1, 2004, FORECAST BY SELECTED STATES AND U.S.
State
Acres for Harvest
Yield
Ind. Production 1/
2004 as % of 2003
--Thousand Acres--
--Pounds--
--Thousand Bales 2/--
--Percent--
AL
535.0
754
840.0
102
GA
1,260.0
686
1,800.0
85
SC
218.0
815
370.0
113
TN
540.0
862
970.0
109
US
13,223.0
828
22,815.0
125
1/ Production ginned and to be ginned. 2/ 480 lb. net weight bales.
Type and State
All
AL
GA
SC
TN
US
COTTON GINNINGS: EQUIVALENT 480-POUND BALES GINNED, CROP YEARS 2003-2004
2003
2004
622,900
654,150
1,422,900
1,399,200
209,600
295,750
739,350
815,250
13,465,900
14,722,150
STOCKS OF PEANUTS AND SPECIFIED PRODUCTS AT MONTH'S END--2004 1/
Farmer Stock Equivalent
Month Ending Farmer Stocks Shelled Peanuts 2/ Roasting Stock (In Shell)
Shelled Peanuts
Total 3/
--Thousand Pounds--
Oct
1,737,916
393,088
26,544
522,807
2,287,267
[Results from the Peanut Stocks and Processing Report]. 1/ Excludes stocks on farms. Includes stocks owned by or held for account of CCC in commercial storages. Farmer stock on net weight basis. 2/ Includes shelled edible grades, shelled oil stock, and shelled seed (untreated). 3/ Actual farmer stock, plus roasting stock, plus shelled peanuts x 1.33.
3
Crop and State
Improved Varieties 1/ AL AZ AR 2/ CA 2/ FL 2/ GA LA MS 2/ NM NC 2/ OK SC 2/ TX
PECANS: UTILIZED PRODUCTION BY CROP, STATE, AND UNITED STATES, 2002-2003 AND FORECAST DECEMBER 1, 2004
Utilized Production
2002
2003
--1,000 Pounds--
4,000 16,000
1,200 3,800
500 42,000
2,000 2,100 36,000 1,500 1,500
120 20,000
7,000 22,500
1,400 3,700
500 60,000
4,000 4,800 55,000 2,200 1,500 3,300 37,000
2004
950 13,000
1,300 3,400
200 35,000
2,000 700
37,000 600
4,000 1,500 28,000
US
130,720
202,900
127,650
Native & Seedling AL AR 2/ FL 2/ GA KS 2/ LA MS 2/ NC 2/ OK SC 2/ TX
1,000 500 900
3,000 2,900 4,000
900 400 8,500
80 20,000
1,000 2,400 1,600 15,000 2,000 16,000 2,200
300 4,500 1,200 33,000
50 900 300 5,000 2,500 6,000 300 100 22,000 500 12,000
US
42,180
79,200
49,650
All Pecans AL AZ AR 2/ CA 2/ FL 2/ GA KS 2/ LA MS 2/ NM NC 2/ OK SC 2/ TX
5,000 16,000
1,700 3,800 1,400 45,000 2,900 6,000 3,000 36,000 1,900 10,000
200 40,000
8,000 22,500
3,800 3,700 2,100 75,000 2,000 20,000 7,000 55,000 2,500 6,000 4,500 70,000
1,000 13,000
2,200 3,400
500 40,000
2,500 8,000 1,000 37,000
700 26,000
2,000 40,000
US
172,900
282,100
1/ Budded, grafted, or topworked varieties. 2/ Estimates for current year carried forward from earlier forecast.
177,300