- Collection:
- Georgia Government Publications
- Serial:
- Georgia farm report.
- Title:
- Georgia farm report, vol. 04, no. 11 (2004 November 30)
- Creator:
- Georgia. Department of Agriculture
- Contributor to Resource:
- United States. Department of Agriculture
United States. National Agricultural Statistics Service
United States. National Agricultural Statistics Service. Georgia Office - Publisher:
- Athens, Ga. : United States Department of Agriculture, National Agricultural Statistics Service, in cooperation with the Georgia Department of Agriculture, Georgia Field Office
- Date of Original:
- 2004-11-30
- Subject:
- Agricultural productivity--Georgia--Statistics
Crop yields--Georgia--Statistics - Location:
- United States, Georgia, 32.75042, -83.50018
- Medium:
- state government records
- Type:
- Text
- Format:
- application/pdf
- Description:
- Began in 1975?; ceased with vol. 10, no. 02 (Feb. 26, 2010).
"Agricultural statistician and Georgia Department of Agriculture."
Numbering began again with Vol. 11, no. 1 (Jan. 14, 2000).
Vols. for Aug. 31, 2005- issued by: USDA-NASS Georgia Field Office.
Description based on: Vol. 94, no, 1 (Jan. 4, 1994); title from caption.
Latest issue consulted: Vol. 10, no. 02 (Feb. 26, 2010). - External Identifiers:
- Call Number GA A400.C7 P1 F2 2004/11
- Metadata URL:
- https://dlg.galileo.usg.edu/id:dlg_ggpd_i-ga-ba400-pc7-bp1-bf2-b2004-s11-belec-p-btext
- Digital Object URL:
- https://dlg.galileo.usg.edu/do:dlg_ggpd_i-ga-ba400-pc7-bp1-bf2-b2004-s11-belec-p-btext
- Language:
- eng
- Holding Institution:
- University of Georgia. Map and Government Information Library
- Rights:
-

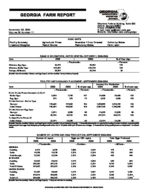
GEORGIA FARM REPORT
November 30, 2004 Volume 04-Number 11
Poultry Summary Livestock Slaughter
Agricultural Prices Peanut Stocks
Stephens Federal Building, Suite 320 Athens, Georgia 30601 Phone: (706)546-2236 E-mail: nass-ga@nass.usda.gov Website: http://www.nass.usda.gov/ga
HIGHLIGHTS
November 1 Crop Forecast Peanuts by States
Cotton by States Farm Labor
EGGS IN INCUBATORS, UNITED STATES--OCTOBER 1, 2003-2004
Item
2003
2004
--Thousands--
Chickens, Egg Type
29,750
33,662
Chickens, Broiler Type
601,567
616,708
Turkeys, All Breeds
28,081
26,744
[Results from the monthly Chicken and Egg Report and the monthly Turkey Hatchery Report].
% of Year Ago --Percent--
113 103
95
POULTRY HATCHING AND PLACEMENT--SEPTEMBER 2003-2004
January thru September
Item
2003
2004
% of year ago
2004
2004
% of year ago
--Thousands--
--Percent--
--Thousands--
--Percent--
Pullet Chicks Placed Domestic (U.S.) 1/
Broiler Type
6,654
7,758
117
61,898
63,459
103
Egg Type
273
205
75
2,323
2,389
103
Chicks Hatched - Broiler Type
Georgia
113,442
117,942
104
1,029,580
1,074,106
104
United States
739,481
769,865
104
6,857,063
7,049,588
103
Chicks Hatched- Egg Type
Georgia
2,371
2,339
99
21,620
21,383
99
United States
35,763
36,750
103
317,371
326,070
103
Turkeys Poults Placed 2/
United States
22,171
21,268
96
22,171
21,268
96
[Results from the monthly Chicken and Egg Report and the monthly Turkey Hatchery Report]. 1/ Domestic placements as reported by leading breeders includes expected pullet replacements from eggs sold during the preceding month at the rate of 125 pullet chicks per 30 dozen case of eggs. 2/ Accumulated turkey poults placed are September 1 to current month.
NUMBER OF LAYERS AND EGG PRODUCTION--SEPTEMBER 2003-2004
Number of Layers
Eggs per 100 Layers
Total Eggs Produced
2003
2004
2003
2004
2003
2004
--Thousands--
--Number--
--Millions--
GEORGIA
Hatching
9,172
9,036
1,886
1,915
173
173
Table
11,058
11,018
2,279
2,224
252
245
Total Georgia
20,230
20,054
2,101
2,084
425
418
30 STATES
Hatching
52,640
53,411
1,776
1,803
935
963
Table
259,290
267,210
2,201
2,200
5,706
5,879
Total 30 States
311,930
320,621
2,129
2,134
6,641
6,842
UNITED STATES
Hatching
57,287
58,440
1,775
1,807
1,017
1,056
Table Total U.S.
276,911 334,198
284,680 343,120
2,201 2,128
2,200 2,133
6,095 7,112
6,264 1/
7,319
[Results from the monthly Chicken and Egg Report]. 1/ May not add due to rounding.
USDA/NASS COOPERATING WITH THE GEORGIA DEPARTMENT OF AGRICULTURE
COMMERCIAL POULTRY SLAUGHTER 1/--AUGUST AND SEPTEMBER 2004
Item
Aug
Sep
% of Last Month
--Thousands--
--Percent--
Young Chickens
Georgia
108,968
108,195
99
United States
770,656
752,676
98
Mature Chickens
Light Type, U.S.
6,388
6,155
96
Heavy Type, U.S.
6,506
6,565
101
Total U.S.
12,894
12,720
99
Percent Condemned Young Chickens
--Percent--
Georgia
0.88
0.90
United States
1.06
1.06
1/ Federally inspected slaughter data as collected by Meat and Poultry Inspection Program.
January to Date --Thousands--
925,372 6,601,357
54,671 53,265 107,936
--Percent--
0.93 1.08
LIVESTOCK SLAUGHTER--UNITED STATES, 1/ SEPTEMBER 2003, 2004
Number Slaughtered
Average Live Weight
Total Live Weight
Species
2003
2004 2004 as % of 2003
2003
2004
2003
2004
--Thousand Head--
--Percent--
--Pounds--
--Thousand Pounds--
Cattle
3,128.9
2,735.5
87
1,228
1,266
3,841,020
3,462,349
Calves
82.3
67.3
82
308
321
25,325
21,622
Hogs
8,573.3
8,997.7
105
263
265
2,251,547
2,384,285
Sheep & Lambs
257.2
243.6
95
131
133
33,652
32,334
[Results form the U.S. Livestock Slaughter Release]. 1/ Includes slaughter under Federal Inspection and other commercial slaughter, excludes farm slaughter.
Commodity
Price per Unit
PRICES RECEIVED BY FARMERS--OCTOBER 15, 2004
Georgia
Oct 2003
Sep 2004
Oct 15, 2004
Oct 2003
United States Sep 2004 Oct 15, 2004
Cotton
/Lb
60.60
47.20
48.30 1/
67.80
49.30
47.70 1/
Cottonseed
$/Ton
94.00
-
88.00
104.00
89.00
107.00
Peanuts, In Shell 2/ /Lb
18.00
19.00
18.40
18.50
19.20
19.40
Calves
/Lb
101.00
123.00
119.00
112.00
129.00
127.00
Beef Cattle 3/
/Lb
55.50
69.20
67.30
91.50
85.80
86.40
Cows 4/
/Lb
41.60
54.20
52.00
44.60
53.10
50.40
Steers & Heifers /Lb
82.50
98.20
97.00
97.80
89.30
91.10
[Results from the monthly Prices Received by Farmers]. 1/ Based on sales during first half of the month. 2/ Includes additional loan peanuts at loan value. 3/ "Cows," "Steers and Heifers" combined. 4/ Beef cows and cull dairy cows sold for slaughter.
INDEX NUMBERS--UNITED STATES
2003
Sep
Oct
Sep
UNITED STATES (1990-92= 100)
Prices Received
111
113
115
Prices Paid
128
129
134
Ratio 1/
87
88
86
[Results from the monthly Prices Received by Farmers]. 1/ Ratio of index of prices received by farmers to index of prices paid.
2004
Oct
111 134
83
STOCKS OF PEANUTS AND SPECIFIED PRODUCTS AT MONTH'S END--2004 1/
Farmer Stock Equivalent
Month Ending Farmer Stocks Shelled Peanuts 2/ Roasting Stock (In Shell)
Shelled Peanuts
Total 3/
--Thousand Pounds--
Sep
469,906
367,535
23,889
488,822
982,617
[Results from the Peanut Stocks and Processing Report]. 1/ Excludes stocks on farms. Includes stocks owned by or held for account of CCC in commercial storages. Farmer stock on net weight basis. 2/ Includes shelled edible grades, shelled oil stock, and shelled seed (untreated). 3/ Actual farmer stock, plus roasting stock, plus shelled peanuts x 1.33.
2
GEORGIA ACREAGE, YIELD AND PRODUCTION, 2003 AND NOVEMBER 1, 2004 FORECAST
Area Harvested
Yield per Acre
Production
Crop
Unit
2003
Ind Nov 1, 2004
2003
Ind Nov 1, 2004
2003
Ind Nov 1, 2004
--Thousand Acres--
--Thousands--
Corn for Grain
Bu
285
280
129
130
36,765
36,400
Hay, All Other
Ton
600
580
3.0
3.0
1,800
1,740
Wheat, Winter
Bu
230
200
46
46
10,580
9,200
Peanuts
Lb
540
610
3,450
3,000
1,863,000
1,830,000
Soybeans for Beans Bu
180
260
33
30
5,940
7,800
Cotton, Upland 1/
Bale
1,290
1,260
785
686
2,110
1,800
Tobacco, Type 14
Lbs
27.0
24.0
2,200
1,950
59,400
46,800
Apples 2/
Lbs
3/
3/
3/
3/
13,000
14,000
Grapes 2/
Ton
3/
3/
3/
3/
3.1
2.8
Peaches 2/
Lbs
3/
3/
3/
3/
110,000
110,000
Pecans
Lbs
4/
4/
4/
4/
75,000
40,000
1/ Cotton yield in pounds per harvested acre, production in 480 lb. net weight bales. 2/ Bearing age acres. 3/ Acreage and yield estimates will be released in the Noncitrus Fruits and Nuts Summary, January 2005. 4/ Not available.
PEANUT PRODUCTION--NOVEMBER 1, 2004 FORECAST BY STATES AND UNITED STATES
Area Harvested
Yield
Production 1/
State
Ind 2004
Ind 2004
Ind 2004
2004 as % of 2003
--1,000 Acres--
--Pounds--
--1,000 Lbs.--
--Percent--
AL
195.0
2,800
546,000
107
FL
130.0
2,600
338,000
98
GA
610.0
3,000
1,830,000
98
SC
33.0
3,400
112,200
194
US
1,388.0
3,027
4,201,350
101
1/ Estimates comprised of quota and non-quota peanuts.
ALL COTTON--NOVEMBER 1, 2004 FORECAST BY STATES AND UNITED STATES
State
Acres for Harvest
Yield
Production 1/
2004 as % of 2003
--1,000 Acres--
--Pounds--
--1,000 Bales 2/--
--Percent--
AL
535.0
727
810.0
99
GA
1,260.0
686
1,800.0
85
SC
218.0
815
370.0
113
TN
540.0
844
950.0
107
US
13,223.0
818
22,545.0
123
1/ Production ginned and to be ginned. 2/ 480 lb. net weight bales.
3
ANNUAL AVERAGE WAGE RATES FOR HIRED WORKERS IN GEORGIA AND UNITED STATES--2003 AND 2004
2003
2004
All Hired
Field
Field and Livestock
All Hired
Field
Field and Livestock
--Dollars per Hour--
GA
8.78
8.09
8.22
9.10
8.52
8.51
US 1/
9.08
8.31
8.42
9.22
8.45
8.55
[Results from the Agricultural Labor Survey]. 1/ Excludes AK.
FARM WAGE RATES--OCTOBER 12-18, 2003, AND OCTOBER 10-16, 2004, BY REGION AND UNITED STATES 1/
Type of Hired Worker
Wage Rates for All Hired Workers
Field
Livestock
Field and Livestock
Region
2003
2004
2003
2004
2003
2004
2003
2004
--Dollars per Hour--
Southeast 2/
8.26
8.56
7.90
8.01
7.84
8.08
7.88
8.03
US 3/
9.05
9.30
8.42
8.60
8.64
8.91
8.47
8.67
See footnotes below.
NUMBER OF HIRED WORKERS ON FARMS AND HOURS WORKED FOR THE WEEK OCTOBER 12-18, 2003, AND OCTOBER 10-16, 2004, BY REGION AND UNITED STATES 1/
Hired Workers
Expected to be Employed
Number
Hours Worked
150 Days or More
149 Days or Less
Region
2003
2004
2003
2004
2003
2004
2003
2004
--1,000--
--Hours per Week--
--1,000--
Southeast 2/
38
31
38.9
38.1
26
25
12
6
US 3/
891
851
40.2
40.5
626
605
265
246
[Results from the Agricultural Labor Survey]. 1/ Excludes agricultural service workers. 2/ Southeast: AL, GA, SC. 3/ Excludes AK.