- Collection:
- Georgia Government Publications
- Serial:
- Georgia farm report.
- Title:
- Georgia farm report, vol. 04, no. 01 (2004 January 30)
- Creator:
- Georgia. Department of Agriculture
- Contributor to Resource:
- United States. Department of Agriculture
United States. National Agricultural Statistics Service
United States. National Agricultural Statistics Service. Georgia Office - Publisher:
- Athens, Ga. : United States Department of Agriculture, National Agricultural Statistics Service, in cooperation with the Georgia Department of Agriculture, Georgia Field Office
- Date of Original:
- 2004-01-30
- Subject:
- Agricultural productivity--Georgia--Statistics
Crop yields--Georgia--Statistics - Location:
- United States, Georgia, 32.75042, -83.50018
- Medium:
- state government records
- Type:
- Text
- Format:
- application/pdf
- Description:
- Began in 1975?; ceased with vol. 10, no. 02 (Feb. 26, 2010).
"Agricultural statistician and Georgia Department of Agriculture."
Numbering began again with Vol. 11, no. 1 (Jan. 14, 2000).
Vols. for Aug. 31, 2005- issued by: USDA-NASS Georgia Field Office.
Description based on: Vol. 94, no, 1 (Jan. 4, 1994); title from caption.
Latest issue consulted: Vol. 10, no. 02 (Feb. 26, 2010). - External Identifiers:
- Call Number GA A400.C7 P1 F2 2004/1
- Metadata URL:
- https://dlg.galileo.usg.edu/id:dlg_ggpd_i-ga-ba400-pc7-bp1-bf2-b2004-s1-belec-p-btext
- Digital Object URL:
- https://dlg.galileo.usg.edu/do:dlg_ggpd_i-ga-ba400-pc7-bp1-bf2-b2004-s1-belec-p-btext
- Language:
- eng
- Holding Institution:
- University of Georgia. Map and Government Information Library
- Rights:
-

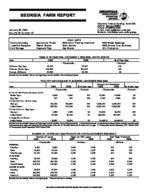
GEORGIA FARM REPORT
January 30, 2004 Volume 04-Number 01
Poultry Summary Livestock Slaughter Cold Storage
Agricultural Prices Peanut Stocks Hogs and Pigs
Stephens Federal Building, Suite 320 Athens, Georgia 30601 Phone: (706)546-2236 E-mail: nass-ga@nass.usda.gov Website: http://www.nass.usda.gov/ga
HIGHLIGHTS 2004 Onion Planting Intentions Grain Stocks Hay Stocks
2004 Wheat Seedings 2003 Annual Crop Summary Milk Production
EGGS IN INCUBATORS--DECEMBER 1, 2002-2003, UNITED STATES
Item
2002
2003
--Thousands--
Chickens, Egg Type
29,123
33,321
Chickens, Broiler Type
619,589
636,411
Turkeys, All Breeds
30,089
28,144
[Results from the Monthly Chicken and Egg Report and the Monthly Turkey Hatchery Report].
% of Year Ago --Percent-114 103 94
POULTRY HATCHING AND PLACEMENT--NOVEMBER 2002-2003
January thru November
Item
2002
2003
% of year ago
2002
2003
% of year ago
--Thousands--
--Percent--
--Thousands--
--Percent--
Pullet Chicks Placed Domestic (U.S.) Broiler Type Egg Type
6,938 227
6,946 315
100
75,861
74,894
99
139
2,740
2,894
106
Chicks Hatched - Broiler Type Georgia United States
Chicks Hatched - Egg Type Georgia United States
100,472 690,052
1,855 31,146
106,252 707,619
1,728 30,129
106
1,226,767
1,247,372
102
103
8,325,125
8,299,056
100
93
23,605
25,708
109
97
389,347
381,971
98
Turkeys Poults Placed United States
23,987
21,978
92
70,468 2/
66,954 3/
95
[Results from the Monthly Chicken and Egg Report and the Monthly Turkey Hatchery Report]. 1/ Domestic placements as reported by leading breeders includes expected pullet replacements from eggs sold during the preceding month at the rate of 125 pullet chicks per 30 dozen case of eggs. 2/ Turkey poults placed September 2001-October 2002. 3/ Turkey poults placed September 2002-October 2003.
NUMBER OF LAYERS AND EGG PRODUCTION DURING NOVEMBER 2002-2003 1/
Number of Layers
2002
2003
Eggs per 100 Layers
2002
2003
Total Eggs Produced
2002
2003
GEORGIA
--Thousands--
--Number--
--Millions--
Hatching
9,197
8,983
1,881
1,848
173
166
Table
10,925
11,516
2,270
2,223
248
256
Total Georgia
20,122
20,499
2,092
2,059
421
422
30 STATES
Hatching
52,513
52,699
1,792
1,786
941
941
Table
263,703
260,798
2,206
2,241
5,816
5,844
Total 30 States
316,216
313,497
2,137
2,164
6,758
6,785
UNITED STATES
Hatching
56,978
57,327
1,790
1,786
1,020
1,024
Table
280,830
278,725
2,209
2,243
6,204
6,251
Total U.S.
337,808
336,052
2,139
2,165
7,226
7,275
[Results from the Monthly Chicken and Egg Report]. 1/ May not add due to rounding.
USDA/NASS COOPERATING WITH THE GEORGIA DEPARTMENT OF AGRICULTURE
COMMERCIAL POULTRY SLAUGHTER 1/--OCTOBER AND NOVEMBER 2003
Item
Oct
Nov
% of Last Month
January thru November
--Thousands--
--Percent--
--Thousands--
Young Chickens Georgia United States
114,255 781,640
89,207 625,473
78
1,129,368
80
7,805,843
Mature Chickens Light Type, U.S. Heavy Type, U.S. Total U.S.
Percent Condemned Young Chickens Georgia United States
5,982 6,328 12,310
--Percent-0.73 0.85
4,282 5,031 9,313
0.63 0.80
72
70,598
80
65,461
76
136,059
--Percent--
0.69
0.90
1/ Federally inspected slaughter data as collected by Meat and Poultry Inspection Program.
LIVESTOCK SLAUGHTER, UNITED STATES 1/--NOVEMBER 2002, 2003
Number Slaughtered
Average Live Weight
Total Live Weight
Species
2002
2003
2003 as% of 2002
2002
2003
2002
2003
--Thousand Head--
--Percent--
--Pounds--
--Thousand Pounds--
Cattle
2,861.1
2,425.8
85
Calves
90.8
78.0
86
Hogs
8,654.2
8,581.9
99
Sheep & Lambs
271.1
236.3
87
1,260 309 268 132
1,236 321 269 138
3,606,284 28,026
2,315,147 35,777
2,998,990 25,084
2,311,656 32,546
[Results from the U.S. Livestock Slaughter Release]. 1/ Includes slaughter under Federal Inspection and other commercial slaughter, excludes farm slaughter.
COLD STORAGE STOCKS--UNITED STATES, NOVEMBER 30, 2003
Commodity
Nov 30, 2002
Oct 31, 2003
Nov 30, 2003
% of Nov 2002
% of Oct 2003
--Thousand Pounds--
--Percent --
Eggs, Frozen
11,199
16,854
14,922
133
89
Meats, Red
997,688
836,916
827,731
83
99
Beef, Frozen
512,567
375,171
371,824
73
99
Pork, Frozen
463,942
446,843
439,852
95
98
Poultry, Frozen
1,142,313
1,186,037
939,035
82
79
Peanuts, Shelled
260,687
168,126
205,366
79
122
Peanuts, In Shell
13,589
10,329
15,776
116
153
Pecans, Shelled
35,114
16,417
15,315
44
93
Pecans, In Shell
42,369
10,703
35,271
83
330
[Results from the Monthly Cold Storage Report].
Commodity
Price per Unit
PRICES RECEIVED BY FARMERS--DECEMBER 15, 2003
Georgia
Dec 2002
Nov 2003 Dec 15, 2003 Dec 2002
United States Nov 2003 Dec 15, 2003
Cotton
/Lb
45.70
62.20
61.80 1/
44.30
63.40
63.10 1/
Cottonseed
$/Ton
76.00
95.00
96.00
101.00
121.00
127.00
Peanuts, In Shell /Lb
16.6
18.7
18.6
17.5
18.4
18.9
Calves
/Lb
85.60
102.00
107.00
95.30
112.00
113.00
Beef Cattle 2/
/Lb
46.20
58.10
61.60
70.40
93.70
92.70
Cows 3/
/Lb
34.20
45.40
49.40
34.60
47.80
49.90
Steers & Heifers /Lb
69.40
84.00
85.20
75.00
100.00
98.60
[Results from the Monthly Prices Received by Farmers]. 1/ Based on sales during first half of the month. 2/ "Cows," "steers and heifers" combined. 3/ Beef cows and cull dairy cows sold for slaughter.
INDEX NUMBERS--UNITED STATES
2002
Nov
Dec
UNITED STATES (1990-92= 100) Prices Received Prices Paid Ratio 1/
97
100
125
125
78
80
[Results from the Monthly Prices Received by Farmers]. 1/ Ratio of index of prices received by farmers to index of prices paid.
Nov
117 130
90
2003
Dec
115 130
88
2
STOCKS OF PEANUTS AND SPECIFIED PRODUCTS AT MONTH'S END --2003 1/
Month Ending Farmer Stocks Shelled Peanuts 2/ Roasting Stock (In Shell)
Farmer Stock Equivalent
Shelled Peanuts
Total 3/
--Thousand Pounds--
Nov
1,876,564
343,693
36,490
457,112
2,370,166
[Results from the Peanut Stocks and Processing Report]. 1/ Excludes stocks on farms. Includes stocks owned by or held for account of CCC in commercial storages. Farmer stock on net weight basis. 2/ Includes shelled edible grades, shelled oil stock, and shelled seed (untreated). 3/ Actual farmer stock, plus roasting stock, plus shelled peanuts x 1.33.
HOGS AND PIGS: BREEDING, MARKET, AND TOTAL INVENTORY AND INVENTORY NUMBER BY WEIGHT GROUP, GEORGIA AND UNITED STATES, DECEMBER 1, 2002-2003
Breeding
Market
Total
Under 60 Lbs. 60-119 Lbs. 120-179 Lbs. 180 Lbs. and Over
State 2002 2003 2002 2003 2002
GA
55
48
290
247
345
US
6,012 5,966 53,501 54,074 59,513
[Results from the December Quarterly Hogs and Pigs Report].
2003
295 60,040
2002 2003
--1000 Head--
133
114
19,461 19,821
2002 2003
67
56
13,054 13,250
2002 2003 2002
50
42
40
10,881 10,839 10,105
2003
35 10,164
ANNUAL FARROWINGS: NUMBER OF SOWS, PIGS PER LITTER, AND PIG CROP, GEORGIA AND UNITED STATES, DECEMBER-NOVEMBER 2002-2003 1/
Sows Farrowing
Pigs
Pig Crop
2003
Per Litter
2003
State
2002
Number as % of 2002
2002
2003
2002
Number as % of 2002
--1,000 Head--
--Percent--
--Number--
--1,000 Head--
--Percent--
GA
101.0
95.0
94
US
11,483
11,306
98
8.84
8.81
893.0
837.0
94
8.83
8.88
101,344
100,406
99
[Results from the December Quarterly Hogs and Pigs Report]. 1/ December preceding year.
SPRING ONIONS--PLANTING INTENTIONS AND PROSPECTIVE ACRES FOR HARVEST, 1/ GEORGIA AND TOTAL
State
2002
Planted 2003
2004
Harvested
2002
2003
For Harvest 2004
--Acres--
--Acres--
--Acres--
GA Total 2/
14,700 38,900
14,000 35,200
14,000 35,600
11,500 34,200
12,500 31,700
13,500
[Results from the Onions Acreage Intentions]. 1/ Primarily fresh market. 2/ Harvested acreage for 2004 will be published April 2, 2004.
GEORGIA GRAIN STOCKS AND CAPACITY, DECEMBER 1, 2002-2003
Grain
On Farms
2002 Off Farms 1/
All Positions
On Farms
2003 Off Farms 1/
All Positions
--1,000 Bushels--
Corn Wheat Oats Storage Capacity
* * * 75,000
6,978 *
82 46,750
* * * 121,750
* * * 75,000
6,603 *
33 45,000
* * * 120,000
[Results from the December Agricultural Survey and Grain Stocks Report]. 1/ Includes stocks at mills, elevators, warehouses, terminals, and processors. *Not published to avoid disclosing individual operations.
HAY STOCKS ON FARMS--GEORGIA AND UNITED STATES, 2002-2003
State
2002
December 1
2003
2002
May 1
--1,000 Tons--
--1,000 Tons--
GA
1,400
1,494
350
US
103,692
110,752
22,494
[Results from the December Agricultural Survey].
2003
230 22,168
WINTER WHEAT: AREA SEEDED, GEORGIA AND UNITED STATES, CROP YEAR 2002-2004
State
2002
2003 --1,000 Acres--
2004
GA
350
US
41,845
[Results from the December Agricultural Survey].
380 44,945
350 43,464
3
GEORGIA ANNUAL CROP SUMMARY, 2002, 2003
Crop
Year
Planted Acres
Harvested Acres
Yield per Acre
--1,000 Acres--
Corn, grain
2003
340
285
129
2002
340
290
115
Corn, silage
2003
45
17
2002
40
16
Cotton, lint
2003
1,300
1,290
781
2002
1,450
1,360
557
Cottonseed
2003
2002
Hay
2003
600 2/
600
3.0
2002
650 2/
650
2.6
Oats
2003
90
30
56
2002
100
25
60
Peanuts
2003
545
540
3,450
2002
510
505
2,600
Rye
2003
270
50
16
2002
260
45
16
Sorghum, Grain 2003
55
38
47
2002
55
30
43
Sorghum, Silage 2003
15
12
2002
20
13
Soybeans
2003
190
180
33
2002
160
140
21
Tobacco
2003
27.0 2/
27.0
2,240
2002
26.5 2/
26.5
2,100
Wheat
2003
380
230
46
2002
350
200
41
1/ Cotton yield pounds per acre; production 480 lb. bales. 2/ Harvested acres substituted for planted acres.
Unit
Bu Bu Ton Ton 1/ 1/ Ton Ton Ton Ton Bu Bu Lb Lb Bu Bu Bu Bu Ton Ton Bu Bu Lb Lb Bu Bu
Production --1,000--
36,765 33,350
765 640 2,100 1,578 719 544 1,800 1,690 1,680 1,500 1,863,000 1,313,000 800 720 1,786 1,290 180 260 5,940 2,940 60,480 55,650 10,580 8,200
PRELIMINARY MILK COWS AND MILK PRODUCTION, OCTOBER-DECEMBER 2002-2003
Georgia
United States
Item
Unit
2002
2003
2003 as % of 2002
2002
2003 2003 as % of 2002
Milk Cows 1/
Thous Head
85
84
99
9,148
9,007
98
Milk per Cow 2/ Pounds
4,047
4,012
99
4,543
4,588
101
Milk Production Mil Lbs
344
337
98
41,555
41,322
99
[Results from the Milk Production Report]. 1/ Includes dry cows, excludes heifers not yet fresh. 2/ Excludes milk sucked by calves.