- Collection:
- Georgia Government Publications
- Serial:
- Georgia farm report.
- Title:
- Georgia farm report, vol. 03, no. 09 (2003 September 30)
- Creator:
- Georgia. Department of Agriculture
- Contributor to Resource:
- United States. Department of Agriculture
United States. National Agricultural Statistics Service
United States. National Agricultural Statistics Service. Georgia Office - Publisher:
- Athens, Ga. : United States Department of Agriculture, National Agricultural Statistics Service, in cooperation with the Georgia Department of Agriculture, Georgia Field Office
- Date of Original:
- 2003-09-30
- Subject:
- Agricultural productivity--Georgia--Statistics
Crop yields--Georgia--Statistics - Location:
- United States, Georgia, 32.75042, -83.50018
- Medium:
- state government records
- Type:
- Text
- Format:
- application/pdf
- Description:
- Began in 1975?; ceased with vol. 10, no. 02 (Feb. 26, 2010).
"Agricultural statistician and Georgia Department of Agriculture."
Numbering began again with Vol. 11, no. 1 (Jan. 14, 2000).
Vols. for Aug. 31, 2005- issued by: USDA-NASS Georgia Field Office.
Description based on: Vol. 94, no, 1 (Jan. 4, 1994); title from caption.
Latest issue consulted: Vol. 10, no. 02 (Feb. 26, 2010). - External Identifiers:
- Call Number GA A400.C7 P1 F2 2003/9
- Metadata URL:
- https://dlg.galileo.usg.edu/id:dlg_ggpd_i-ga-ba400-pc7-bp1-bf2-b2003-s9-belec-p-btext
- Digital Object URL:
- https://dlg.galileo.usg.edu/do:dlg_ggpd_i-ga-ba400-pc7-bp1-bf2-b2003-s9-belec-p-btext
- Language:
- eng
- Holding Institution:
- University of Georgia. Map and Government Information Library
- Rights:
-

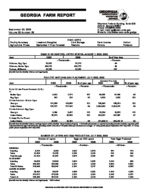
GEORGIA FARM REPORT
September 30, 2003 Volume 03-Number 09
Poultry Summary Agricultural Prices
HIGHLIGHTS
Livestock Slaughter
Cold Storage
September 1 Crop Forecast
Peanuts
Stephens Federal Building, Suite 320 Athens, Georgia 30601 Phone: (706)546-2236 E-mail: nass-ga@nass.usda.gov Website: http://www.nass.usda.gov/ga
Farm Income Onions
Cotton Tobacco
EGGS IN INCUBATORS, UNITED STATES--AUGUST 1, 2002, 2003
Item
2002
2003
% of Year Ago
--Thousands--
--Percent--
Chickens, Egg Type
32,832
30,710
94
Chickens, Broiler Type
644,725
640,775
99
Turkeys, All Breeds
32,236
32,232
100
[Results from the Monthly Chicken and Egg Report].
POULTRY HATCHING AND PLACEMENT--JULY 2002, 2003
January thru July
Item
2002
2003
% of year ago
2002
2003
% of year ago
--Thousands--
--Percent--
--Thousands--
--Percent--
Pullet Chicks Placed Domestic (U.S.) 1/
Broiler Type
6,602
7,071
107
48,533
47,408
98
Egg Type
282
226
80
1,829
1,820
100
Chicks Hatched - Broiler Type
Georgia
117,389
118,582
101
792,543
795,231
100
United States
781,707
777,341
99
5,394,093
5,334,270
99
Chicks Hatched- Egg Type
Georgia
2,194
2,407
110
15,324
16,820
110
United States
35,573
35,593
100
254,637
247,887
97
Turkeys Poults Placed
United States
25,646
25,182
98
272,949 2/
269,222 3/
99
[Results from the Monthly Chicken and Egg Report and the Monthly Turkey Hatchery Report]. 1/ Domestic placements as reported by leading breeders includes expected pullet replacements from eggs sold during the preceding month at the rate of 125 pullet chicks per 30 dozen case of eggs. 2/ Turkey poults placed September 2001-May 2002. 3/ Turkey poults placed September 2001-May 2002.
NUMBER OF LAYERS AND EGG PRODUCTION--JULY 2002, 2003
GEORGIA Hatching Table Total Georgia 30 STATES* Hatching Table Total 30 States UNITED STATES* Hatching Table Total U.S.
Number of Layers
2002
2003
--Thousands--
9,516 10,608 20,124
9,284 11,053 20,337
54,608 259,340 313,948
53,864 255,483 309,347
59,426 276,072 335,498
58,637 273,065 331,702
Eggs per 100 Layers
2002
2003
--Number--
1,902 2,036 1,973
1,874 2,226 2,065
1,861 2,261 2,191
1,853 2,294 2,217
1,858 2,261 2,190
1,850 2,291 2,214
Total Eggs Produced
2002
2003
--Millions--
181
174
216
246
397
420
1,016 5,864 6,880
998 5,860 6,858
1,104 6,243 7,347
1,085 6,257 7,343
[Results from the Monthly Chicken and Egg Report]. * 2002 revised.
USDA/NASS COOPERATING WITH THE GEORGIA DEPARTMENT OF AGRICULTURE
COMMERCIAL POULTRY SLAUGHTER 1/--JUNE AND JULY 2003
Item
Jun
Jul
% of Last Month
--Thousands--
--Percent--
Young Chickens
Georgia
100,878
108,260
107
United States
706,647
761,780
108
Mature Chickens
Light Type, U.S.
6,440
5,605
87
Heavy Type, U.S.
6,304
6,943
110
Total U.S.
12,744
12,548
98
Percent Condemned Young Chickens
--Percent--
Georgia
0.65
0.74
United States
0.94
0.85
1/ Federally inspected slaughter data as collected by Meat and Poultry Inspection Program.
January to Date --Thousands--
712,604 4,945,662
49,545 41,916 91,461 --Percent--
0.71 0.95
LIVESTOCK SLAUGHTER, UNITED STATES 1/--JULY 2002, 2003
Species
2002
Number Slaughtered
2003
2003 as% of 2002
Average Live Weight
2002
2003
Total Live Weight
2002
2003
--Thousand Head--
--Percent--
--Pounds--
--Thousand Pounds--
Cattle
3,187.7
3,285.3
103
1,248
1,225
3,978,539 4,024,014
Calves
95.8
84.9
89
291
288
27,862
24,486
Hogs
8,068.3
8,101.9
100
260
262
2,101,546 2,125,365
Sheep & Lambs
259.0
239.2
92
126
131
32,712
31,236
[Results from the U.S. Livestock Slaughter Release]. 1/ Includes slaughter under Federal Inspection and other commercial slaughter, excludes farm slaughter.
COLD STORAGE STOCKS--UNITED STATES, JULY 31, 2003
Commodity
Jul 31, 2002
Jun 30, 2003
Jul 31, 2003
% of Jul 2002
% of Jun 2003
--Thousand Pounds--
--Percent--
Eggs, Frozen
12,943
17,951
18,525
143
103
Meats, Red
912,606
842,487
820,493
90
97
Beef, Frozen
416,534
371,477
370,772
89
100
Pork, Frozen
472,184
455,012
433,581
92
95
Poultry, Frozen
1,582,593
1,378,343
1,392,326
88
101
Peanuts, Shelled
458,404
400,397
379,283
83
95
Peanuts, In Shell
30,661
23,047
22,447
73
97
Pecans, Shelled
53,939
43,258
38,273
71
88
Pecans, In Shell
104,570
47,296
28,925
28
61
[Results form the Monthly Cold Storage Report].
Commodity
Price per Unit
PRICES RECEIVED BY FARMERS--AUGUST 15, 2003
Aug 2002
Georgia Jul 2003
Aug 15, 2003 Aug 2002
United States Jul 2003 Aug 15, 2003
Cotton
/Lb
28.50
45.70
43.70 1/
33.00
46.10
44.00 1/
Calves
/Lb
82.90
96.30
97.00
94.90
103.00
105.00
Beef Cattle 2/
/Lb
47.00
54.60
55.30
64.40
75.80
78.50
Cows 3/
/Lb
36.40
42.30
42.30
36.40
44.90
44.80
Steers & Heifers /Lb
66.60
78.40
79.30
67.30
78.80
81.70
[Results from the Monthly Prices Received by Farmers]. 1/ Based on sales during first half of the month. 2/ Cows, steers and heifers. 3/ Beef cows and cull dairy cows sold for slaughter.
INDEX NUMBERS--UNITED STATES
2002
Jul
Aug
Jul
UNITED STATES (1990-92 = 100)
Prices Received
99
Prices Paid
123
Ratio 1/
80
100
105
124
127
81
83
[Results from the Monthly Prices Received by Farmers]. 1/ Ratio of index of prices received by farmers to index of prices paid.
2003
Aug
108 127
85
2
NET FARM INCOME FOR SELECTED STATES, 1998-2002
State
1998
1999
2000
2001
--1,000 Dollars--
Alabama
1,199,463
1,443,044
1,150,761
1,661,139
Florida
2,606,494
2,723,733
2,529,485
2,497,364
Georgia
1,943,183
2,134,177
1,997,976
2,360,033
South Carolina
329,005
433,555
574,328
697,007
United States
46,212,753
46,840,798
47,809,182
50,560,295
1/ Source: Economic Research Service/USDA. Information Contact: Roger Strickland. E-Mail: rogers@ers.usda.gov
2002
1,199,561 2,667,272 1,698,536
177,908 35,323,130
ONIONS--SPRING SEASON, BY STATES, 2002 AND 2003
Area Planted
Area Harvested
Yield per Acre
Production
Value per Cwt
State 2002 2003 2002 2003 2002 2003 2002 2003 2002 2003
--Acres--
--Acres--
--Cwt--
--1,000 Cwt--
--Dollars--
AZ 1/
1,600 1,500
1,500
1,500
460
500
690
750
8.35
9.90
CA
6,400 6,700
6,200
6,500
460
480
2,852 3,120
14.20
22.90
GA
14,700 14,000
11,500 12,500
125
175
1,438 2,188
32.20
34.30
TX
16,200 13,000
15,000 11,000
315
320
4,725 3,520
21.40
38.10
Total
38,900 35,200
34,200 31,500
284
304
9,705 9,578
20.00
30.10
[Results from the Acreage, Production and Price Inquiry]. 1/ Includes a small amount of processing.
Total Value
2002 2003
--1,000 Dollars--
5,762
7,425
40,498 71,448
46,304 75,048
101,115 134,112
193,679 288,033
GEORGIA ACREAGE, YIELD AND PRODUCTION-2002, AND SEPTEMBER 1, 2003 FORECAST
Area Harvested 1/
Yield per Acre
Production
Crop
Unit
2002
Ind Sep 1, 2003
2002
Ind Sep 1, 2003
2002
Ind Sep 1, 2003
--Thousand Acres--
--Thousands--
Corn
Bu
290
330
115.0
135.0
33,350
44,550
Cotton 2/
Bales
1,360.0
1,290.0
557
733
1,578
1,970
Hay, All 3/
Tons
650
630
2.60
3.00
1,690
1,890
Peanuts
Lbs
505.0
535.0
2,600
3,200
1,313,000
1,712,000
Soybeans
Bu
140
170
21.0
33.0
2,940
5,610
Tobacco, All 4/
Lbs
26,500
29,000
2,100
2,200
55,650
63,800
Wheat, All 3/
Bu
200
230
41.0
44.0
8,200
10,120
Apples 3/
Lbs
1.20
5/
8,330
5/
10,000
11,000
Grapes 3/
Tons
1.10
5/
2.55
5/
2,800
3,200
Peaches 3/
Lbs
14.0
5/
7,140
5/
100,000
125,000
[Results from the September Yield Survey]. 1/ Harvested for principal use. 2/ Cotton yield in pounds per harvested acre, production in 480 lb. net weight bales. 3/ Estimates brought forward from earlier forecast. 4/ Type 14. 5/ Bearing age acreage. Bearing age acres and yield estimates released January 2003 in the Noncitrus Fruits and Nuts January 2004 Preliminary Summary.
State
AL FL GA NM NC OK SC TX VA
PEANUTS: AREA HARVESTED, YIELD, AND PRODUCTION BY STATE AND UNITED STATES, 2002 AND SEPTEMBER 1, 2003 FORECAST
Area Harvested
Yield
Production 1/
2002
2003
2002
Aug 1, 2003
Sep 1, 2003
2002
2003
--Thousand Acres--
--Pounds--
--Thousand Pounds--
185.0
189.0
2,050
2,900
2,900
379,250
548,100
86.0
107.0
2,300
2,700
2,900
197,800
310,300
505.0
535.0
2,600
3,200
3,200
1,313,000
1,712,000
18.0
17.0
3,000
2,900
2,900
54,000
49,300
100.0
100.0
2,100
2,900
2,900
210,000
290,000
57.0
38.0
2,800
2,900
2,900
159,600
110,200
8.7
18.0
2,200
3,200
3,200
19,140
57,600
280.0
240.0
3,100
3,400
3,400
868,000
816,000
57.0
33.0
2,100
2,700
2,800
119,700
92,400
US
1,296.7
1,277.0
1/ Estimates comprised of quota and non-quota peanuts.
2,561
3,102
3,121
3,320,490
3,985,900
3
State
AL AZ AR CA GA LA MS MO NM NC OK SC TN TX VA
ALL COTTON: AREA HARVESTED, YIELD, AND PRODUCTION BY SELECTED STATES, AND UNITED STATES, 2002 AND SEPTEMBER 1, 2003 FORECAST
Area Harvested
Yield
Production 1/
2002
2003
2002
Aug 1, 2003 Sep 1, 2003
2002
2003
--1,000 Acres--
--Pounds--
--1,000 Bales 2/--
540.0
510.0
507
652
706
570.0
750.0
221.2
211.9
1,368
1,313
1,313
630.3
579.5
920.0
925.0
871
787
804
1,669.0
1,550.0
686.0
694.0
1,444
1,273
1,293
2,063.3
1,870.0
1,360.0
1,290.0
557
744
733
1,578.0
1,970.0
495.0
520.0
717
667
738
739.0
800.0
1,150.0
1,100.0
808
807
851
1,935.0
1,950.0
368.0
390.0
796
726
689
610.0
560.0
57.1
48.0
844
860
860
100.4
86.0
920.0
770.0
421
630
623
806.0
1,000.0
180.0
170.0
557
452
452
209.0
160.0
200.0
217.0
314
725
719
131.0
325.0
530.0
535.0
741
664
709
818.0
790.0
4,518.3
4,519.5
540
472
440
5,082.3
4,140.0
98.0
85.0
465
717
734
95.0
130.0
Other States 3/
183.0
207.0
452
629
645
172.3
278.0
US
12,426.6
12,192.4
665
667
667
17,208.6
16,938.5
[Results from the September Yield Survey]. 1/ Production ginned and to be ginned. 2/ 480-Lb. net weight bales. 3/ Other States include FL and KS. Individual state level estimates will be published in the "Crop Production 2003 Summary."
TOBACCO, TYPE 14, GA-FL BELT: AREA HARVESTED, YIELD, AND PRODUCTION BY STATE, AND UNITED STATES, 2002 AND SEPTEMBER 1, 2003 FORECAST
Area Harvested
Yield
Production
State
2002
2003
2002
2003
2002
2003
--Acres--
--Pounds--
--1,000 Pounds--
FL
4,600
4,000
2,600
2,500
11,960
10,000
GA
26,500
29,000
2,100
2,200
55,650
63,800
US
428,660
413,710
2,055
2,008
880,734
830,771
[Results from the September Yield Survey].