- Collection:
- Georgia Government Publications
- Serial:
- Georgia farm report.
- Title:
- Georgia farm report, vol. 02, no. 04 (2002 February 28)
- Creator:
- Georgia. Department of Agriculture
- Contributor to Resource:
- United States. Department of Agriculture
United States. National Agricultural Statistics Service
United States. National Agricultural Statistics Service. Georgia Office - Publisher:
- Athens, Ga. : United States Department of Agriculture, National Agricultural Statistics Service, in cooperation with the Georgia Department of Agriculture, Georgia Field Office
- Date of Original:
- 2002-02-28
- Subject:
- Agricultural productivity--Georgia--Statistics
Crop yields--Georgia--Statistics - Location:
- United States, Georgia, 32.75042, -83.50018
- Medium:
- state government records
- Type:
- Text
- Format:
- application/pdf
- Description:
- Began in 1975?; ceased with vol. 10, no. 02 (Feb. 26, 2010).
"Agricultural statistician and Georgia Department of Agriculture."
Numbering began again with Vol. 11, no. 1 (Jan. 14, 2000).
Vols. for Aug. 31, 2005- issued by: USDA-NASS Georgia Field Office.
Description based on: Vol. 94, no, 1 (Jan. 4, 1994); title from caption.
Latest issue consulted: Vol. 10, no. 02 (Feb. 26, 2010). - External Identifiers:
- Call Number GA A400.C7 P1 F2 2002/4
- Metadata URL:
- https://dlg.galileo.usg.edu/id:dlg_ggpd_i-ga-ba400-pc7-bp1-bf2-b2002-s4-belec-p-btext
- Digital Object URL:
- https://dlg.galileo.usg.edu/do:dlg_ggpd_i-ga-ba400-pc7-bp1-bf2-b2002-s4-belec-p-btext
- Language:
- eng
- Holding Institution:
- University of Georgia. Map and Government Information Library
- Rights:
-

GEORGIA FARM REPORT
February 28, 2002 Volume 02-Number 04
Stephens Federal Building, Suite 320 Athens, Georgia 30601 Phone: (706)546-2236 E-mail: nass-ga@nass.usda.gov Website: http://www.nass.usda.gov/ga
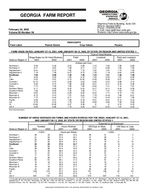
Farm Labor
Peanut Stocks
HIGHLIGHTS Crop Values
Pecans
FARM WAGE RATES--JANUARY 07-13, 2001, AND JANUARY 06-12, 2002, BY STATE OR REGION AND UNITED STATES 1/
Wage Rates for All Hired Workers
State or Region 2/
2001
2002
Field
2001
2002
Type of Hired Worker
Livestock
2001
2002
Field and Livestock
2001
2002
Northeast I Northeast II Appalachian I Appalachian II Southeast FL Lake Cornbelt I Cornbelt II Delta Northern Plains Southern Plains Mountain I Mountain II Mountain III Pacific CA HI US 4/
9.06 8.47 8.34 7.18 7.88 8.29 9.53 10.10 9.05 7.73 9.11 7.98 8.63 8.72 7.72 9.06 8.78 10.66 8.66
9.46 8.87 8.72 7.29 8.08 9.02 9.91 9.75 9.74 7.95 9.00 8.05 8.34 9.15 8.42 9.21 9.15 10.90 8.96
--Dollars per Hour--
8.42
9.58
7.45
7.80
7.86
8.69
7.98
8.71
7.01
6.88
7.59
7.95
7.65
7.73
7.82
7.94
7.73
7.83
6.57
6.72
7.26
7.18
6.84
6.93
7.30
7.56
7.25
7.61
7.29
7.58
7.65
8.15
7.90
9.05
7.67
8.26
9.12
10.22
8.26
8.26
8.57
8.94
8.58
9.03
9.06
9.22
8.88
9.15
7.86
8.62
8.61
9.41
8.49
9.26
7.56
7.90
6.62
7.21
7.15
7.61
8.45
8.34
8.47
8.41
8.46
8.39
7.35
7.82
7.71
7.37
7.53
7.57
8.06
8.02
8.22
7.74
8.19
7.81
7.57
8.54
7.76
8.48
7.68
8.51
6.71
7.57
7.35
8.48
6.91
7.85
7.96
8.18
8.81
9.64
8.13
8.42
7.79
8.25
8.68
9.69
7.95
8.39
9.07
9.36
3/
3/
9.10
9.33
7.76
8.25
8.07
8.25
7.87
8.25
See footnotes below.
NUMBER OF HIRED WORKERS ON FARMS AND HOURS WORKED FOR THE WEEK JANUARY 07-13, 2001, AND JANUARY 06-12, 2002, BY STATE OR REGION AND UNITED STATES 1/
State or Region 2/
Hired Workers
Number
2001
2002
Hours Worked
2001
2002
Expected to be Employed
150 Days or More
2001
2002
149 Days or Less
2001
2002
--1,000--
--Hours per Week--
--1,000--
Northeast I
28
33
39.6
40.0
26
Northeast II
31
33
37.9
38.1
27
Appalachian I
22
29
34.5
36.6
18
Appalachian II
27
25
32.8
34.4
14
Southeast
20
25
37.8
35.7
17
FL
55
62
37.6
37.2
47
Lake
38
38
34.6
33.5
34
Cornbelt I
34
30
36.9
40.4
29
Cornbelt II
14
24
37.3
33.5
13
Delta
17
24
33.5
33.1
15
Northern Plains
32
28
37.7
38.5
29
Southern Plains
65
61
38.1
41.5
54
Mountain I
19
18
42.3
34.5
17
Mountain II
18
17
39.8
33.2
15
Mountain III
18
18
44.2
47.7
16
Pacific
43
48
35.7
34.6
35
CA
203
210
37.3
42.2
161
HI
7
8
35.6
37.0
6
US 4/
691
731
37.3
38.6
573
31
2
2
29
4
4
26
4
3
15
13
10
21
3
4
50
8
12
33
4
5
25
5
5
21
1
3
18
2
6
25
3
3
54
11
7
16
2
2
13
3
4
16
2
2
39
8
9
158
42
52
7
1
1
597
118
134
1/ Excludes agricultural service workers. 2/ Regions consist of the following -- Northeast I: CT, ME, MA, NH, NY, RI, VT. Northeast II: DE, MD, NJ, PA. Appalachian I: NC, VA. Appalachian II: KY, TN, WV. Southeast: AL, GA, SC. Lake: MI, MN, WI. Cornbelt I: IL, IN, OH. Cornbelt II: IA, MO. Delta: AR, LA, MS. Northern Plains: KS, NE, ND, SD. Southern Plains: OK, TX. Mountain I: ID, MT, WY. Mountain II: CO, NV, UT. Mountain III: AZ, NM. Pacific: OR, WA. 3/ Insufficient data. 4/ Excludes AK.
USDA/NASS COOPERATING WITH THE GEORGIA DEPARTMENT OF AGRICULTURE
GEORGIA ANNUAL CROP SUMMARY, 2000, 2001
Crop
Year Planted Acres Harvested Acres Yield per Acre Unit Production Unit Price Value of Production
--1,000 Acres--
--1,000-- --Dollars--
--$1,000--
Corn, grain
2001
265
220
134
Bu
29,480
2.15
63,382
2000
360
240
107
Bu
25,680
2.06
52,901
Corn, silage
2001
40
18
Ton
720
2000
45
15
Ton
675
Cotton, lint 1/
2001
1,500
1,490
709
Lb
2,200
0.351
370,656
2000
1,500
1,350
591
Lb
1,663
0.556
443,821
Cottonseed
2001
Ton
750
66.00
49,500
2000
Ton
563
88.00
49,544
Hay 2/
2001
650
650
3.0
Ton
1,950
63.00
122,850
2000
650
650
2.4
Ton
1,560
59.00
92,040
Oats
2001
100
35
65
Bu
2,275
1.75
3,981
2000
70
35
72
Bu
2,520
1.40
3,528
Peanuts
2001
515
512
3,300
Lb
1,689,600
0.228
385,229
2000
494
492
2,700
Lb
1,328,400
0.286
379,922
Rye
2001
300
35
25
Bu
875
6.00
5,250
2000
230
45
26
Bu
1,170
4.90
5,733
Sorghum, Grain 2001
50
25
48
Bu
1,200
1.90
2,280
2000
55
30
45
Bu
1,350
1.99
2,687
Sorghum, Silage 2001
20
10
Ton
200
2000
15
9
Ton
135
Soybeans
2001
165
155
27
Bu
4,185
4.25
17,786
2000
170
140
24
Bu
3,360
4.43
14,885
Tobacco 2/
2001
26.5
26.5
2,430
Lb
64,395
1.855
119,453
2000
31
31
2,220
Lb
68,820
1.746
120,160
Wheat
2001
300
200
53
Bu
10,600
2.05
21,730
2000
300
200
54
Bu
10,800
2.45
26,460
Sweetpotatoes 2001
0.5
0.4
100
Cwt
40
13.00
520
2000
0.6
0.5
140
Cwt
70
14.00
980
Apples 3/ 4/
2001
1.2
7,500
Lb
9,000
0.230
2,051
2000
1.2
11,700
Lb
14,000
0.188
2,443
Blueberries 5/
2001
4.6
3,700
Lb
17,000
0.797
13,550
2000
4.6
4,130
Lb
19,000
0.971
18,450
Grapes 3/ 4/
2001
1.1
2.91
Ton
3.2
1,050.00
3,370
2000
1.2
2.92
Ton
3.2
1,230.00
3,920
Peaches 3/ 4/
2001
15.0
9,330
Lb
140,000
0.280
35,033
2000
17.0
6,760
Lb
115,000
0.379
41,703
Pecans
2001
Lb
95,000
0.632
60,000
2000
Lb
80,000
1.180
94,650
Cabbage
2001
8.6
8.1
300
Cwt
2,430
8.70
21,141
2000
7.9
7.1
350
Cwt
2,485
10.00
24,850
Cantaloupes
2001
5.9
5.3
160
Cwt
848
12.00
10,176
2000
6.8
5.5
165
Cwt
908
8.50
7,718
Cucumbers
2001
15.0
14.5
175
Cwt
2,538
12.80
32,486
2000
12.0
11.0
160
Cwt
1,760
13.00
22,880
Lima Beans
2001
3.9
3.7
34
Cwt
126
20.00
2,520
2000
3.5
3.1
20
Cwt
62
31.00
1,922
Onions
2001
14.5
13.5
190
Cwt
2,565
27.50
70,538
2000
15.0
12.4
255
Cwt
3,162
26.00
82,212
Snap Beans
2001
16.5
16.0
60
Cwt
960
22.00
21,120
2000
16.0
15.5
56
Cwt
868
34.00
29,512
Sweet Corn
2001
25.5
25.0
130
Cwt
3,250
14.60
47,450
2000
23.0
21.0
160
Cwt
3,360
12.50
42,000
1/ Cotton yield pounds per acre; production 480 lb. bales. 2/ Harvested acres substituted for planted acres. 3/ Bearing age acreage and utilized production. 4/ Yield based on total production. 5/ Yield based on utilized production. 6/ Total previous listed crops. 7/ Estimates began in 2000.
2
GEORGIA ANNUAL CROP SUMMARY, 2000, 2001, Continued
Crop
Year Planted Acres Harvested Acres Yield per Acre Unit Production Unit Price Value of Production
--1,000 Acres--
--1,000--
--Dollars--
--$1,000--
Tomatoes
2001
2.7
2.6
365
Cwt
949
25.00
23,725
2000
4.0
3.9
350
Cwt
1,365
24.50
33,443
Watermelons
2001
24.0
22.0
265
Cwt
5,830
5.00
29,150
2000
28.0
24.0
195
Cwt
4,680
4.60
21,528
Sub-Total 6/
2001 3,988.6
3,541.5
1,534,927
2000 3,976.8
3,401.0
1,619,892
Carrots 7/
2001
4.1
4.0
290
Cwt
1,160
12.00
13,920
2000
4.0
3.2
180
Cwt
576
11.50
6,624
Eggplant 7/
2001
0.5
0.5
625
Cwt
281
18.00
5,058
2000
1.2
1.1
440
Cwt
484
19.20
9,293
Collard Greens 7/ 2001
8.0
7.5
130
Cwt
975
17.80
17,330
2000
7.0
6.5
140
Cwt
910
12.00
10,908
Kale 7/
2001
0.7
0.7
140
Cwt
91
12.40
1,129
2000
1.2
1.1
150
Cwt
165
11.00
1,813
Mustard Greens 7/ 2001
2.3
2.2
150
Cwt
330
23.00
7,574
2000
3.1
3.0
200
Cwt
600
28.10
16,870
Turnip Greens 7/ 2001
5.0
4.7
120
Cwt
562
11.30
6,366
2000
5.0
4.6
170
Cwt
782
13.60
10,662
Okra 7/
2001
0.4
0.4
23
Cwt
8
42.00
336
2000
0.6
0.5
28
Cwt
14
52.00
728
Bell Pepper 7/ 2001
2.2
2.1
200
Cwt
420
28.00
11,760
2000
5.5
5.3
170
Cwt
901
26.60
23,967
Squash 7/
2001
9.0
7.9
125
Cwt
988
21.20
20,990
2000
12.0
10.5
220
Cwt
2,310
24.80
57,199
Total
2001 4,020.8
3,571.5
1,619,390
2000 4,016.4
3,436.8
1,757,956
1/ Cotton yield pounds per acre; production 480 lb. bales. 2/ Harvested acres substituted for planted acres. 3/ Bearing age acreage and utilized production. 4/ Yield based on total production. 5/ Yield based on utilized production. 6/ Total previous listed crops. 7/ Estimates began in 2000.
STOCKS OF PEANUTS AND SPECIFIED PRODUCTS AT MONTH'S END, CROP -- 2001-2002 1/
Farmer Stock Equivalent
Month Ending Farmer Stock Shelled Peanuts 2/ Roasting Stock (In Shell) Shelled Peanuts
Total 3/
--Thousand Pounds--
2001
Aug
85,406
562,486
21,007
748,106
854,519
Sep
830,509
486,709
16,086
647,323
1,493,918
Oct
3,012,120
546,455
34,502
726,785
3,773,407
Nov
3,439,426
580,262
47,226
771,748
4,258,400
Dec
3,213,296
629,662
47,304
837,450
4,098,050
2002
Jan
Feb
Mar
Apr
May
Jun
Jul
1/ Excludes stocks on farms. Includes stocks owned by or held for account of CCC in commercial storage facilities. Farmer stock on net weight basis. 2/ Includes shelled edible grades, shelled oil stock, and shelled seed (untreated). 3/ Actual farmer stock, plus roasting stock, plus shelled peanuts X 1.33.
3
PECANS: UTILIZED PRODUCTION BY VARIETY, STATE, AND UNITED STATES, 1999-2001
Utilized Production
Variety and State
1999
2000
2001
--1,000 Pounds--
Improved Varieties 1/ AL AZ AR CA FL GA LA MS NM NC OK SC TX US
Native and Seedling AL AR FL GA KS LA MS NC OK SC TX US
All Pecans AL AZ AR CA FL GA KS LA MS NM NC OK SC TX US
7,000 22,800
1,500 1,900 1,100 85,000 4,000 3,500 52,000
800 3,000 1,800 35,000 219,400
6,000 2,300 2,600 35,000 5,000 18,000 1,500
400 60,000
900 55,000 186,700
13,000 22,800
3,800 1,900 3,700 120,000 5,000 22,000 5,000 52,000 1,200 63,000 2,700 90,000 406,100
10,000 14,500
650 3,400 1,200 65,000 3,500 2,500 35,000 1,400
200 1,200 22,000 160,550
5,000 250
2,100 15,000
550 14,500
1,000 200
2,300 400
8,000 49,300
15,000 14,500
900 3,400 3,300 80,000
550 18,000
3,500 35,000
1,600 2,500 1,600 30,000 209,850
10,000 20,000
1,950 3,400 1,200 80,000 4,000 4,000 60,000 2,700 2,000 2,500 45,000 236,750
4,000 650
2,500 15,000
2,600 12,000
2,000 500
13,000 1,000
25,000 78,250
14,000 20,000
2,600 3,400 3,700 95,000 2,600 16,000 6,000 60,000 3,200 15,000 3,500 70,000 315,000
1/ Budded, grafted, or topworked varieties.