- Collection:
- Georgia Government Publications
- Serial:
- Georgia farm report.
- Title:
- Georgia farm report, vol. 02, no. 21 (2002 November 15)
- Creator:
- Georgia. Department of Agriculture
- Contributor to Resource:
- United States. Department of Agriculture
United States. National Agricultural Statistics Service
United States. National Agricultural Statistics Service. Georgia Office - Publisher:
- Athens, Ga. : United States Department of Agriculture, National Agricultural Statistics Service, in cooperation with the Georgia Department of Agriculture, Georgia Field Office
- Date of Original:
- 2002-11-15
- Subject:
- Agricultural productivity--Georgia--Statistics
Crop yields--Georgia--Statistics - Location:
- United States, Georgia, 32.75042, -83.50018
- Medium:
- state government records
- Type:
- Text
- Format:
- application/pdf
- Description:
- Began in 1975?; ceased with vol. 10, no. 02 (Feb. 26, 2010).
"Agricultural statistician and Georgia Department of Agriculture."
Numbering began again with Vol. 11, no. 1 (Jan. 14, 2000).
Vols. for Aug. 31, 2005- issued by: USDA-NASS Georgia Field Office.
Description based on: Vol. 94, no, 1 (Jan. 4, 1994); title from caption.
Latest issue consulted: Vol. 10, no. 02 (Feb. 26, 2010). - External Identifiers:
- Call Number GA A400.C7 P1 F2 2002/21
- Metadata URL:
- https://dlg.galileo.usg.edu/id:dlg_ggpd_i-ga-ba400-pc7-bp1-bf2-b2002-s21-belec-p-btext
- Digital Object URL:
- https://dlg.galileo.usg.edu/do:dlg_ggpd_i-ga-ba400-pc7-bp1-bf2-b2002-s21-belec-p-btext
- Language:
- eng
- Holding Institution:
- University of Georgia. Map and Government Information Library
- Rights:
-

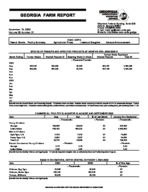
GEORGIA FARM REPORT
November 15, 2002 Volume 02-Number 21
Peanut Stocks Poultry Summary
Stephens Federal Building, Suite 320 Athens, Georgia 30601 Phone: (706)546-2236 E-mail: nass-ga@nass.usda.gov Website: http://www.nass.usda.gov/ga
HIGHLIGHTS
Agricultural Prices
Livestock Slaughter
Census Announcement
STOCKS OF PEANUTS AND SPECIFIED PRODUCTS AT MONTH'S END--2002-2003 1/
Month Ending Farmer Stocks Shelled Peanuts 2/ Roasting Stock (In Shell)
Farmer Stock Equivalent
Shelled Peanuts
Total 3/
--Thousand Pounds--
2002
Aug
447,016
520,396
45,055
692,127
1,184,198
Sep
582,400
381,290
30,764
507,116
1,120,280
Oct
Nov
Dec
2003
Jan
Feb
Mar
Apr
May
Jun
Jul
[Results from the Peanut Stocks and Processing Report]. 1/ Excludes stocks on farms. Includes stocks owned by or held for account of CCC in commercial storages. Farmer stock on net weight basis. 2/ Includes shelled edible grades, shelled oil stock, and shelled seed (untreated). 3/ Actual farmer stock, plus roasting stock, plus shelled peanuts x 1.33.
COMMERCIAL POULTRY SLAUGHTER 1/--AUGUST AND SEPTEMBER 2002
Item
Aug
Sep
% of Last Month
January thru September
--Thousands--
--Percent--
--Thousands--
Young Chickens
Georgia
109,843
99,324
90
927,582
United States
758,120
686,022
90
6,459,860
Mature Chickens
Light Type, U.S.
7,724
7,512
97
74,897
Heavy Type, U.S.
6,991
6,327
91
54,631
Total U.S.
14,715
13,839
94
129,528
Percent Condemned Young Chickens
--Percent--
--Percent--
Georgia
0.73
0.74
0.84
United States
0.88
0.87
1.00
[Results from the Monthly Chicken and Egg Report]. 1/ Federally inspected slaughter data as collected by Meat and Poultry Inspection Program.
EGGS IN INCUBATORS, UNITED STATES--OCTOBER 1, 2001-2002
Item
2001
2002
Chickens, Egg Type Chickens, Broiler Type Turkeys, All Breeds
31,868 615,142
29,903
--Thousands--
30,842 591,313
29,134
[Results from the Monthly Chicken and Egg Report].
% of Year Ago --Percent-97 96 97
USDA/NASS COOPERATING WITH THE GEORGIA DEPARTMENT OF AGRICULTURE
NUMBER OF LAYERS AND EGG PRODUCTION--SEPTEMBER 2001-2002
Number of Layers
Eggs per 100 Layers
Total Eggs Produced
2001
2002
2001
2002
2001
2002
--Thousands--
--Number--
--Millions--
GEORGIA
Hatching
9,395
9,257
1,820
1,847
171
171
Table
11,729
10,980
2,106
2,158
247
237
Total Georgia
21,124
20,237
1,979
2,016
418
408
30 STATES
Hatching
53,524
53,190
1,803
1,803
965
959
Table
260,799
262,623
2,161
2,181
5,637
5,727
Total 30 States
314,323
315,813
2,100
2,117
6,602
6,687 1/
UNITED STATES
Hatching
58,205
57,855
1,806
1,806
1,051
1,045
Table
276,815
279,296
2,165
2,184
5,993
6,099
Total U.S.
335,020
337,151
2,103
2,119
7,044
7,145 1/
[Results from the Monthly Chicken and Egg Report]. 1/ May not add due to rounding.
POULTRY HATCHING AND PLACEMENT--SEPTEMBER 2001-2002
January thru September
Item
2001
2002
% of year ago
2001
2002
% of year ago
--Thousands--
--Percent--
--Thousands--
--Percent--
Pullet Chicks Placed Domestic (U.S.) 1/
Broiler Type
6,647
6,691
101
60,989
63,069
103
Egg Type
219
259
118
2,431
2,309
95
Chicks Hatched - Broiler Type
Georgia
109,741
110,611
101
1,002,689
1,019,078
102
United States
738,355
741,140
100
6,786,723
6,910,645
102
Chicks Hatched- Egg Type
Georgia
2,158
2,248
104
19,105
19,830
104
United States
36,916
35,391
96
352,259
325,510
92
Turkeys Poults Placed
United States
22,414
22,670
101
22,414 2/
22,670 3/
101
[Results from the Monthly Chicken and Egg Report]. 1/ Domestic placements as reported by leading breeders includes expected pullet replacements from eggs sold during the preceding month at the rate of 125 pullet chicks per 30 dozen case of eggs. 2/ Turkey poults placed September 2001-August 2002. 3/ Turkey poults placed September 2002-August 2003.
COMMERCIAL RED MEAT PRODUCTION--UNITED STATES 1/, September 2001, 2002
January-September 2/
Kind
2001
2002
2002 as % of 2001
2001
2002
2002 as % of 2001
--Million Pounds--
--Percent--
--Million Pounds--
--Percent--
Beef
2,121
2,201
104
19,407
20,307
105
Veal
14.9
16.3
109
144.4
142.0
98
Pork
1,513
1,638
108
13,899
14,410
104
Lamb & Mutton
16.4
17.6
108
165.3
161.8
98
Total Red Meat
3,666
3,873
106
33,616
35,020
104
[Results form the U.S. Livestock Slaughter Release]. 1/ Based on packers dress weights and excludes farm slaughter. 2/ Accumulated totals and percentages based on unrounded data.
2
LIVESTOCK SLAUGHTER--UNITED STATES 1/, SEPTEMBER 2001-2002
Number Slaughtered
Average Live Weight
Total Live Weight
Species
2001
2002 2002 as % of 2001
2001
2002
2001
2002
--Thousand Head--
--Percent--
--Pounds--
--Thousand Pounds--
Cattle
2,808.1
2,864.8
102
1,240
1,264
3,482,194
3,619,859
Calves
78.8
88.8
113
314
303
24,712
26,936
Hogs
7,812.4
8,505.8
109
262
260
2,045,995
2,215,646
Sheep & Lambs
244.3
276.2
113
135
128
32,999
35,337
[Results form the U.S. Livestock Slaughter Release]. 1/ Includes slaughter under Federal Inspection and other commercial slaughter, excludes farm slaughter.
PRICES RECEIVED BY FARMERS--OCTOBER 15, 2002 WITH COMPARISONS
Georgia
United States
Commodity
Price per Unit
Corn
$/Bu
Cotton
$/Lb
Cottonseed
$/Ton
Hay, All, Baled 2/ $/Ton
Oats
$/Bu
Peanuts, In Shell 3/ $/Lb
Soybeans
$/Bu
Tobacco
$/Lb
Winter Wheat
$/Bu
Calves
$/Cwt
Beef Cattle 5/
$/Cwt
Cows 6/
$/Cwt
Steers & Heifers $/Cwt
Milk Cows 7/
$/Head
Hogs
$/Cwt
Oct 2001 -
43.30 69.00
21.2 4/ 1.915 89.30 48.20 36.00 70.80 -
Sep 2002 -
38.90 -
17.9 4/
1.885 -
82.80 46.00 34.50 68.30
-
Oct 15, 2002 -
41.40 1/ 79.00
18.1 4/ 1.880 83.00 46.10 34.20 68.10 -
Oct 2001 1.84 30.70 85.00 98.00 1.64 22.8 4.09 1.905 2.82 99.70 66.50 37.60 70.10
1,700.00 40.20
Sep 2002 2.47 35.20 95.00 95.50 1.80 17.8 5.39 1.815 4.14 92.00 64.80 34.90 68.00 26.70
Oct 15, 2002 2.36 36.50 1/
100.00 94.50 1.89 18.2 5.16 1.850 4.41 91.10 64.10 33.70 67.80
1,420.00 31.90
Barrows & Gilts $/Cwt
-
-
-
40.60
27.20
32.60
Sows
$/Cwt
-
-
-
33.10
15.10
19.80
All Milk 8/
$/Cwt
-
-
-
15.60
11.60
11.90 9/
Chickens
Excl. Broilers
/Lbs
8.0
8.2
8.1
-
-
-
Com'l Broilers 10/ /Lbs
-
41.0
30.0
28.0
Eggs, All 2/11/
/Doz
83.2
85.6
82.0
59.9
57.9
54.0
Table 2/
/Doz
38.6
35.7
33.0
43.1
39.0
34.8
Hatching
/Doz
150.0
150.0
150.0
-
-
-
Turkeys 2/10/
/Lbs
-
-
-
44.2
36.9
36.9
[Results from the monthly Prices Received by Farmers]. 1/ Based on sales during first half of the month. 2/ Mid month price. 3/ Includes additional loan peanuts at loan value. 4/ Price not published to avoid disclosure of individual firms. 5/ Cows, steers and heifers. 6/ Beef cows and cull dairy cows sold for slaughter. 7/ Animals sold for dairy herd replacement only. Prices published Jan., Apr., July, Oct. 8/ Before deduction for hauling. Includes quality, quantity, and other premiums. Excludes hauling subsidies. 9/ Preliminary. 10/ Live weight equivalent prices. 11/ Average of all eggs sold by farmers including hatching eggs and eggs sold at retail.
INDEX NUMBERS--UNITED STATES
2001
2002
Sep
Oct
Sep
Oct
UNITED STATES (1990-92= 100)
Prices Received
106
94
99
95
Prices Paid
124
123
125
123
Ratio 1/
85
76
79
76
[Results from the monthly Prices Received by Farmers]. 1/ Ratio of index of prices received by farmers to index of prices paid.
3
2002 CENSUS OF AGRICULTURE www.usda.gov/nass/
The 2002 Census of Agriculture will appear in your mailbox in late December. It provides official facts representing all U.S. producers and commodities.
Don't be left out when decisions are made about you and American agriculture. Take the time to fill out your report form and return it by February 3, 2003.
All the information you give is completely confidential by law.
You Make It Known -- Agriculture Counts!
United States Department of Agriculture
National Agricultural Statistics Service