- Collection:
- Georgia Government Publications
- Serial:
- Georgia crop reporting service.
- Title:
- Georgia crop reporting service [1985]
- Creator:
- Georgia. Department of Agriculture. Crop Reporting Service
- Contributor to Resource:
- Georgia. Department of Agriculture. Crop Reporting Service
- Publisher:
- Athens, GA : Georgia. Department of Agriculture. Crop Reporting Service
- Date of Original:
- 1985-12-27
- Subject:
- Georgia
- Location:
- United States, Georgia, 32.75042, -83.50018
- Medium:
- publications (documents)
- Type:
- Text
- Format:
- application/pdf
- Description:
- 1940/1941-1974.
Issued in various sections.
U.S. Dept. of Agriculture Agricultural Marketing Service, University of Georgia College of Agriculture, Georgia Agricultural Extension Service, cooperating.
Split into: Weekly hatchery; Georgia farm report; Farm labor; Monthly poultry summary; and: Livestock report, weekly hatchery. - External Identifiers:
- Call Number GA A400.C7 P1 C7 1985
- Metadata URL:
- https://dlg.galileo.usg.edu/id:dlg_ggpd_i-ga-ba400-pc7-bp1-bc7-b1985
- Digital Object URL:
- https://dlg.galileo.usg.edu/do:dlg_ggpd_i-ga-ba400-pc7-bp1-bc7-b1985
- Language:
- eng
- Holding Institution:
- University of Georgia. Map and Government Information Library
- Rights:
-

~A
~>tEO~ A4fCO.C7
FARM REPORT
J~nu~ry 17, 1985 GFR-85-Vol. 1
Received
APR 0 7 1985
DOC IV!i:::.t T ~ UGA LI!3R RIES
GEORGIA CROP REPORTING SERVICE
Stephens Federal Bldg. Suite 320 Athens, Georgia 30613 Phone: (404) 546-2236
HIGHLIGHTS
Hay Stocks Fruit & Nut Su-.ry Agricultura1 Prices Turkeys
G~ORGIA COTTO~ CROP SETS RECORD YIELD
I
Georgia's 1984 cotton crop avera~ed a phenominal 781 pounds per acre yield, setting a record which surpassed the ol~ 1982 record by 67 pounds per acre. The 19R4 yield was 314 pounds per acre higher than last year's 467 pound yield. Acres ; harvested, at 172,000 acres, were up 50 percenL from the 1983 harvested acres of t 115,000 . The increase in acreage and the . record yield teamed up to lift production to 280,000 bales, up 150 percent from the previous year's production of ii2,000 bales. This is the largest cotton crop for the SLate s1nce i 974. :rarvest :i ru: ' progress in 1984 was much slower than norma: as Rrowers took advanta~e of the ' extended period of clear weather to allow as many uolls as possible to mature. The clear weather also minimized harvesting losses thaL sometim~ makes significant cuts in yields.
' (See Cotton TaJ,le on Page 2.)
U.S. COTTON YIELD ALSO RECORD lUG!!
Yield per acre for colton tor the United States was a record high 610 pounds per acre in 1984. This compares with a yield of 508 pounds last year and the previous record high of 590 pounds set in 1982. Harvested area is estimated at 10.5 million ~cres, up 42 percent from 1983. Cotton production for the Nation is estimated at 13.3 million bales, 71 percent more than the 1983 production. The current estimate is i percent ies s than was forecasted as of December 1.
Production in the Southeastern States, at 1.02 million bales is over two and onehalf times more than the 1'.>83 production in those states. Ginning of a good quality, high yielding c rop is nearing completion.
Production in the Delta States is set at
3.83 million bales, up 94 perc ent fran;
last year and 2 percent mor e Lhan was
forecasted a month ago.
~et fields
continue to delay harvest completion and
further reduce the quality of cotton
remaining in the field.
The Bureau of Census reports 11,082,246 running bales ginned prior to January 1, 1985, compared with 7,2 0 9,016 bales !!,inned'to the sa:medate in i984 and 10,574,010 bales for th e 198 2 c rop.
Agricultural Statistician and Georgia Depart.ent of Agriculture
GFR-85-Vol. 1
f
--O-O-P-----------------------------.-C-O-T-T-O-N---------------------P-R-O-D-U-C-T-IO-N---1-/------
------------------------------------------------------------------------------ A'lD
STATE UPLAND
:----------:----i~;--:-------:--rNo--:---------:---------:----rNo--
1933 :
1184 : 1983 : 198~ :
1982 :
1983 :
1~84
1,000 ACRES
PQUN::JS
1 1 000 3ALES 21
ALA
215.0
3'J7.0
41)9
7-JS
450.0
133.0
451.0
AR !Z ~ RK CALIF FLA :iA
234.0 290.0 950.0
12.0 115.0
4D.O H5.0 1t410.0
16.5 172 .0
1,225 535 996 61J8
4 s7
1,2:?6 61.7
1 , 0 :J 1 794 791
1,095.0 534.0
3,073.0 19.6
235.0
725.0 323.0 1,971.0
15.2 112.0
1,090.0 600.0
2,920.0 27.3
290.0
UNS
LA
.4
5
240
238
1
.2
.3
410.0
645.0
6D
778
870.0
532.0 1,045.0
r-11 S S
675.0 1,040.0
61t0
752 1,750.0
9CO.O 1,650.0
'10
N=v N ME X N C OsKLcA
93..o0
47.0 59.0 3CO.O 69.0
162..o0
72.0 95.0 375.0 105.0
377
578
0
0
715
653
3 50
6J6
232
2 50
359
717
204.0
9
78.0 102.0 238.0 155.0
73.0
0
70.0 43.0 145.0 53.0
195.0
0
98.0 120.0 195.0 170.0
TENN
TEX
VuA s
AM=R-PIMA
215.0
325.0
3 37
502
339.0
151.0
340.0
3,550.0 .4
4 1 800.0 9
322 3 50
4~0 2,700.0 2,380.0 4,000.0
640
.4
3
1. 2
7,294.9 10,333.9
506
6 09 11,854.0 7,676.7 13,172.8
ARIZ
N ~EX
uTEXs
::OTTO N
29.3 11.1 22.3 62.7
47.5
768
80 8
9.8
693
539
19.3
69 9
6'36
76.6
7!5
746
65.9 10.0 22. 8 98.7
46.9 15.8 32.0 94.7
80.0 11.0 28.0 119.0
ALA
215.0
307.0
409
705
450 .0
1d3.0
451.0
ARIZ
313.3
470.5 1 1 133 1,183 1,160.9
771.9 1 1 160 .0
ARK
290.0
445.0
535
647
534.0
323.0
600.0
CALIF
rLA
950.0 1 1 400.0
12.0
15.5
996 1 1 001 3,073.0 1,971.0 2,920.0
608
794
19.6
15.2
27.3
GA
KA~S
115.0 .4
172.0
45 7
781
.5
240
233
235.0 .1
112.0 .2
280.0 .3
LA
~ISS ~0
410.0 675. 0
93.0
645.0 1,0 40.0
152.0
623
778
870 .0
640
752
1,7~0.0
377
578
204.0
532.0 900.0
73.0
1,045.0 1,650.0
195.0
NEV
.0
.0
0
0
.9
.0
.0
N MEX
58.1
31.8
709
640
88.0
95.8
109.0
N C
59.0
95.0
350
606
102.0
43 .0
120.0
DKLA
'
300.0
375.0
232
250
238.0
145.0
195.0
S C
69.0
1J 5.0
3S9
777
155.0
53.0
170.0
TreExNN
215. 0
325.0
337
502
339.0
151.0
340.0
3,572.3 4,819.3
324
4 01 2,122.8 2,412.0 4,02a.o
VA
.4
.9
350
6~0
.4
.3
1.2
-1-/-u-PR-sO--D-U-C-T-IO-N---G-I7-N,3-N-~4D-7-.5-AN-D--1-T0-J,-4-63E-0-.5-G-IN--N-E-a-5. -08-------61-0- ---1-1-,9--5-2-.7-----7-,7--7-1-.4----1-3-,2--9-1-.-8
Zl 480-La. NET WEI GHT BALES.
The Georgie Farm Report ( ISSN-0 744-7280 1 I s published s"'"l-rnonthly by the Georgie Crop Report lng Ser vi ce , Stephens Feaar e l Bu il d i ng, Athen s , Ga . }0613, Larry E. Snipes, St a tistici an In Ch arge . Second class POstage p.,ld a t .\t hens, GA. Subscription tee SI O per year except tree t o date cont r ibutors . Subs cr l otl o n l nt o r~NJtlon ~v a l lable trom : Georgi a CrOQ Reporting Ser vice, Stephens Federal Bu lld l nQ , Suite 320 Athens GA , 30613 Telephone : (404) 546-2236
2
GEORGIA PEi\CII VALUE DECLINES
u .S. PEACH VALCE UP 23 PERCENT
The value of Georgia 's 198 4 peach crop totaled $19.9 million, down 14 per~Pnt
from the record value of $23.1 million set in 1983. The 1984 AverA~e price received by producers, at 14.8 cents per
pound, dropped 10.3 cents per pound from
1983, a drop in price of 41 percent.
Utilized production, at 134 million pounds, was up 42 million pounds, or 46 percent, from the 1983 crop.
Value of utilized nrodu c tion at Sll/\.9
million was 23 percent above 1983.
Utilized peach production at 2.4S hillion
pounds was 40 percent above the previous
year's utilized total and 17 percPnt
above
1982.
Excluding California
Clingstone peaches, U.S. utilized peach
production totaled 1.49 billion pounds,
up 31 percent from 1983 and 28 percent
above !982.
.\ l a. Ga . ~ .1.
S.C. Othet States Ca 1 it .
ClinP,stone
c.s.
Total
Production
1981
!984
--'!ill ion
1-'+ . 8
:?.2.1.1
10() . 0
15 0 .1)
i (j 5 ( 1
)1.1 . 0
94.0
135.0
95.0
480.0
764.3
814.8
- --?E-.\-C-i-F.S
! : tll ~::P.Cl
Production
!9/D
1984
Pounds--
1<+.0
2.2.0
92.0
13-+.0
lf)O . 0
50 .1)
94.0
RO.O
85. 1)
.:.oo.o
754.3
79) ...
Price
pP.r
Pound
191\l
198-+
Cen::s
J <).fo
l .;. .. 4
:! 5. I
1 -+.8
:?.5.'+
:!8.6
16.8
19.3
20. 1
!3 ..:.
16.:)
14. 5
683.0 855.3
1,042.0 2 643.8
619.0
966. 0
753.8 2 452.4
9.0 14.8
10 .0 13.0
Value or
Utili zed
Produ.: t 1 on
1<)81
1984
1 ,1)1)1) Dollars
~,:~.::.
~~ , ! 68
23,083
19,88)
:?.5,411
1.:.,310
15,83.:.
16,-+ 0:?.
16 , ! 15
53, .. 64
1:?.0,904
115,03 3
5),710 259 8 01
96,600 318,862
GEORGIA GRAPE PRODUCTION UP
u.S. GRAPE PRODUCTION DOWN 5 PERCENT
The State's 1984 grape crop totaled 2,700 tons, an 8 percent increase from 1983. Of that total production, 2,600 tons were utili=-:ed. i\n increase of $48 per ton
along with the 13 percent increase in utilized production g<>ve a 23 oercent increase in value of utilized production at $1.5 million.
Utilized production of grapes i n the U.S. totaled 5.09 million tons in 1984, down 5 percent from 1983 and down 13 percent
from 1982. Value of utilized production for 1984, at $837.96 million, is 21 percent below 1983 and 38 percent below 1982.
StatP.
Ariz. Ark. Calif.
c;il.
Mich.
~o.
:-\.Y.
~.c.
Ohio
ra.
S.C. Wnsh.
t: . s.
\.Ri\PF.S
Total
Utili zed
Production
Production
1981
1984
1983
1984
---1 ,000 Tons---
14.6
14.0
14.6
14.0
iO.O
9.0
10.0
9.0
4,919.0 4,595.0 4,775.0 4,582.0
2.5
2.7
2.3
2.6
60.0
49.0
60.0
49.0
3.6
3.1
3.6
3. 1
191.0
198.0
191.0
188.5
3.0
5 .9
3.0
4 .9
11.0
11.2
11.0
11.2
62.)
60.0
62.:1
59.5
1.5
2.5
1.5
2 . 'i
227.0
168.5
22~.7
168.~
5 505.7 5 118.9 5 360.2 5 094.8
3
PriFe
eer ton
1981
1984
nollars
1,050.00 1,310.00
252.00
180.00
199.00
161.00
534.00
582.00
194.00
166.00
349.00
323.00
199.00
180.00
324.00
341.00
197.00
215.00
170.00
143.00
303.00
339.00
152.00
124.00
199.00
164.00
Value of
t.:tilized Production
1983
1984
1,000 Dollars
15,330
18,340
2,520
1. 616
947,894
739,212
1,229
1 512
11.662
8,131
1. 258
1,002
38,006
33,843
973
1. 670
2.168
2,404
10,646
8,527
455
848
34,252
20,853
066.393
837.958
GEORGIA PR ICES RECEIV E~
/\vera~e prices re cel VPrl by GPorP,ta farmers at mid-December for most c rops were down and most livestock wert up trom the previous month. Lower pri ces for wheaL, co rn, soybeans, sows, cows , other chickens, broilers and commercial eggs were partially offset by higher prices for cottonseed, pean11ts, sweet potatoes, barrows and gilts, steers and hPifers, calves and milk. The Georgia Prices Received All Co mmo <ii ty Inciex i or 0P c cmber was 121 percent of the 1977 average, point below last monLh anrl ill points below a year ago.
GFR-85-Vo I. 1 U . S. PRICES RF.CF.JVED JNDF.X DOWN 3 POINTS
The D< c~mbcr .'\11 Farm Product s Tnllex of
Prices Rt,c eiv.,ri by Farrn<'rs de creast'd 3
points (2.2 percent) from November to 134
percent of i Ls .January-necemiwr l<J7 7
average.
!.ower prices for oranp,es,
cotton, soybeans, broilers and milk were
partially off set by higher prices for
hogs, cattle, hay and t urk.-ys. Tht' Index
was 6 points ( 4. 1 percen t ) below a year
ar,o.
- - - - ----'-?-'-R'-'T'-'Cc.:E.::cS_,R-'-E=r'CEIVF.D__RY FAR!1E~ DECEM flF.R 1 5, I 984 WITH COMP /\RJS O:\S
Pri c ~
l.eo r gia
United States
;>er
Dec..
Nov.
Dec. I 5,
n~r..
Nov.
Dec. 15,
C:ommoditv
t.:ni t
198 3
19 84
191\ 4
1983
1984
1984
w'i !'ltPr WhPat
~- I ?.11 .
] .52
2.98
2. 90
1.43
3 .39
3.13
Oa ts
S/ Fiu.
I. 73
!. 71
1 .69
\.o r!'l
5 /Bu.
1.61\
2.97
2.94
3. 15
2.55
2.52
Cottcon
Ct ./ Lb. 67.8
61.5
1/61. 5
66.2
61.8
1/57.0
'-' 't to!'lset>rl 2/
S /Tnn
187 . 0 0
1\7. 00
1\9.00
104.00
101.00
Tob:tcco
Ct./Lb.
3/-
17 6. 1
188.0 3/185.0
3 /nu.
7 .60
6 . 04
;. 79
7.75
6.02
5.80
Peanuts
Ct./Lb. 20.5
20.1
1/21.8
25.4
25.4
1/24.4
t; wePtpotatoE's
3 /Cwt.
17.00
2/15. 40
17.30
14.30 2/12.80
15.60
i\ll Hay, baled 2/
S /Ton .
78 . 20
7 3.00
76 .00
S/Cwt .
42 .f>()
46.10
49.00
44.20
47.00
48 . 40
Sows nar r ows & l.ilts
$/C"' t . ';, fCwt.
31.70 .. 1.90
18.30 47.50
17.00 50.60
36.30 45 .60
40.60 48.00
39.20 49.80
Rt>cf Ca ttle 4/
S/Cwt.
39.50
37 .50
39.70
54.50
54.90
55.40
Co ws ~/
StPe rs & Heifers
Ca l vrs
S/Cw t. S/Cwt. 5 /Cwt.
33. ') 0 49.70 54 . 30
12.90 46.60 47 .10
12.30 49.80 49.80
33.80 60.90 60.60
11.90 61.20 59.40
33.80 62 .40 59.40
i\11 "!ilk
3/Cwt.
14.90
15.20
3/1 5. 30
13.70
14.30 3/14.10
T11rkrys 2/
\.t. /T.h.
45.8
57.3
60.5
ChickE-ns, ExcludinR
P. ro iltrs
C:t ./l.h. 30.0
2 /23.0
17.0
~om'l Rroil e rs 6 / Fv~s. All 7/
Ct./Lb. 33.5 ~ t./Do z 100.0
28.5 2/70.7
3/27.0 62.3
33.7 83.4
10.8 2/61.3
3/28 .5 51\.4
T,,!,J,.
Ct./Doz 89.3
2/56 . 8
53.0
79.3
2/54.4
52.8
- ~~~ c_ll_i~~~
~L. /Do?.. 140.0
2/120 .0
120.0
l F i st half of month. 2/ Mill-month pr ice. 3/ F.ntire month. 4/ "Cows" and " s teers and
;,,.if rs" c- o mhinP.d wi th al low~-tn c- P wherP. nP. CP. ss a ry for slauehtf'r hu ll s. ':>/ In r. lllrif's dairy
co ws sold for slnliP,hter . 6/ Liveweip,ht C<JuivalP.nt pric e for Geo rgia. 71 Average of all ro.es sold hy farm<'rs inclucli nr. hatchir'!~ Pf,es sold At retail.
4
tl.S. PRI CES Pi\ID HJnFX !lNCIIi\NGF.O
The Index of P r i r. es Paid by Farmers for
CommodiliPs ;;nd Serv i ces,
Int~rPst,
Taxes, and Farm Wa~e R;;tes for D~ ce mber
was i 64 percen t of i Ls 1977 bast-. Tht-
Index was unchan~ed for th~ se con d
cons ec utive month. De c lin~s in the feed,
fuels and fertilizer indexes w ~ re o ffset
by the increase in the feeder liv rsto~ k
component. Compa red with a year earl ie r,
t h~ in dex WiaS up i point (0.6 1Wr<e nt).
CONSUMFR PRICE INDEX
The :-<ovemht-r unadjusted consumer price
index for all urban consumers (CPI-U) was
unchanged at 315.3 (1967=100) from a
month earlier. However, the index was
4.0 percent higher than in November 1983.
On a seasonally adjusted basis, the CPI-U
rose 0.2 percent from October. The other
goods and services index, along with the
entertainment
index inc reased
0.5
percent. The medical care and housing
indexes increased 0.4 percent and 0.3
percent, respectively. The food and
beverages index rose 0.2 percent. The
transportation index showed the smallest
increase at 0.1 percent.
The only
category to show a decrease from October
was the apparel and upkeep index, down
0.1 percent.
P~ICF.S PAID RY FARMF.RS
1984 WITII COMPARISONS
Price
United States
pPr
nee. 15, Nov. IS, Dec. 15,: Dec. 15, Nov. 15, Dec. 1S ,
Commodit v
Unit
1983
1984
1984
1983
1984
1984
Dairy rP Prl 16 7.
S/Ton
205.00
175.00
17S.OO
205.00
177.00
176.00
Dairy Feed 18 1.
S/Ton 215.00
176.00
176.00
2 19.00
182.00
178.00
Hairy Conct. 327.
S/Ton 285.00
215.00
215.00
297.00
245.00
238.00
!log Feed 147.-187. Ho~ ConcL. 38 7.-427.
S/Cwt. S / C wt .
12.50 17.00
10.50
13. so
10.40 13.00
11.90 16.80
9.93 13.30
9.89 13.10
Beef Cattle Gonet.
127.-361.
S/Cwl.
13.00
12.50
12.50
13.40
11.30
11.20
Cottonseed Meal 411. S/Cwt.
16.00
13.00
12.50
16.00
13.50
12.90
Soyu.. an M"a l 44 7.
S/ C:wt..
15.00
12.00
12.00
15.60
11 . 60
11.30
Bran
S/Cwt.
12 . 00
11.50
11.50
10.60
9.98
9 . 90
~irldlin~s
S/Cwt.
JO.SO
10.50
10.50
10.10
9.51
9.34
Corn Meal
S/Cwt.
10 . 00
9.20
10 . 00
8.74
7.88
7.74
1\roilPr Grower
S/Ton
215.00
250.00
245.00
240.00
220.00
216 . 00
L11ylng FeP.d
S/Ton
215.00
183.00
164.DO
219.00
190.00
187 . 00
Chick St;nter
S/Ton 245.00
225.00
210.00
244.00
219.00
211.00
Broi ler-Feed Ratio 1/ Lbs.
3. 1
2.3
2.2
2.8
2.8
2.6
Ho~-Corn Rat i o 2/
Bu.
11.6
15.5
16.7
14.0
18.4
19.2
Milk-Feed Ratio 3/
Lbs.
1. 4 5
1. 74
1.75
1. 34
1.62
1.60
F.gg-Feed Ratio 4/
r.t... ...
9 .)
7.7
7.6
7.6
6.5
6.2
II Pounds of broiler grower equal i n value to 1 lb. broiler live weight. 2/ Bushels of corn
Pq ual in value to 100 lbH. of ho~ live weight. 3/ rounds of 16% dairy feed equal in value to
1 lb. whole milk. 4/ Pounds of laying feed equal in value to 1 doz. eggs.
1977al00
::-<DEX :-n;:-tRERS--<.F.ORGT.<\ i\ND t: ~ITF.D STATES
Novemoer 1983
De ce moer 1983
November 1984
December 198 ..
GI"Orl~ia
Prices Rece ived
All Commodities
136
139
122*
Crops
140
134
120*
Livestock Produc ts
13 2
143
12 4
United States
Prices Re c:eiverl
135
140
137
Pr ic es Pa id 1/
162
163
164
Ratio 2/
1\3
116
1\ 4
1/~ld-month 1ndex 1nclud1ng 1nterest, taxe s and farm wa~e rates. 2/ Ratlo of
Pri ce s Recl"lved to JnciPX of Pr ices Paid, Interest, Taxes and Farm Wage Rates.
121 122 12 0
134
164
112
In*d
ex of Revis
ed.
5
\. ~CRGIA PECAN VALUE liP
I : .s . PEC.~N VALt.:E DOWN
GFR-85-Vo I 1
The average price received for Geor~i~
~:>eenctasns
~er
at 55.2 pound
cents per less than
pounn, 1983.
was 7.7 However,
the 15 percent increase in product. ion
more than of f set the price decline and
the overall value of the 1984 c ron ros~ to S63.5 million, a 1 percent incr~ase.
The value of the U.S. pecan crop
decreased 10 percent from 19A3 to S143.1
million despite a 3.9 cents per poun~
increase in the average price.
The
decrease was due to a 15 percent decrease
in production . U.S. production in 1984
totaled 228 .7 million pounds.
St.il.te
.-'>.la.
_A,rk.
c.a . Ga. 7.. a . Miss. N. :'-lex.
~.c. O kla ~
s .c .
T~x.
c. s.
lJtilizecJ : 983
1. 000 24,000
2,500 3,400 100 ,000 22,000 8,00 0 29,000 1,600 8, 000 1,500 70 ,000 270 000
Prol.iuc tior. : 984
Pounds 13 , 000 1, BOO 5,000
115,000 8,000 5,000
24,000 2,900
24,000 5,000
25,000 228 700
?ECANS
Price oer Pound
:98 "\
: 98-<
Cents
47 .9
66.0
74 .5
78.0
57.0
57.0
62.9
55.2
4 2.5
52.5
5;. 5
72.9
73.0
80.0
57.8
62.0
.:.8 .4
'-B.A
73.3
75.0
~6 . 0
'-!0 .0
5P. . 7
62.6
Value of Utilized Production
!983
!984
1,000 Dollars
!1,500
8,560
1. 863
1. 407
I, 939
2,849
62,850
63,500
9,360
4,200
4,600
3,645
21,170 9 ?~")
19,200 1,790
3,A70
11,700
1,100
3,750
39,212
22,500
!58 389
143 101
GEORGI/\ APPLES UP 137 PERCENT
t.: ti1ized produ c tion of Georgia apples in 1984 was 45.0 :r.; 11 ion ,.ouruis, up 137 !'<:rc:ent from the freezP.-damaePd 1983 crop ot 19.0 million pounds. Of the 45.0 million pounds llti li7.eri , :.!8.(1 million were from nort.h~rn orchards and 17.0 million from the south. The total crop was valued at $3.38 :":li 11 ion, up l 0:; perce nL from the value of the 1983 crop. Price per pound durine 1984 avernged 7.1 cents per pound in Lhc north. In the south it was 8.2 cents, and statewide it was 7.5 cents per pound.
Sta te
: a 1 if.
Geo r~ia
'<o rth South ~o tal
~ ich.
'\.Y. :\ . <:.
Prt .
S. C.
IJ;u; h
Ot her c;ti'l tes
;: . s .
Total
Prod1c tion
: 981
p~~4
- -Mtllion
460. 0
470.0
.'\PPLF.S
Pr1ce
Ct i l i z e d
per
Production
Pound
!9~'3
!11!!4
!98'3
Pounds - --
Cents
460.0
470 . 0
11.8
!984
14 .8
10 .0 10.0
20.0 750.0 1,100 .(1 41 5 .f)
">00. 0
18. 0
3,055.0
31.0 19.0
50.0 771).0
99(1 . 0 361) .I) 5">0.0
50.0
2,900.0
10.0 9.0
l'LO 750.0 1,1 0().0 4 15. 0
)()1). 0
16. 0 3,0'i5.0
28.0 17.0 45.0 770.0
990.0 360 . 0 5)0.0
49 .0 2,90 0.0
11.6 5.4
8.6 7.7
9.8 6.3 8.5
8. 1
11. 4
7.1 8.2 7.5
9.1
9.0 6. 5 8.7
11.6
12.7
2,055.0 813 73. 0
2 , 01\2.0 A1222. 0
2,0 37 . 4 8,352. 4
2,074.0 8 208.0
6
11.8 10.5
13 . 7 11. 7
Value of
Utilized
Production
I98'J
1,000
O~lla!r9s84
54,218
69,700
1,158 485
1. 643 57,540 107,430 26. 195 4 2,425
1,288 348,790
1. 985 1. 390 3,375
69,860
89,010 23 , 398 47,620
5,686
367,890
239,563 283,257 879 092 959 796
GEORGI A HAY STOCKS UP
Hav stocks r e mai ning on Georgia farms on .lilnua rv 1 are Pstimated at 871,000 tons . This ~as an in c rease of 36 perce nt over ::he hav stocks in the Sl a t e on JanuAry i, 198 4 , " which to t a l ed 64 0 , 000 t o n s. The l\7! , non tons c u rr enllv on hAnd wP. rc> sliRhtl v lowe r than the hay tonn age on hand on-January i, 1983.
lARGER U.S. HAY STOCK S
7o tal h av sto ~ ks on far~s in t he U. S . on Janua ry 1, 1985, are e stima ted at 100.6 mil l ion tons, or 13 per c ent mor e than the 89.3 mil lion tons on hand at the same ti mP. }a!=;l yP nr. nttt .. thi~ ye.ar 1 s .Tnnu a ry 1 sto c ks were 3 per ce nt, or 3.4 million tons, i>e)o w Lhf' holciings Lwo yea r s ago on Junuary i .
---S-T-A-T-E------:----------------------------------H--AJAY--N----S--T1O----C--K--3----Q--N----F--A--R~--S--------------------------------1>--1A--Y----1-------------------------------------1-98-3-----------1-9-3-4-------1-,0-0-U0-8-5-T-O-N-S-------1-9-9-3---- --- ---1-9-8-4----
AaLAr z
ARK CALIF COLO
CONN
:>EL FLA GA
IDf<HO
ILL INJ IO WA !'\AlliS
K.Y
LA MAINE
s "10
:o~;. 3
MI C~
!>II "'N
MISS
MO
MONT
J E 3 R
NEV
N H
~ J
N N
"y'EX
ill ~
'J J Ail.
JH!O
~KLA
JR:::G
?A
~ r
s 3 )(.I(
TE ~JN
TE X
U T ~H
VT
VA
..WASH VA
>li S
WYJ
902
137
1,229
1,60~
z,oo1
131
25
534
875
2' 712 2,531
1,5:!9
6,106
<+,269
2 , 949
514
3 00
417
1 'j j
- 'i
5,
2c~: -0?-6"
1,150
5, 21 E
1.,<+24
5, B1;
741
1 21
175
5 66
3,645
465
4,225
21 33S 2,567
1,15 ~
3,243
12
343
7' J 0 1 1,7 3 J
; ' ) 31
1' 32 3
56 9
~ ,3 4 2
1. 3 37
706
1.310
1' 300
ne 116 776 1,323 2,048 122
25 400 640 2,850 1,737 1,135 3 t 602 3,19 8 1t913 389 281 306
., 1 :l8
_ , .c,:..,,..,_~;
4,906 999
4,()26 3 '6 39 4, &3 6
751 1 23 1 56 350 2,959 376 3,672 2,076 2 ,527 2' 135 2 , e18
1 5 2 59 7,258 1 ' .. : 1 4 tll 7 1, 0'39 574 1. c? 8 1 t 52 8 6 57 8,652 1,5 63
ns
83 1,013 l,4llt 1,953
135 29
341 371 3,035 3,02!! 1,617 5t 33s 3 t 97a 2,3 7 6 473 287 399 19 3 2 y J ~ .. 5' 10 g 94:'
;. ' 81 7 3. 1 0 J
5, 0 4~
5 C 5 133 181 432 3,005 461 3 ,887 2,421 2,38 :! 2 , 02 3 3 ,'+55
1 5 36v 5. 245 1' 9 01 3,3 57 1 t 231 61J 1 ' t. 7 1 1, .. 9J 79) 1), 216 1 64 5
333 19
192 337 508
40 6
107 3 00 4 89 6 87 357 1,507 90 2 618
70 115 101
43 i 82 1,405 205 1,16 6 1 ,376 l' 6 50 1! 5
36 36 11+ 8 89e 10 0
1 '6 21 425 527 257 E23 5 53
2' 8 9 2 416
2,012 236 177 2S S 262 1 23
2' 9 33 333
73 12 85 369 435 35
4 52 70 393 302 1 81 7 69 640 262 23 72 74 56 62 ~ 1,497 135 325 76 a 1,14 3 195
3u 2
70 740 103 1 . 16 4 '+22
52:J
2 81 554
5 21 2' 50 5 363 1' 273 206 157
1 8 s
237
19J
2,196 285
-u--s------------1-0-3-,1-9-:-,--------;-9-,-2-~0--------1-0-')-, -5-9-7--------2-8-,1--1-8--------2-0-,-!4-3-----
; ;; RKEY S: :\1 ::'-IBF.R R !SED I~ 191'.1 A:\ D 19P. "
A:\ D :\ C:'-1B R I~TE~DED TO BE RAISE C
: :\ i 98) I
!98 J
~umber
Number as ;~ of
State
i 983
i984
1985 2/
19114
1,000 Head
Percent
.'\rk .
: 2. 3)0 i '<,31i6 16,0110
111
Cali f. 2 0 ;2 01) 19,73 0 20,1 1)1)
102
\.ol o.
... ,.:.)j
1/
3/
Ga.
2,266 2,582
2,610
10:
I nd.
0 , i i 0 6,110
6,68A
i t:6
Io10a
6, 7 I 0 5,800
5,900
102
"' i nn. 27,000 28,50() 28,i00
i 01
Mo.
13,000 12,000 12,000
100
:-/.C.
~9 ,1)1) 30,4 00 34,3 00
! l 3
1\.Dak.
760
8 70
870
l OG
Ohio
2,400 2,1100
3,000
107
Okla.
1,600
3/
3/
Oreg.
810
925
1,200
130
Pa.
6,800 6,100
6,220
102
S.C.
2,159 2,194
2,300
10 5
S.Dak. 1,528 1,522
l. 600
105
Tex.
5,400
3/
3/
Utah
2,328 2,387
2,497
105
Va.
i l ,388 10,795 12, 0 9()
! 12
\./is.
7 . j 15 61 120
5,95 0
97
Other
Sts. 3/
ii,700 11,850
iui
TOTAL 164,809 165, !0 1 173,875
lt1~
: / 1980 83 Re v isions nuo1isned in Ep,gs,
Chickens and Turkeys,
Aug. 198...
areakdown bv breeds discontinued in 1984. 2/Intention~ to raise turi<.evs made in 2 0
states onlv. 3/ Combined to avoid dis-
closure of individual operations.
-:-:.:RKZY BREEDER IIE:\S: ALL BREEDS SELECTED
STATES, DECEMBER 1, 1982-8~
1984 as
State
1982
1983
1984 4 1983
1,000 Head--
Calif.
525
420
500
119
Ga.
') 8
60
34
'i7
Mich.
45
38
38
100
~inn.
523
443
447
101
Mo.
290
300
320
107
c-~.c.
750
700
7 40
106
Pa.
43
113
'i1
45
Va.
i82
162
138
R'i
Other
Sts.1/
1,013
919
891
97
TOTAL
3,429 3,155 3. 159
100
1/ ARK,COLO,ILL,IOWA,KANS,NEBR,NY,OIIIO,
OKLA,OREG,SC,S DAK,TEX,UTAl!,\.i VA and WIS
c ombined to a void dis c losing individual
o perat i ons.
8
r q.oot-1
l
q~
f.-OR
-CIA J
FARM REPORT
February 5, 1985 GFR-85-Volume 2
Received
APR 0 7 1985
DOC M.:. T~
UGA UBR RIES
GEORGIA CROP REPORTING SERVICE
Stephens Federal Bldg. Suite 320 Athens, Georgia 30613 Phone : (404) 546-2236
HIGBLIGID'S Annual Crop Su~ Livestock Slau8bter Monthly Poultry
IU.llt Prochction Cattle-on-Feed Cold Storaae
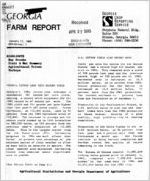
VALUE OF GEORGIA'S 1984 CROPS CLIMBED 13 PERCENT
The aggregate value of Georgia's crops harvested in 1984, increased 13 percent to 5 1.58 billion, despite weaker prices for most crops and sharp declines in the total value of soybeans and tobacco. However, the lower prices were more than offset by inc reases in product ion of most crops, particularly the 1984 peanut crop. The sum of thP. values of the crops currently in the Federal estimating program increased $176.3 million from last year's $1.40 bill i on aggregate value. The 1984 total value was $71.5 million more than the $1.51 billion value of the pre-PIK 1982 crop.
The value of production estimates do not address marketings, nor profit or loss, but represent the overall value of the crops produced. Estimates on cash receipts, production c osts and net income for 1984 will be available at a later date.
PEANUTS SET TIIRF.E RECORDS
SOYBEA~ VALUE DIPS 23 PERCENT
The 1984 peanut crop almost rewrote the re c ord book hy estahlishin~ three new highs. They were highest yield, at 3,400 pounds per acre; largest production, at 2.(6 billion pounds; and, greatest value, at $~21 million. The value also enabled peanuts to continue as the crop of top value in the State, accountin~ for 33.0 percent of the total value of all major crops. Production in 1984 was up a phenomenal 38 percent from last year's crop and surpassed the previous record production in 1975 by 25 percent. The average price excluding possible GFA rebates was the same as the previous . year's 24.1 cents per pound.
The total value of Georgia's soybean crop dropped 23 percent in 1984 . to $244.0 million, but still accounted for 15.4 percent of the total value of Georgia's ma j or crops. There was no change from 1983 in the number of acres harvested but a very dry late summer and fall pulled the yield down to 20 bushels per acre. This, however, reduced production only 5 percent since 1983 was also a dry year. The big difference was a 20 percent drop in the average price received for the 1984 crop. The price dropped $1.49 per bushel to $6.10.
Continued Page 4
Agrf.cu1tural Statisticf.an and Georgf.a Depart:.ent of Agrioalture
GEORG I.\ !1.:1 ~1EAT P!Will"CT !t ):\
U.S. RED ~F.i\T PRODUCTION
'GFR-85-Vo I. 2
Geor~ia red meat production totaled 30
million pounds ciurirH~ !"l~c ember 1984, down
2l percent from De c ember 1983.
The
Januarv-Decembcr l<J8.:t red meat ~rodu r. tion
tota led 418.8 million pounds, 10 percent
less than the comparable period of 1983.
Cattle slaughtered by commercial plants in Geor~ia during December totaled 16,500 head, an increase of 1,000 from the p re v iou s year. Calves slau~htered in December totaled 1,600 head, a decrease of 300 head from the previous year.
There were 138,500 hogs slaughtered in c omm~r cia l plants across the State durin~ December 1984. This amounted to 48,600 head less than December last vear.
Red meat production for the United States
totaled 3.12 billion pounds, down 8 per-
cent from December 1983.
Production
durin~ 1984 totaled 39.0 billion pounds,
virtually unchanged from last year. Beef producti~n, at 1.83 billion pounds, was
down 7 percent. Head kill was 2.94
million, down 7 percent, while the
average live weight increased 3 pounds to
1,073. Veal production, at 39 million
pounds, was up 5 percent. Calf slaughter
of 268 thousanc1 head - was down 6 percent,
however,
the average live weight
i ncreasec1 16 pounds to 243.
Pork
production, totaled 1.22 billion pounds,
down 10 percent. The 6.99 million head
killed declined 11 percent, while the
averaRe live wei~ht increased 2 pounds to
245. Lamb and mutton, at 30 million
pounds, was unchanged. Slaup,hter totaled
530 thousand head, down 4 percent.
Speci es
Geor~ia
Catt e Calves !logs Sheep & Lambs
GEORGIA AND UNITED STATES LIVESTOCK SLI\UGI!TER 1/
Number Slaughtered
Average
1984
Jan.-Dec.
Live Weight
December
as 7. of '84 as 7. of
December
1983
1984
1983
1983
1983
1984
I ,000 Head
Percent
Percent
Pounds
15. 5
16.5
106
1.9
1.6
84
187.1
138.5
74
I 12
910
885
88
349
365
86
233
229
133
Total
Live Weight
December
1983
1984
1,000 Pounds
14.110 667
43,679
14,593 576
31.693
93
103
94
107
89
97
96
102
Inspection an
1,070 227 243 1 1 1 commercia
3,156,985 65,23:!
1,71~,759
60 383
_ _ _ ___fQ~F.:RC:I.'\L RF.D ME/\1' AND LARD PRODUCTION: UNITED STATES WITH COMPARISONS 1/
Decemoer
1984 as 7.
Jan.-Dec. 2/
1984 as t.
Ki nd
1983
!984
of 1983
1983
1984
of 1983
Million Pounos
Percent
Mi 11 ion Pounds
Percent
Reef
1. 965
I , 829
9]
23,058
23,410
102
Veal
37
39
105
429
477
1 11
Pork
1. 350
I , 219
90
15,120
14,7111
97
L;tmh & Mutton
30
30
100
368
372
101
Totn l Red Mcnt
3,383
3, 1 I 7
92
38,974
38,977
100
l.nru 3/
87
78
90
972
T/P.as ~ u on pac kPrs dress we1~hls anc:l ~xcludcs farm slaughter.
v 940
97
Accumulated totals
bas ed on unroundcd data. 3/ Preliminary lard production includes rendered pork fat.
The Georgia For Report (ISSN-Q744-7280) Is published s . . l-.anthly by the Geor~la Crap Reporting Service. Seohens Federal Building, Atl>ens, Ga. 3061}, larry E. Snipes, Statistician In Chal"'ga. Second c loss postoga paid at Atl>ens, GA. Subscription lea SIO ~r - yaar . .capt tree to date contrIbutors. Subscr 1ot Ion I ntor.,.t ion avallab Ia trao : Georgie Crop ~ tportl ng Serv Ica, St81)hens Faclerol BulldlnQ, Suite }20 At hens GA. }061} Tal81)hone: (4041 '46-22}6.
2
GEORGIA BROILER 1!1\TCH UP 5 PERCE:-.IT
The [)ecember hatch of broi ler-tvpt c!11C.ks in Georgia, at 56.8 million wa s j percent :nore than that ror DecembP.r :983. The 667 million broiler-type chicks hat ched January-De cember was '< percenL :nore than the same period last year.
C . S. UIWI LER J!,\ TCII L:P 5 PERCE!':T
~ationallv the December 198~ hat c h of broiler-type chicKs, at 39) million. was 5 percent more than December 1983. The 4,593 million hatched durin~?, .liirllli'lryDecember was 3 percent above the same period last year.
;; of
Item
Dec.
:-iov.
Dec.
l'J8-]- - - - - -:9--8-4
(98.:+
--Thousands--
vear
;H~O
Jan. tht-u Dec.
vear
i 983
198,_4;___ __:~_ _ _
--Thousands--
Pullet Chicks Plac~c
Domestic (U.S. ) 1/ Broiler Type Egg Type
3,590 228
2,943 203
3,731 104
171
7)
38,068 3,307
39,586
104
3,466
105
Chicks Hatched
Broi ler Type Georgia unite<.! States
:,.:. . 344
50,816
56,813 i05
643,229
666,706
104
374,881 356,59 ..
394. 64 f) 105 4,446,999 4,593,346
103
E~g Type Georgia United States
:!,618 34,351
i,569 30, 062
1 , 30 I
50
26,995
79
24,656 406,935
38.069
1 5 '
456. 105
I 12
T- -u r--k e v-s
Poults Placed
u.s.
i::?. 476
il 757
12,162
97
2/40.733
2/43,453
10 7
1/ Reported by leading breeders, includes expected pullet re placements irom eggs
sold during the precedinP, month at the rate of 125 pull e t chicks per 30 dozen case
of eggs. 2/Turkey poults placed Sept. 198 4-Dec. 1984.
--- - -- ---------_:"!__!:!~'1ER_ _9__f__!~~}'ERS 1\ND _Y-GG PROT!!.:!_CT1Q.:'!L.J?F.c;F:MBER 1984
No. Layers on
Eggs per 100
Total Eggs Produced
_ _ _ _ _! : : l a n d - D e c .
LRv~rs-Dec.
During Dec.
1983
1984
1983
1984
1983
1984
Thousands
~:..1mber
~ill ions
Georgi<!
llntchinl:',
4,803
'),400
1, 888
1,900
91
103
Other
13,906
13,874
2,133
2,207
297
306
Total Geor~jia
18,709
i9,274
2,074
2,122
388
409
Total U.S.
277,764
286,284
2_!_0 7 8_ _ _ __1 J_..:.1.;:.0_:_9_ __.:5 77:.._:3=----~ 0 3 7
~----------------------E~-G~G~S~I~N~I~N~C~U~B~A~T~O~R~S~~J~A~N~U'~A~R.~Y~I~9~8~U~;I~T~E~.D~S~T~A~T~E~S~---------------
Item
1984
1985
;: of Yea r APo
--Thousands --
Chickens
~~g Type
31,658
25,229
80
Broiler Type
309,176
331,015
107
T~u~r_k_e~-;_s______________________~i~6~~5~9~1____________________ i9,~0~7~~~----------------------~1~1~5~--
Continued Page 6 3
GFR-85-Vo I 2
GF.ORGIA ANNUAL CROP SUMMARY 1/, 1982, 1983, 1984
Planted
Harvested
Y1eld per
On1t
Total
Croo
Year
Acres
Acres
Acre
Unit
Production
Price
Value
1,000 Acres
1,000
Dollars
S1,000's
Cotton Lint 21
1984
175
172
781
Bale
280.0
3/.621
83,462
1983
120
115
467
Bale
112.0
4/.672
36,127
1982
163
158
714
Bale
235.0
4/.566
63,845
Cottonseed
1984
Ton
104
93.00
9,672
i983
Ton
41
189.00
7,749
1982
Ton
85
66.50
5,653
Corn, for Grain
1984
1,080
985
82
Bu.
80,770
3.15
254,426
1983
830
735
75
Bu.
55,125
3.64
200,655
1982
900
815
85
Bu.
69,275
2.62
181,501
Sorghum, for Grain 1984
165
113
42
Bu.
4,746
2.55
12,102
1983
118
68
41
Bu.
2,788
3.19
8,894
1982
200
135
42
Bu.
5,670
2.05
11,624
Wheat
1984
1,000
890
35
Ru.
31,150
3.20
99,680
1983
1,060
910
34
Bu.
30,940
3.24
100,246
1982
1,470
1,370
33
Bu.
45,210
3.05
137,891
Oats
1984
12)
60
55
Bu.
3,300
1.70
5,610
1983
155
85
61
Bu.
5,185
1.48
7,674
1982
160
90
61
Bu.
5,490
1.56
8,564
Rye
1984
430
80
22
Bu.
1,760
2.55
4,488
1983
400
70
21
Bu.
1,470
2.39
3,513
1982
450
70
21
Bu.
1,470
2.34
3,440
Sweetpotatoes
1984
6.6
6.4
140
Cwt.
896
14.80
13,261
1983
6.0
5.8
125
Cwt.
_ 725
16.40
11,890
1982
6.5
6.3
130
Cwt.
81 9
7.95
6,511
Tooacco )/
1984
39
39
2,200
Lb.
85,800
1.826
156,671
1983
44
44
2,190
Lb.
96,360
1.803
173,737
1982
49
49
2.155
Lb.
105,595
1.796
189.649
Hay)/
1984
) )0
550
2.4 0
Ton
1,320
62.00
81,840
1983
500
500
2.00
Ton
1,000
63.50
63,500
1982
500
500
2.40
Ton
1,2 00
60.00
72, 000
Peanuts for Nuts
1984
640
636
3,400
Lb.
2,162, 400
.241
) 21 , 138
1983
567
56 2
2,790
Lb.
1,567,980
.241
377,883
1982
475
472
3,215
Lb.
1,517,480
.246
373,300
Soybeans for Beans 1984
2 , 100
2,000
20
Bu .
40,000
6.10
244,000
1983
2,050
2 , 000
21
Bu.
42,000
7.59
318,780
198 2
2,400
2,350
27
Bu.
63,4 50
5.45
345,803
Apples, Utilized
1984
Lb.
45,000
. 075
3,375
Production
1983
Lb .
19,000
.086
1,643
1982
Lb.
14,000
.108
1,516
Peaches , Utilized 1984
Lb.
1 3 4 , 0 0U
. 148
19,88)
Producti on
1983
Lb.
92,000
.251
23,083
1982
Lb.
110,000
.204
22,460
Pecans . Utilizea
1984
Lb.
115,000
.552
63,500
Production
1983
Lb.
100,000
.629
62,850
1982
Lb.
125,000
.637
79,6 25
Grapes, Utilized
1984
Ton
2.6
582.00
1,512
Product i on
1983
Ton
2.3
534.00
1,229
1982
Ton
2.6
473.00
1,231
Tomatoes, Fresh
1984
3.0
2.8
90
Cwt.
252
24.60
6,199
Market
1983
2.8
2.4
86
Cwt.
20 6
24.80
5,109
1982
2.4
2.0
100
Cwt.
200
23.30
4,660
Total Above Crops 1984
6,313.6
5,534.2
1,580,821
(Excl. Acreage
1983
5,852.8
5,097.2
1,404,562
of Fruits & Pecans) 1982
6,775.9
6,017.3
1,5 0 9,273
1/ Includes allowance for loans outstanding and purchases by the Government valued at the average loan and purchase rate
for corn, wheat, sorghum, oats, rye and soybeans . All 1984 data are preliminary. 2/ Cotton yield is in pounds and price
is per pound. 3/ Average to January 1, 1985, w1th no allowance for unredeemed loans. 4/ Inc l udes allowance for un-
redeemed loans. 5/ Harvested acres substituted for planted acres.
4
GI!DRCIA 1984 CROP VAUJES AS A PEK.CJIITAGE OF 'IOIAL CROP VAUJE
Georgia
NCrop Repor tm~ ServKP
**** ** ~ * ~ *~ * * * *
* P ie ch art per centages computed f r om crops included * * !n t abl e . Exc lu des vege t ab le s and other crops not *
*listed. Poult-y and I ive st ock Income dat~ will be *
* avallabl~ In April 1985 .
*
*** * * ** ** * * * * ** * * ** * * * *
5
TOBACCO VALUE DROPS 10 PERCENT
GFR-85-Vo I 2 COTTON VALUE UP 112 PERCENT
Geor~ia's 1984 tobacco crop declined 10 percent in value from the 1983 level. At ~156.7 million, tobacco is the fourth most valuable crop in the State with 9.9 percent of the total. All of the decline in value is attributable to an 11 percent reduction in acreage. Both yield, at 2,200 pounds per acre, and price, at $1.826 per pound, were up slightly from the previous year. This was the fourth consecutive year of higher average price, but also the third consecutive year of declining total value for Georgia tobacco due mainly to acreage reduction.
The value of Georgia's 1984 cotton crop, at $93.1 million, is up 112 percent from last year, despite an 8 percent decrease in average price. Production at 280,000 bales, was more than double the 1983 crop due to the combination of a 50 percent increase in harvested acres and a record high yield of 781 pounds per acre. Cotton's value including lint and cottonseed , made up 5.9 percent of the total value of the State's major crops and was the highest valued cotton crop of the past decade.
CORN VALUE MOVES UP TO SECOND
WHEAT VALUE DOWN AGAIN
Georgia's 1984 wheat crop was valued at
$99.7 million, only 1 percent less than
the 1983 value but the third consecutive
year of declining value. Production in
1984 was up slightly but a 4 cent
reduction in price to $3.20 per bushel
resulted in the lower value.
Wheat
accounted for 6.3 percent of the
aggregate value of all major crops.
The value of Georgia's corn crop climbed
27 percent in 1984 to $254.4 million.
This increase, and a drop in the value of
the soybean crop, moved corn into second
place with 16.1 percent of the total
value of all major crops.
Corn
production jumped 47 percent over last
year's PIK-reduced crop. The yield of 82
bushels per acre is the second highest
ever recorded for the State.
Acres
harvested for grain increased 34 percent
from the 1983 level. The average price
declined 49 cents per bushel to $3.15.
COMMERCI AL POULTRY SU\ lGf!TF.R l I . DECEMBER 198.:. /. o f
i: of
r tern
Dec.
Nov.
Dec .
year
Jan. thru Dec.
year
1983
1984
1984
ago
1983
1984
n~
-Thousands-
- - -Thousands-
Young Chickens
G eor~ia
.:.4,380
39,567
.:.1.2 75
102
586,183
583 , 122
99
ln1ted States
313,208
320, 0 52
319,833
10 2 4 ,132,83 .:. 4,254,476 10 3
~ature Chickens
Li~ht Tyr>e U. S .
10 , 0~4
11,75 8
j 3 . i io'J
i)j
144 ,086
151. io68 10 5
!Ieavy Tv pe U.S.
2,173
2,29 7
2,54.:.
li7
35,776
33,955
95
Total C.S.
12,22 7
14 ,055
15,6')3
128
179,862
185,4:!3 103
Tot~1 Al l Types, Ga. 2,656
2,758
3,36d
127
36,662
37,000 101
Per c er.t Con d emned
Youn~ Ch1ci<. ens
Geo r v,ia
1 ....
~/1.4
2/1.4
l~ 1 ted States
I 5
1. 6
'2. I l :. _ _ ___.:2:../ 1. ;
!/ FedPrRlly inspe c ted slau~hter data as colle c ted b v ~e a t and Po ultry In spectio n
Pr op. r am . Current month data est1mat ed bv ~ia r "-et ~ews Secvice. 2/ Januarv- Nove mber
i 9d ~ co ndemnation~.
6
GEORGIA MILK PRODUCTION
Geor~ia dairv herds produc P. d 109 million
pounds ol :nilk during December 1984 , down
9 percent from last year but up 9 perce nt
trom last month. The numb~r o f milk cows
during December averaged 118,000 head, 9
percent less than a year a~o but th~ same
as
the previous
month's
count.
Production per cow averaged 920 pounds in
December, 10 pounds less than last vear
hut 70 pounds more than November 1984
U.S. MLK PRODUCTIO~ TOTALED 11.0 BILLION PO C:-<DS
~ilk oroduction durinP Drccmber 1984 totaled 11.1) billion pounds, 3 percent less than December 1983. i\c c umulaled milk production for thP. year 1984, totaled 136 billion pounds, down 3 percent from 1983.
Production per cow averaged 1,019 pounds during December, 3 pounds below December 1983. The total number of milk cows in herds averaged 10.8 million head during December, 3 percent below December 1983.
MILK COWS AND MILK PRODUCTION, DF.CEMUER 1983-~1~9~8 24 ______________
Georgia
United States
Itf'm
Unit
1983
1984 Percent
1983
1984
Percent
Milk Cows 1/
Thous. Head 129
118
91
11,146 10,827
97
Milk per Cow 2/
Pounds
930
920
99
1 ,022
1,019
iOO
Milk Production 2/ Mil. Lbs.
120
109
91
11. 39) 11.034
97
1/ Includes dry cows, excludes heifers not yet tresh. 2/ Excludes milk sucked by
calves.
CATTLE o;-: FEED IN 13 QUARTERLY STI\TES UP 7 PERCENT
Cattle and calves on feed Januarv 1,
1985, for the slaughter market in 13
quarterly states totaled i0.6 million head, 7 percent more than the previous year and 4 percent above 1983.
The total feedlot inventor~ included 6.76
million steers and steer "calves, up 4
percent
from 1984.
This
~roup
represented 64 percent of the total
number on feed compared with 66 percent
on Januarv 1, 1984. Heifers and heifer
calves accounted for 3.83 million head,
up 14 percent from last year.
Placements of cattle and calves on feed durin~ the October-December quarter totaled 7.56 million head, 4 percent
greater than the same quarter in 1983. Other disappearance of 417 thousand head leaves net nlacements for the OctoberDecember quarter of 1984 at 7.14 million.
Marketin~s of fed cattle for slaughter during October-December 1984 totaled 5.51 million head, an increase of 1 percent from fourth quarter marketings in 1983.
Durin~ the first quarter of 1985, 6.07 million head of fed cattle are expected to be marketed. This would be a 6 percent increase from first quarter marketings in 1984.
- - -- ---C-A-TT-L-E-A-N--D
ltP.m
.
On Feed Oct. 1 Placed on Feed Oct. 1-
6,951
Dec. 31 3/
7,272
7,559
104
Fed Cattle ~arkcted
5,927
6. 11 5
103
Oc.t. 1-Dec. 31 3/
5,436
5,507
101
4,530
4,572
101
Other Disappearance
Ocl. 1-Dec. 31 4/
:\9)
417
106
342
On F:~'~ J:tt;~. I
. ----"~l~~J4 ~l,.~.ri.~;..9~.8.,;.5:J---I-.....C.:.;...,....,;....:--,=~-L;,_-_7-.+J-'....7cP...::n-.,-L......,..::....L-=-.;..:r~~::-.-,.,....;r::._---
T/i\z,ci\,C0,11>,1L,L\ , K. MN.Nll.OK,SD,IX, 1\.
1\z,ci\,CO, 1\, , . ,
c attle placed on f~cd attP.r begi nning of qu a rter and marketed "before end of quarter.
/ Includes death lossf's, movement f rom feedlots to pastures and shipments to other feedlots tor further teedi ng .
7
N
COLD STORAGE STOCKS, UNITED STATES, DECEMBER 31, 1984
December 31, November 30, December 31,
Percent of
0
Commodity
>
I
"ro' I
Butler
0:::
LJ._
Cheese, Natural
l~
F:~P,S, Fro7.en
1983
499,372 1,204,554
11,781
1984 1,000 Pounds
335,896 1,044,222
16,187
1984
295,822 985,348
13, 169
Dec. 1983 Nov. 1984
Percent
59
88
82
94
112
81
Fruits, Frozen
644,705
734,090
694,520
108
95
Fruit Juices, Frozen
924,856
891,560
941,920
102
106
Meats, Red
679,337
681,376
686,272
101
101
RP.et, Frozen
325,033
340,061
347,660
107
102
Pork, Frozen
300,570
269,435
274,698
91
102
Poultry, Froze n
280,605
328,505
266,896
95
81
Turkeys, Frozen
161,753
195,650
126,028
78
64
VeP,etables, Frozen
1,884,261
1,985,689
1,856,938
99
94
Potatoes, Frozen
772 '962
884,232
892,254
115
101
Peanuts, Shelled
299,918
268,923
328,509
110
112
Pe~nuts, In Shell
18,545
22,569
31,490
170
140
re t: ans, Shelled
20. 160
18,578
20,103
100
108
Pecans In Shell
63 746
36 659
65 132
102
178
ro
(x
'1-00.C?
PI
1;jfORGIA
FARM REPORT
February i9, !985 GFR-85-Volume 3
Received
APR 0 7 1985
DUC fJ! .:.I T~ UGA LI BRAR IES
GEORGIA CROP REPORTING SERVICE
stephens Federal Bldg. Suite 320 Athens, Georgia 30613 Phone: (404) 546-2236
HIGHLIGHTS
?rospective Plantin~s
Cattle and Calves
Agricultural Prices
Grain Stocks
PLANTING INTENTIONS SURVEYED
A survey o f Georg ia f armers' pl a nting plans was c ondu c ted about ~ebruary 1 by the Georg i a Crop Reporting Service. The results of that survey shows dramati c changes in the acreages of some ot the State's major crops. If these early plans are carried out, sharply lower seedings can be expected for soybeans, along with moderate declines for corn, peanuts, tobacco and hay. Cotton and sorghum would both have significant increases.
SOYBEANS DROP 14 PERCENT
Soybeans reflected the largest percentage drop of all crops surveyed. Planting intentions are reported at 1,800,000 acres. This is a decrease of 14 percent from the 2,100,000 acres planted last year. The 1985 planting intentions are also 250,000 acres below the soybean plantings of two years ago, and the smallest planted acreage since 1978.
1985
Milk Production Turkey Hatchery Cattle on Feed
CORN DOWN 4 PERCENT
Early plant i ng plans of Georg i a farmers indicate plantings of 1,040,000 acres in 1985, down 4 percent from the 1,080,000 a c re s planted in 1984 . The 1985 planting intentions are 25 percent above the State's rec ord low of 830,000 a c res establ i shed i n 1983, but st i ll the sec ond lowest of reco rd.
DECREASE IN PEANUT ACREAGE
A number of Georgia's peanut growers had not decided how many acres they might plant this year since contract details were not known at the time of the survey. Those who had formulated very tentative plans indicated that they expected to reduce acreage by 3 percent. If other growers act similarly, peanut acreage would be reduced 20,000 acres from 1984 to 620,000 acres.
Cont i nued on Pag e 2
Cro
Corn, All Oats 1/ Cotton Sorghum, All Soybeans Peanuts Hay, All 2/ Rye Tobacco 2/ Sweet otatoes
1983
830 155 120 118 2,050 567 500 400
44 6.0
1,040 120
230 200 1,800 620 520 450
38 6.0
ercent
96 96
131 121
86 97 95 105 97
91
TOBACCO OFF 3 PERCENT
Many Georgia tobacc o growers were undec i ded at the time of Lhe survey since the cost o f the tobacco poundage assessment had not been announced. Those who had made very tentative plans indicated a 3 percent rollback in tobacco acreage to 38,000 acres, which would be the lowest acreage since 1932.
COTTON ACREAGE UP 31 PERCENT
Cotton plantings in 1985 are expected to increase by 55,000 acres, or a 31 percent increase over the 175,000 acres planted in 1984. The 1985 planting intentions of 230,000 acres are also 92 percent above the 1983 record low of 120,000 acres.
OATS DOWN 4 PERCENT
Producers report that oat seedings last
fall and winter plus those intended for
spring plantings, are expected to total
120,000 acres, down 4 percent from the
125,000 acres planted in 1984.
The
record January cold temperatures damaged
winter planted oats, but assessment of
the degree of damage continues. This is
the
second
consecutive year
of
sip,nificant freeze damage to oats.
SORGHUM UP - EQUAL TO 1982 LEVEL
Georgia growers anticipate planting 200,000 acres o f sorghum. This is a 21 percent increase over the 165,000 acres planted in 1984 and equal to the 1982 plantings.
1 985 UNITF.D
-.
GFR-85-Vol. 1 RED UCTION IN HAY ACREAGE
Hay producers indicate plans to reduce acrear,e approximately 5 percent. This would lower the 1985 hay a creage to 520,000, a decrease of 30,000 acres from the previous year.
UNITED STATES HIGHLIGHTS
Corn growers intend to plant 82.0 million
acres in 1985, up 2 percent from last
year and 36 percent above the PIK-reduced
1983 acreage.
Soybean prospective
plantings, at 64.4 million acres, are
down 5 percent from i 984 but 1 percent
above 1983. Sorghum intended for all
purposes, at 17.9 mill ion acres, is up 4
percent from a year ear l ier and up 51
percent from the PIK-reduced acreage of
1983. Barley acreage in 1985 is expected
to total 12.4 million acres, up 4 percent
from 1984 and 19 percent more than 1983.
Oats producers intend to plant 12.9
million acres in 1985, up 5 percent from
last year but down 36 percent from 1983.
All cotton prospective plantings total
11.0 million acres, 2 percent below 1984
but 38 percent above 1983.
Peanut
producers intend to plant 1.54 million
acres, down 2 percent from last year but
9 percent above 1983.
All tobacco
growers intend to harvest 715 thousand
acres in 1985, 10 percent less than in
1984 and down 9 percent from 1983. Flue-
cured a creage is expec ted to be 361.2
thousand acres for 1985, down 8 percent
from 1984 and 12 percent below the 1983
acreage.
Cro
1983
ousan
ercent
All Corn
60,217
80,394
82,021
102
All Sorghum
11 ,880
17,249
17,898
104
Oats
20,289
12,364
12,942
105
Rarlev
10,422
1 1,887
12,379
104
All Wheat
76,419
79,213
74,652
94
Winter
62,105
63,419
57,599
91
Durum
2,565
3,277
3,525
108
Other Spring
11,749
12,517
13,528
108
Sovbeans
63,779
67,735
64,360
95
Peanuts
1,411.0
1,560.4
1,536.0
98
Sunflowers
3,110
3,754
3,090
82
All Cotton
7,926.3
11,145.5
10,957.1
98
Hay 2/
59,717
61,585
62,281
101
Rve
2,707
2,971
2,555
86
Sweetpotatoes
105.3
107.5
108.9
101
Tobacco 2/
789.2
797.4
714.7
90
!/Intended plantings in 1985 as indicated by reports from farmers, except for
wi nter wheat seedings which were publ i shed Dec. 20, 1984 in the "Small Grains"
report. 2/Area harvested.
2
r. :::OR\.I i\ l.A TILE INVF.~TORY t:P v .- r. t:E sr . rc:r:-LY LES5
PER <.;:: -.;:-,
::. s. l.A1TLE T~VE~ l nRY OOW~ 3 PF.RC F~ T.
VALUE DO~ 2 PERCFX ~
.\ l l ~d ttle And ~a lv e s on G ~ or ~ia tarms on
All cattle and calves i n the Cnited
januarv l, 1985 are est1mated at : ,750,0 0 0 head, I p~rcent more than a year earlier.
States as of January 1, 1985 totaled 110
million head, down 3 pPr c ~nt from th~ 114
million on January 1. 1984.
This
continues the recent downward trend in
The current inventory c onsists ot 889,000
cattle inventories begun two years ago.
cows that have calved, just slightly above the ~85,000 on hand January I, 198~. Beef cows totaled 771,000 head, up 2 percent, but milk cow numhers dropped 9 percent from a year earlier to 118,000 head.
All cows and heifers that have calved, at 46.2 million. are down 5 percent from .:.1\.6 million a year aP.o. Reef .~ows, at 35.4 million, are 6 percent below Januarv 1, 1984 and milk cows, at 10.8 million are down 3 percent. All cattle and
The total value of \.eor~ia rattlP on hand january 1, 1985, amounted to $542.5 million , slightly helow the $543.4
calves on feed January 1, 1985, for slaughter, at 12.4 million head, are up 7 percent from 1984.
mi 11 ion on January 1, 1984. Average value per head was 3310 compared to 3315 a year earl i er.
The value of all cattle and calves on hand January 1. 1985, was $44.15 billion, down 2 percent from the $44.98 billion a
year earlier. Avera~e value per head was
S402, compared to $396 on January . ,
1984.
I.A TTL F. Ciass
,,:--;u l..\LVES:
XUMRI':R
~-
P,V l. T.ASS, GF.ORGIA '"~;n l i ~ITF.O
<.eorg i. a
1985 a s /.
1984
1985
1 .ooo lie ad
of 1984 Percent
STI\Tl':S 1 JANUARY 1 I 1984 AND 1985 United States
1985 as 7.
1984
1985
of 1984
1,000 liead
Percent
Cattle & Calves
1. 72 5
1, 7)0
101
113. 700
109,801
97
l.ows & lleifers ~\HV l" r a1ved f\pef C o~o;<;
"!i ; k C:ows
that
R85
889
100
48,603
46,211
95
756
771
102
37,494
35,393
94
129
Ill\
91
11 ,I 09
10,819
97
H,. I I "'r"' )I) I) Lbs. & Over
221
222
100
18,566
18,329
99
?o r ~--ef Cow Rep1Ac:emenl 114
114
100
6,183
5 ,5 36
90
For Milk Cow Replacement
40
40
100
4,532
4,757
105
OthPr lleifers
67
68
101
7,851
A,016
102
'" L P f' , . co ; 1\1) Lbs. & Ov(>r ~~~ i ~ ~ ; , ll () LI.Js. & OvP.r C"1v.- s IJnder 500 Lbs.
IO'S 17
4"~"''
I II) 56
471
105 98
104
16,171 2,:>49
27 611
16,199
100
2, 411
95
26 450
9>
r: on~lnUPrt 0n Pa1>e B
The Georgia Far R411>ort (ISSH~ 7 H-72801 Is published s-1-1110nthly by tt>e Georgia Crop Rec~ortlng Service, Steohans Federal Building, Athens, Ga, >0613, Larry E, Snipes, Statltlclon In Charge, Second class postage paid at Athens, GA. Subscription faa SIO per year ..cept free to data contr lbutoro. SubscrIpt Jon lnforr114t Jon av t ! labIa frCIII: Georg lo Crop Report lng Sarv Ico, Stephans Federal Bull~lnq Suite )20 Atnens GA. l Ot. l l Telaohona : (404) 546-22l6,
3
GEORGIA PRICF.S RECEIVED
The Georgia Prices Received All Commodity Index for January was 122 pe r cent of the 1977 average, 1 point above last month hut 24 points below a year ago. Iligher prices for cottonseed, soybeans, sows, cows, steers and heifers, calves, broilers and hatching eggs were partially offset by lower prices for wheat, corn, cotton, sweetpotatoes, barrows and gilts, other chickens and commercial e~RS
GFR-85-Vol.)
U.S. PRICES RECEIVED INDEX DOWN 1 POINT
The January All Farm Products Index 01
Prices Received By Farmers decreased I
poin~ from De c ember to 134 per cen t of its
January-December 1977 average.
Lower
prices for eggs, apples, turkeys, hogs
and cattle were partially offset by
higher prices for lettuce, broilers,
corn , calves and lemons. The index was
11 points below a year ago.
?~ICES RECEIVED BY Fi\RMERS, .JAN UARY 15 1985 WITII COMPI\RISONS
Price
Georgia
United States
per
Jan.
Dec.
Jan. 15,
Jan.
Dec.
Jan. 15,
Commoditv
Unit
1984
1984
1985
1984
1984
1985
Wi nter Wheat
S/Bu .
3.63
3 . 05
2.88
3.44
3.34
3.35
Oats
S/ Bu.
1. 81
1. 72
1. 71
Corn
3 /Bu.
3.76
2.97
2.89
3. 15
2.56
2.59
Cotton
Ct./Lb. 65. 1
61.5
l/56.5
62.7
55 .8
1/53.7
Cottonseed 2/
S/Ton
186.00
89.00
92.00
171.00
101.00
94.00
Tobacco
Ct./Lb.
3/ -
172.5
185.0 3/181.0
Soybeans
S/Bu.
7.65
5 . 65
5 . 74
7.85
5.82
5.77
Pean uts SweP.t[lotatoes
Ct./Lb. S/Cwt.
*
16.20
21.7 2/17.30
1/ *
17. 10
27.8 16.50
26.3 2/15.90
1/24.0 16.80
All Hay, baled 2/
S/Ton
76.60
76.00
74.00
Milk Cows, 4 /5/
S/Head 850.00
890.00
870.00
875.00
Hogs
S/Cwt.
47.50
48.90
47. 10
48.50
48.60
47 .70
Sows
S/Cwt.
39.70
37.90
38.10
42.90
39.40
40.70
Barrows & Gilts
S/Cwt.
49.00
49.70
48.30
49.30
49.70
48.50
Beef Cattle 6/
S/Cwt.
43.30
41.80
44.60
57 . 10
57.00
56.70
Cows 7 /
S/Cwt.
34.3 0
34.40
38.30
35.00
34.30
35.90
Steers & Heifers
S/Cwt.
53.40
48.10
49.70
63.90
63.10
62.80
Cal ves
S/Cwt.
53. 10
48.30
53.70
60 . 90
59.5 0
62.30
All Milk
S/Cwt.
14.70
15. 10
3/15.20
13.60
14.00 3/13.90
Turkevs 2/
Ct./Lb.
46.6
60.5
51.9
Chickens, ExcludinB
Broilers
Ct./Lh. 34.5
2/17.0
9.5
Com'l Broilers 8/ Ct./Lb. 36.0
27.0
3/29.0
36.9
28.5
3/30.9
Eggs, All 9/
Ct ./Doz 113.0
2/62.3
62.2
96.1
2/58.4
51.7
Table
Ct./Doz 105.0
2/53 . 0
42.0
92.8
2/52.8
42.9
Hatching
Ct./Doz. 140.0
2/120.0
130.0
II First half of month. 2/ Mid-month price. 3/ Entire month. 4/ Animals sold for da iry
herd replacement only. 5/ Prices estimated quarterly. 6/ "Cows" and "steers and heifers"
combined with allowance where nec essary for slaughter bulls. 7/ Includes dairy cows sold
for slauP-hter. 8/ LiveweiRht Pquivalent price fo r GPorgia . 9/ Average of all eggs sold by
farmers including hatching eggs sold at retail. * Insufficient . sales.
4
CO NSuMER PRICE INDEX
The De c ember unadiusted Consumer Price Index for all urb~n consumers (CPI-C ) increased 0.1 percent from a month earlier to 315.5 (1967:100). The index was 4.0 percent higher than in December 1983. On a seasonallv ad;usted basis, the CPI- U rose 0.2 ner c ~nt ~rom November. The Entertainment Index in c re~sed 0 .~ nercent. The Other Goods and Servi c es Index increased 0.4 percent. The Food and Beverar.es and ~edi c al Care Indexes both increased 0.3 percent. The Housing Tncex showed the smallest increase of 0 .1 perc ent. The only c a tegory to show a cie c rease t ram November was the !\r>parel
and Cpkeep Index, down O.J percent.
U.S. PRICES PAID INDEX UNCHANGED
The Index of Prices Paid Ry Farmers For Commodities And Servi c es, Interest, Taxes and Farm WaRe Rates t o r Januar y was 164 percent of its 1977 base. Janua ry was the seventh consecutive month that the index was 164. Declines in the fuels and energy and interest indexes were offset by the increases in the feeder livestock, feed and tax components. Compared to a year earlier, the index was up 1 point.
PRICES PAID RY FARMERS, JANUARY 15 1985 WITII COMPARISONS
Price
Georgia
United States
per
Jan. 15, De c . 15, Jan. 1 '.i,
Jan. 15, Dec. 15, Jan. 15,
Commodity
Unit
1984
1984
1985
1984
1984
1985
DAiry Feed 167.
S/Ton
215.00
175.00
190.00
205.00
176.00
177.00
Dairy Feed 18 7.
S/Ton 215.00
176.00
189.00
220.00
178.00
180.00
Oairy Conrt. 32 7.
S/Ton
285.00
215.00
225.00
300.00
238.00
237.00
!log Feed 14 7. -18 7.
S/Cwt.
12.50
10.40
10.70
12.00
9.89
9.82
!Jog Con c t. 38 7. -42 7.
S/Cwt.
17.00
13.00
13.00
16.80
13.10
13.00
Reef Cattle Conct.
12 7. -36 7.
S/Cwt.
13.50
12.50
13.00
13.90
11.20
11.30
Cottonseed Meal 41 7. S/Cwt.
16.50
12. 50
12.50
16.30
12.90
12.60
Soybean Meal 44 7.
S/Cwt.
15.50
12.00
12.00
1!).60
11.30
11.10
Bran
S/Cwt.
11.50
11.50
11.00
10.70
9.90
9.89
Middlings
S/Cwt.
11.00
10.50
10.00
10.30
9.34
9.25
Corn Meal
S/Cwt.
9.90
10.00
9.40
8.8 1
7.74
7.62
Rro i ler Grower
S/Ton
220.00
245.00
245.00
243.00
216.00
221.00
Laying Feed
S/Ton
215.00
164.00
172.00
219.00
187.00
189.00
Chi r k Starter
S/Ton
240.00
210.00
220.00
246.00
211.00
214.00
Rroiler-Feed Ratio 1/ Lbs.
3.3
2.2
2.4
3.0
2.6
2.8
!log-Corn Ratio 2/
Bu.
12.6
16.5
16.3
15.4
19.0*
18.4
Mi lk-Feed Ratio 3/
Lbs.
1.37
1.73
1.60
1.33
1.59*
I. 57
!':P:. r.-Feed Ratio 4/
l.hs.
1 0 .~
7.6
7.2
11.8
6.2
5. 5
1/ Pounds of broiler grower equal in value to I lb. broiler live weight. 2/ Bushels of
c orn equal in v a lue to 100 lus. oi ho~ live we i ght. 3/ Pounds of 16 7. dairy f eed equal
in value to I lb. whole milk. 4/ Pounds of laying feed equal in value to I doz. eggs.
*Revised.
:~DEX NuMBERS--GEORGIA AND CNITED STATES
1977=100
Decemoer 1983
Januarv 1984
December 1984
Januarv 1985
eorg1.a
Prl.ces Received
All Commodities
139
146
121
122
Crops
134
135
122
120
Livestoc k & Produc t s
1 .:.1
156
120
123
United States
Prices Re r: e i veci
; ~o
145
135*
134
Prices Paid 1/
162
163
164
164
Ratio 2/
86
1\9
R2
82
1/Mid-montn index in c ludl.ng interest, ta'xes and farm w~ge rat e s. 2 7 Rat1o of Index o f
Prices Received to Index of Pri r. es Paid Interest, Taxes and Farm Wa ~ e Rates.
* Revised.
5
GFR-85-Vol. 3
G?. ORG I.\ COR:-; !\:-iD <;OY::\E.\ .-; S-:"r. O : S .-\BOVE .\
YEAR AGO
S toc ks ot corn storP.d ~ :1 ill 1 ,-.osttions in
Georgia on January l 1985, tot-aled )0,775, 000 busht'ls, up 18 perc ent from Jan11ary I, 198... Sto.:ks on farms were up 25 percent while off farm stocks were down I percent.
Soybean stocks in all positions totaled 29,854,000 bushels as of January 1, an increase of 5 percent from a year earlier. On farm stocks showed a 25 percent increase with o f f farm stocks showing a 3 percent decline.
Total wheat stoc ks at 3,920,000 bushels, we r e down 11 percent in Georgia . Stocks hetn~ h eld on farms declined 14 per c ent from a year ago, and those being stored off farms fell 12 percent.
Sorghum stocks at 2,0)5,000 bushels on January 1, 1985, were up 67 percent from a year ago. On farm stocks were up 79 percent and off farm stocks were down 2 percent.
Ont stocks, at 1,348,000 bushels, in all positi o ns were down 5 percent from last year's January 1 level. 7he on farm stocks were down 10 percent while off farm stocks were up 26 percent.
\.rain
Co r n Oat s Rarlev Wheat SorP,hum 5 0 V be all S 1/ Inc ludes
I.EORGIA GRAIN S.TOCKS--.Ji\NIJARY 1, 1985 WJT!I COM..:.P:..i\:..:.:.:R.::J.:.:S:.O.::..-.N.:..:'S::.___ _ _ __
On Farms
Off Farms 1/
All Positions
1984
i9R5
1984
198~
1984
1985
-1,000 Bushels-
18,743 23,423
7,434
7 ,352
26,177 30,775
1. 24 4
1 122
179
226
1,423
1,348
7
37
7
37
2 , 166
1 , 8 6 9
2 , 344
2 , 0 5 1
4 , 5 10
3 , 920
1,032
1,851
188
184
1,220
2,035
7 I 9 8 0 10 1 0 0 0
2 0 t 5 4 1 19_L8 54
28 I 52 1 29 I 8 54
stoc ks at mills, elevators, wa r ehouses, terminals and processors.
U.S. CORN AND SOYBEAN STOCKS UP
Stocks of corn in all positions on January I 1985, were estimated at 5.81 billion busht>ls, up i8 percent from a year ago, while soybean stocks at 1.42
billion bushels, were up 10 percent. Changes of other grains were as follows : wheat down 8 percent, grain sorghum up 11 percent, oats down 6 percent, and barley up 19 percent.
u.s. GRAIN STOCKS--JANUARY 1 I 1985 WITH COMPARISONS
On Farms
Off Farms 1I
All Positions
Grain
1984
1985
1984
1985
- Mi 11 ion Bushels
1984
1985
Corn
3,080.0 lt,248.1
1,832.9 1,560.2
4,912.9 5,808.3
Oa t s
122.4
299.4
56.4
57.8
378.8
357.2
Barley
244.9
306.5
122.7
131 3
367.6
437.8
Wheat
I ,015. 4
933.5
1,311.0 1,206.3
2,326.4 2,139.8
Sorghum
149.3
232.6
505.5
496.3
654.8
728.9
-'; o-v-i.J-<'-ans
620.2
767. 1
670.4
655.7
1 290.6 I 422.8
I I Includes stocks at mills, elevators, warehouses, terminals and processors.
6
GEORGIA MILK PRODUCTION DOWN 8 PERCENT
U.S. MILK PRODUCTION 11 . 2 BILLION POUNDS
C.eorgia dairy herds produc ed 110 million pounds o f milk during January 1985, down 8 percent from last year but up 1 percent from last month. The number of milk cows during January averaged 117,000 head, 8 percent less than a year ago. Production per cow averaged 940 pounds in January, 5 pounds less than last year but 20 pounds mor e than December 1984.
Mi lk product i on dur i ng Jana ury 1985
totaled 11.2 billion pounds ,
perc ent
be low January 1984. January product i on
pe r cow averaged 1,038 pounds, 6 pounds
above a year earlier. Total milk cows
averaged 10.8 million head, 2 percent
below J anaury 1984.
Milk production
during 1984 totaled 135 billion pounds, 3
percent below the record high of 140
billion pounds set in 1983. Output per
cow in 1984, at 12.5 thousand pounds, is
90 pounds below 1983.
MILK COWS AND MILK PRODUCTION, JANUJ\RV 1984-1985
Georgia
United States
Item
Unit
1984
1985 Percent : 1984
1985
Percent
Milk Cows 1/
Thous. !lead 127
117
92
11,026 10,801
98
Milk per Cow 2/
Pounds
945
940
99
1,032
1,038
101
Milk Production 2/ Mil. Lbs.
120.
110
92
I I Includes dry cows, excludes heifers not yet fresh .
c a lves.
11 375 11 209
99
2/ Excludes milk sucked by
U.S . CATTLE ON FEED UP 7 PERCENT, GEORGIA UNCHANGED
All cattle and calves on feed January 1, 1985, for slaughter, at 12 . 4 million head, are up 7 percent from 1984 and 3 percent from 1983. Cattle on feed in Georgia is estimated at 26,000 head on January 1, 1985, the same as January 1, 1984. This equals the lowest number of cattle on feed in Georgia for this date since records began in 1961.
EGGS IN INCUBATORS FEBRUARY 1
The turkey eggs in inc uba tors on February I, 1985, totaled 21.9 mi llion, 6 percent above the 20.6 million a year earlier.
POULTS PLACED DURING JANUARY
The 15.5 mill i on pou l ts placed during January 1985 i n the United States were 10 percent above the placements during the same month a year ag o .
State
SELECTED STATES 1 1985 as /.
1985
of 1984
I I ON FEED 1 JANUARY II 1984-85 1/
1985 as /.
1984
i 1985
of 1984
1,000 Head
Percent
1,000 Head
Percent
Ariz.
407
419
103
Ala.
40
30
75
Calif.
589
598
102
Fla.
80
90
113
Colo.
980
1 ,000
102
Ga.
26
26
100
Ill.
510
540
106
Mo.
90
90
100
Iowa
1 ,000
880
88
N.C.
25
25
100
Kans .
1 ,320
1,530
116
S.C.
20
23
11 5
Mi nn.
375
- 370
99
Tenn.
15
15
100
Nebr.
1,760
1 , 880
107
Oth. Sts. 2,407
2,614
109
Tex.
1 950
2 310
118
u.s.
11 594
12 440
107
1/ C11ttle and calves on feed are animals for slaughter market being fed a full ration o f grain or other concentrates and are expected to produce a carcass that will grade
good or better. Cattle and calves on feed are included in the catfle and calf inventory
Pst i matP.s by classes.
7
GEO RGIA CALF CROP UNCHANGED
li . 5. CA I.F CROP DOWN 3 . PERCENT
......
~alves horn during 1984 in Georgia,
> 0
totaled 780,000 head, the same as the
I
'0"0
1983 c alf c rop, but 7 percent less than the 840,000 born in 1982.
exI :
ta.
~
The 1984 calf crop is estimated at 42.5 million, riown 3 percent from i983. This is down 2 percent from the expected calf crop puillisheri tn .~uly. Calves horn the first half of the year were estimated at 71.5 percent of the annual total.
S lflLf!
1983
~ALF CROP, SEL.=.F.;..C::..Tc..E..::O:.c:c.,-sTATEs , 1983-1984
1984
1984 as .,,,
of 1983
State
I 1983
198 4
1984 as % of 1983
I ,000 Head
Percent
1,000 Head
Percent
Ala.
870
830
I)')
N. C.
460
470
102
C:aiif.
I, 730
1,740
101
Okla.
2 , 000
2,000
100
rJ ,,
i 1()0
1 ,050
95
S. C.
245
260
106
Ga .
780
780
100
S. Oak.
1,800
1,800
100
Town
1 17 40
1,640
94
Tenn .
I I 220
1,160
95
1\an <; .
I ,610
I , ~75
98
Tex.
5,450
5 , 050
93
'1o.
2,320
2,200
95
Wis.
1,980
2,020
102
Mont.
1. 640
I, 610
9A
Oth. Sts . 17,030
16 . 514
97
\Jphr.
1 95fl
1 ROO
1)2
u.s .
43 92')
42 499
97
CRorg1a
~~Crop Report1ng Serv1ce
Stephens Federal Bldg. Suite 320 Athens, Georgia I 0613
SECOND-CLASS POSTAGE PAID AT ATHENS, GA 30613
:firEO~ <;(ti.co.(;7
...J
FARM REPORT
March 6, 198S GFR-85-Volume 4
Received
APR 0 7 1985
DOC U II~ 1::,
UGA UBR RI ES
GEORGIA . CROP REPORTING SERVICE
stephens Federal Bldg. Suite 320 Athens, Georgia 30613 Phone: (404) 546-2236
HIGHLIGHTS
POULTRY SUMMARY
PEANUT STOCKS
LIVESTOCK SLAUGHTER COLD STORAGE
U.S. EGG PRODUCTION AND LAYER NUMBERS UP
AGRICULTURAL PRICES CATTLE ON FEED FARM LABOR ANNUAL EGG PRODUCTION
The Nation's laying flocks produced 5.95
billion eggs during January 1985, up 5
percent from the 5.68 billion produced a
year ago.
Production included 5.33
GEORGIA LAYERS AND EGG PRODUCTION UP
billion for table eggs or commercial type
eggs and 624 million for hatching eggs.
Georgia's laying flocks produced 392
million eggs during January 1985, 3 The total number of layers during January
percent more than a year ago. Production includes 290 million table eggs and 102
averaged 284 million, up 3 percent from the 277 million a year ago. All~layers
million hatch i ng ~ggs.
on February 1 1 1985 totaled 282 million. 2 percent greater than the 276 million a
The average number of layers in Georgia year earlier. The 282 million layers
c~~ing Janu~ry 1985 was 19.0 million, 1
consisted of 248 million for table eggs
percent more than a year ago. Eggs laid and 33.3 million for hatching eegs.
per 100 layers during January 1985
averaged 2,065 compared to 2,026 a year
ago.
NUMBER OF LAYERS AND EGG PRODUCTION. JANUARY 198S
No. Layers on
Eggs per 100
Total Eggs Produced
Hand-Jan. 1
Layers-Jan.
During Jan.
1984
1985
1984
1985
1984
1985
Thousands
Number
Millions
Georgia
Hatching
4,977
5,402 1,869
1,879
93
102
Other
13,730
13,577 2,086
2,139
286
290
Total Georgia 18,707
18,979 2,026
2,on
379
392
Total U.S.
276,789 284.415 2,054
2,092
5.684
5,951
Chickens Ega Type Broiler Type
EGGS IN INCUBATORS, FEBRUARY 1985, UNITED STATES
<
1984
1985
% of Year Ago/
/
33,538
25,389
76
312,641
332,225
106
20,574
21,876
106
Agricaltaral Statf..sticf.aa aad Ceorpa Deparment of Agriculture
GFR-85-Vo-1. 4
COMMERCIAL POULTRY SLAUGHTER 1/, JANUARY 198S
/. of
7. of
Jan.
Dec.
Jan.
year
Jan. thru Dec.
year
Item
1984
1984
1985
ago
1983
1984 ago
-Thousands-
- - -Thousands-
Young Chickens
Georgia
49,445
41 ,0 51
53,669
109
586,183
578,938
99
United States
339,687
323,133
37 4,259
110 4,132,835 4 ,269 ,881 103
Mature Chickens
Light Type U.S.
10,376
13,604
17,997
173
142,084
152,436 107
Heavy Type U.S.
2,646
2,641
2,941
111
35,776
34,052
95
Total U.S.
13,022
16,245
20,938
161
177,860
186,488 105
Total All Types, Ga. 2,887
3,417
4,486
155
36,662
37,049 101
Percent Condemned
Young Chickens
Georgia
1. 4
1.5
2/1.4
2/1.4
United States
1.5
1.8
2/1.5
2/1.5
i/ Federally inspected slaughter data as collected by Meat and Poultry Inspection
Program. Current month data estimated by Market News Service. 2/ January-Dec. 1984
condemnations.
POULTRY HATCHING AND PLACEMENT--JANUARY 1985
During.
/. of
7. of
Item
Jan.
Dec.
Jan.
year
Jan. thru Dec.
year
1984
1984
1985 ago
1983
1984
ago
- -Thousands--
--Thousands--
Pullet Chicks Placed
Domestic (U.S.) 1/
Broiler Type
3,202
3,731
3,471 108
38,068
39,586
104
Egg Type
194
171
168 87
3,307
3,466
lOS
Chicks Hatched
Broiler Type
G e o r g.i a
54,847
S6,813
.S7,61S 105
643,229
666,706
104
United States
370,024 394,640 400,878 108 4,446,999 4,S93,346
103
Egg Type Georgia
3,727
1,400
1 ,867 so
24,6S6
38,239
ISS
United States
36,805
26,995
28. 180
77
406,93S
456,105
112
Turkeys
Poults Placed
u.s.
12,162
1S,493 110
2/S4,771 2/58,946
108
!/Reported by leading breeders, includes expected pullet replacements from eggs sold
during the preceding month at the rate of 12S pullet chicks per 30 dozen case of eggs.
2/Turkey poults placed Sept. 1984-Jan. 1985.
The GeorQio FarM Report (ISSN -0744- 7280 ) Is published s.. l-monthly by the Georgie Crop Reporting Service, Stephens Fadaral Bul ldlng, Athens, Ga. JC6~3. Larry E. Snipes, Statistician In Charge. Second class postoge paid ot Athens, GA. Subscription fee SlOper year .wcept free to deto contributors. Subscription Information ava il able frOM: Georgia Crop Reporting Service, Stephens Federal Building, Suite J20 Athens GA. J061J Telepttone: (404) 546-22J6
2
GEORGIA RED MEAT PRODUCTION DOWN
Commercial red meat production in Georgia totaled 32.7 million pounds during January 1985. This is up 9 percent from December 1984 but down 17 percent from January 1984.
The number of cattle slaughtered by commercial plants in Georgia during January 1985 was 19.3 thousand, down 5 percent from a year earlier. The total live weight was 17.5 million pounds with an average live weight of 906 pounds per head.
There were 132.4 thousand head of hogs slaughtered in Georgia's commercial plants during January. This is 25 percent less than the same period last year. The total live weight was 31.1 million pounds with an average of 235 pounds per head.
U.S. RED MEAT PRODUCTION UP
Commercial red meat production for the
United States in January 1985 totaled
3.42 billion pounds, up 6 percent from
January 1984.
Commercial red meat
production
includes
slaughter
in
Federallv inspected and other plants, but
excludes"animals slaughtered on farms.
Beef production at 2.07 billion pounds
was up 8 percent. Head killed was 3.28
million, up 5 percent and the average live weight 1,081 pounds.
Veal production, at 43 million pounds,
was up 10 percent. Calf slaughter of 288 thousand head was up 4 percent and the average live weight 247 pounds.
Pork production totaled 1.28 billion pounds up 4 percent. Hog kill at 7.34 million head increased 2 percent and the average live weight 245 pounds.
Species
Georgia Cattle Calves Hogs Sheep & Lambs
GEORGIA AND UNITED STATES LIVESTOCK SLAUGHTER 1/
Number Slaughtered
Average
1985
Jan.-Jan.
Live Weight
Jan.
as 7. of '85 as 7. of
Jan.
1984
1985
1984
1984
1984
1985
1 ,000 Head
Percent Percent
Pounds
Total
Live Weight
Jan.
1984
1985
1,000 Pounds
20.4
19.3
95
1.2
1.6
133
177.5
132.4
75
1
95
902
906
18,413
17,518
133
357
244
420
390
75
229
235
40,574
31,077
84
4
United States
Cattle
3. 107.2 3,277.8
105
105
1,066 1,081
3,314
3,542
Calves
277.3
288.0
104
104
240
247
66,567
69,460
Hogs
7,188. 1 7,342.5
102
102
242
245 1,737,972 1,795,548
SheeE & Lambs
553.3
556.9
101
101
113
115
62.282
63.833
1/ Includes slaughter under Federal Inspec tion and other commercial slaughter, excludes
farm slaughter.
COMMERCIAL RED ME AT AND LARD PRODUCTION : UNITED STATES WITH COMPARISONS 1/
Kind
Januarv 1984
January 1985
7. of Year Ago
--Million Pounds--
Beef
1. 913
2,066
108
Veal
39
43
110
Pork
1. 234
1. 281
104
Lamb & Mutton
31
32
103
Total Red Meat
3,218
3, 4 21
106
Lard 2/
79
81
103
1/ Based o n packers dress we i ghts and excludes f arm slaughter. 2/ Preliminary lard
production inc ludes rendered pork fat.
3
U.S. PRICES PAID INDEX UNCHANGED
The Index of Prices Paid by Farmers for Commodities and Services, Interest, Taxes and Farm Wage Rates for February was 164 percent of its 1977 base. The index was unchangen from a month earlier and a year ago. Declines from a month earlier for the feed, fuels and energy, and buidling and fencing indexes were offset by an increase for the feeder livestock index.
CONSUMER PRICE INDEX
GFR-85-Vol. 4
The January unadjusted Consumer Price
Index for all urban consumers (CPI-U)
increased 0.2 percent from a month
earlier to 316.1 (1967100). The index
was 3.6 percent higher than in January
1984. On a seasonally adjusted basis,
the CPI-U rose 0.2 percent from December.
The other goods and services index was up
0.9 percent from December. A sharp in-
crease in cigarette prices accounted for
nearly two thirds of this rise. The
transportation, medical care and enter-
tainment indexes each rose 0.3 percent.
A 0.2 percent rise was registered for
food and beverages. Housing was 0.1
percent higher.
The only component
showing no change from December was
apparel and upkeep.
PRICES PAID BY FARMERS, FEBRUARY 15, 1984 WITH COMPARISONS
Price
Georgia
United States
per
Feb. 15, Jan. 151 Feb. 15.: Feb. 15. Jan. 15, Feb. 15,
Commodity
Unit
1984
1985
1985
1984
1985
198~
Dairy Feed 16%
$/Ton 205.00
190.00
176.00
201.00
177.00
174.00
Dairy Feed 18%
$/Ton 210.00
189.00
175.00
213.00
180.00
177.00
Dairy Gonet. 32%
S/Ton 285.00
225.00
225.00
286.00
237.00
237.00
Hog Feed 14%-18%
S/Cwt.
12.50
10.70
10.50
11.80
9.82
9.72
Hog Gonet. 38%-42%
S/Cwt.
16.50
13.00
13.00
16.10
13.00
12.90
Beef Cattle Gonet.
32%-36%
S/Cwt. 13.50
13.00
12.00
13.40
11.30
11.00
Cottonseed Meal 41% S/Cwt.
16.50
12.50
12.00
16.00
12.60
12.30
Soybean Meal 44%
S/Cwt. 14.50
12.00
12.00
14.80
11.10
11.00
Bran
S/Cwt.
12.00
11.00
11.00
10.80
9.89
9.81
Middlings
S/Cwt.
10.50
10.00
10.50
10.30
9.25
9.13
Corn Meal
S/Cwt.
10.00
9.40
9.40
8.83
7.62
7.54
Broiler Grower
$/Ton 215.00
245.00
250.00
243.00
219.00* 215.00
Laying Feed
$/Ton 215.00
172.00
181.00
217.00
189.00
189.00
Chick Starter
$/Ton 240.00
220.00
215.00
243.00
210.00* 209.00
Broiler-Feed Ratio 1/ Lbs.
3.3
2.4
2.3
3.1
2.8
2.8
Hog-Corn Ratio 2/
Bu.
12.0
15.7
15.8
14.6
18.2*
18.9
Milk-Feed Ratio 3/ Lbs.
1. 42
1. 61
1. 73
1.33
1.58*
1.59
Egg-Feed Ratio 4/
Lbs.
9.8
7.2
7.1
8.6
5.5
5.6
1/ Pounds of broiler grower equal in value to 1 lb. broiler live weight. 2/ Bushels of corn
equal in value to 100 lbs. of hog live weight. 3/ rounds of 16% dairy feed equal in value to
1 lb. whole milk. 4/ Pounds of laying feed equal in value to 1 doz. eggs. *Revised.
INDEX NUMBERS--GEORGIA AND UNITED STATES
1977100
January 1984
Februarv 1984
January 1985
February 1985
Georgia
Prices Received
All Commodities
146
146
123*
125
Crops
135
135
122*
122
Livestock & Products
156
155
125*
127
United States
Prices Received
145
144
135*
135
Prices Paid 1/
163
164
164
164
Ratio 2/
89
88
82
82
1/Mid-month index including interest, taxes and farm wage rates. 2/ Ratio of Index of
Prices Received to Index of Prices Paid, Interest, Taxes and Farm Wage Rates. * Revised.
4
GEORGIA PRICES RECEIVED
Average prices by Georgia f armers at mid-
February for most crops were down and
most livestock were up from the previous
month. Higher prices for sweetpotatoes,
hogs, beef cattle, calves, other chickens
and hatching eggs were partially offset
by lower prices for wheat, cotton, soy-
beans and milk.
The Georgia Prices
Received All Commodity Index for February
was 125 percent of the 1977 average, 2
points above last month but 21 points
below last year.
U.S. PRICES RECEIVED INDEX UNCHANGED
The February All Farm Products Index of prices received by farmers was unchanged from January at 135 pe rcent of its January-December 1977 average. Lower prices for lettuce, cotton, soybeans, oranges and lemons were partially offset by higher prices for cattle, hogs, sweet corn and strawberries. The index was 9 points below a year ago.
PRICES RECEIVED BY FARMERS, FEBRUARY 15, 1985 WITH COMPARISONS
Commodity Winter Wheat Oats Corn Cotton Cottonseed 2/ Tobacco Soybeans Peanuts Sweetpotatoes All Hay, baled 2/ Milk Cows, 4/5/ Hogs
Sows Barrows & Gilts Beef Cattle 6/ Cows 7/ Steers & Heifers Calves All Milk Turkeys 2/ Chickens, Excluding
Price per Unit
S/au.
$/Bu. S/Bu. Ct./Lb. S/Ton Ct./Lb. S/Bu. Ct./Lb. S/Cwt. S/Ton $/Head S/Cwt. S/Cwt. S/Cwt. S/Cwt. S/Cwt. S/Cwt. S/Cwt. S/Cwt. Ct./Lb.
Feb. 1984
3.49
Georgia Jan. 1985 3.23
3.68 66.6 186.00
3.09 54.5 92.00
7.61
*
17.60
5.86
*
2/17.10
44.00 38.50 44.90 48.70 38.90 56.40 57. 10 14.60
890.00 48.50 38.30 49.30 44.30 38.80 53.40 57.30 15.30
Feb. 15, 1985 3.21
3.10 1/54.0
95.00 3/-
5.73 1/*
18.20
49.00 41.80 50.00 47.80 41.90 56.60 60.70 3/15.20
United States
Feb.
Jan.
Feb. 15,
1984
1985
1985
3.33
3.35
3.33
1.88
l. 74
l. 71
3.11
2.64
2.62
65.0
52.1
1/47.9
176.00
94.00
93.00
175.3
181.0 3/164.5
7.28
5.90
5.74
24.1
1/-
18.60 2/16.80
18.00
78.70
74.00
75 . 40
875.00
45.40
48.00
49.60
42.30
41.10
46.00
45.90
48.80
50.00
59.70
57.30
58.70
39.70
37.70
40.50
64.60
63.00
63.40
63.90
64.10
66.20
13.40
14.00 3/13.80
41.3
51.9
41.6
Broilers
Ct./Lb. 29.0
2/9.5
12.5
Com'l Broilers 8/ Ct./Lb. 36.0
29.0
3/29.0
37.4
30.9 3/30.5
Eggs, All 9/
Ct./Doz 105.0
2/62.2
64.5
92.9 2/51.7
52.8
Table
Ct./Doz 91.1
2/42.0
42.2
88.8 2/42.9
44.6
Hatching
Ct./Doz. 150.0 2/130.0
135.0
1/ First half of month. 2/ Mid-month price. 3/ Entire month. 4/ Animals sold for dairy
herd replacement only. 5/ Prices estimated quarterly. 6/ "Cows" and "steers and heifers"
combined with allowance where necessary for slaughter bulls. 7/ Includes dairy cows sold
for slaughter. 8/ Liveweight equivalent price for Georgia. 9/ Average of all eggs sold
by farmers including hatching eggs sold st retail. *Insufficient sales.
5
CATTLE ON FEED IN 7 STATES UP 3 PERCENT
Cattle and calves on feed February 1, 1985 for slaughter market in the 7 states preparing monthly estimates totaled 8.17 million head, up 3 percent from a year ago and I percent above February 1, 1983.
Marketings of fed cattle during January totaled 1.78 million, up 14 percent from 1984 and 9 percent above 1983.
Placements of cattle and calves on feed during January were 1.45 million, 7 percent less than last year and 3 percent below January 1983. Net placements of 1.33 million are 10 percent less than last year and 2 percent below January 1983.
Other disappearance totaled 118 thousand head compared with 86 thousand during January 1984 and 130 thousand two years ago.
GFR-85-Vo1.4
CATTLE AND CALVES ON FEED, FEBRUARY 1
1985 as
7. of
Item
1984
1985
1984
1 ,000 Head
On Feed Jan. 1 1/ 8,006 8,617
108
Placed on Feed
during Jan.
1,566 1,452
93
Fed Cattle
Marketed during
Jan.
1,569 1,782
114
Other Disappear-
ance during
Jan. -2/
86
118
137
On Feed Feb. 1 1I 7, 917 8,169
103
1/ Cattle and calves on feed are animals
for slaughter market being fed a full
ration of grain or other concentrates and
are expected to produce a carcass that
will grade good or better. 2/ Includes
death losses, movement from feedlots to
pastures and shipments to other feedlots
for further feeding.
TOTAL EGG PRODUCTION: ANNUAL AVERAGE NUMBER OF LAYERS, EGGS PER LAYER AND TOTAL EGG PRODUCTION, SPECIFIED STATES, RANKED IN ORDER OF AVERAGE NUMBER
OF lAYERS 1983 AND 1984
State
T ousan
i
ggs
Calif.
33,396
34,305
245
243
8,173
8,325
Ind.
18,141
19,737
255
253
4,624
4,997
Ga.
191223
181625
243
240
41671
41474
Pa.
18,094
16,274
261
263
4,716
4,282
Ark.
15,603
14,831
243
240
3,786
3,560
N.C.
13,158
13,604
240
239
3,152
3,246
Ohio
11,584
13,549
257
254
2,980
3,445
Tex.
12,745
13,055
242
244
3,089
3' 182
Fla.
11,865
11 896
250
245
2,965
2,912
Ala.
11 501
11,533
245
241
2,813
2,783
Minn.
10,230
10,061
245
243
2,508
2,443
Iowa
7,692
7,444
238
238
1,827
1,769
N.Y.
6,899
6,692
252
256
1,741
1,710
S.C.
6,302
6,244
253
259
1,594
1,617
Mich.
5,971
6,162
249
247
1,484
1,519
Mo.
5,504
5,787
246
234
1,352
1,357
Miss.
5,509
5,309
233
236
1,285
1,253
Maine
5,249
5,241
267
259
1,402
1,355
Wash.
5,017
5,193
246
251
1 '232
1,306
Conn.
u.s.
4,376
4,747
2761263 2771855
245
253
247
245
1 '073 681169
1,199 681193
II Annual estimates cover the period Dec. preVlOUS year thru Nov. 30.
2/ Total egg production divided by average number of layers on hand.
6
JANUARY PEANUT STOCKS UP 28 PERCENT
EDIBLE USES AND CRUSIIINGS
Peanut stocks in commerc i al storage on January 31, 1985, totaled 2.94 billion pounds of equivalent farm stock, 28 percent more than the amount on hand a year earlier. This total includes 1.89 billion pounds of actual farmer stock compared with 1.51 billion pounds on hand a year ago.
Commerc ia l
processors utilized 684
million pounds of shelled edible grade
peanuts during August-January, compared
with 666 million pounds a year earlier.
Utilization for peanut butter, at 361
mi llion pounds, was up 5 percent;
utilization for peanut candy, at 140
million pounds, was down 5 percent; and
utilization for salted peanuts, at 162
million pounds, was up 4 percent.
STOCKS OF PEANUTS ANO SPECIFIED PRODUCTS CROPS OF 1983-84 AND
OF JANUARY AND JULY,
Period End in
Farmer Stock
Shelled Peanuts 2/
January
1984
1,507,187
562,786
48,688
748,505
2,304,380
1985
1,892,265
742,623
58,990
987,689
2,938,944
July
1984
8,758
435,512
23.322
579,231
611,311
1985
I/ Excludes
stocks on
farms.
Includes
stocks owned
by
or held
i~r
account
of
CCC
in
commerci a l storages. Farmer stock on net weight basis. 2/ Includes shelled edible and
shelled oil stock. 3/ Actual farmer stock, plus roasting stock, plus shelled peanuts
X 1. 33.
FARMER STOCK PEANUTS ON llANO AT THE END OF JANUARY AND JULY, CROPS OF 1983-84 AND 1984-85 1/
Period End in
Commercial Stocks
January
1984
265,213
1,176,203
65,771
71,333
1,435,804
1985
288,966
1,532,788
70,511
259,144
1,633,121
July
1984
5,344
1,062
2,352
0
8,758
1985
1/ Excludes stocks on farms. Includes stocks owned by or held tor account of CCC in
commercial storages. Farmer stock on net weight basis.
WAGE RATES FOR HIRED WORKERS, FOR SELECTED STATES AND REGIONS,
JANUARY 6-12, 1985 1/
State and
Region
Tvpe of Work
I Field &
1 l I Field Livestock Livestock 2/
Supervisory
Other
Method of P!!Y
I Piece-J
Hourly Rate Other
Dollars per Hour
Fla.
5.04 4.41
4.99
7.69
5.10
4.50
5.73
6.00
So. Plains 3/ 4. 15
4. 15
4.15
6.34
4.93
4.69
5/
4.84
Mount. III 4/ 4.68
4.26
4.48
6.52
4.79
4.19
5.94
5.31
Calif.
5.30
5.50
5.33
7.90
6.00
4.83
6.40
6.75
llaw.
6.36
5/
6.37
11. 11
8.19
6.94
5/
10.38
1/ Excludes agricultural service workers. 2/ Wage rates of field and livestock workers
combined. 3/ Includes Okla. and Tex. 4/ Includes Ariz. and N. Mex. 5/ Insufficient
data for this category.
7
Commoditv
COLD STORAGE STOCKS, January 31, 1984
Butter Cheese, Natural Eggs, Frozen Fruits, Frozen Fruit Juices, Frozen Meats, Red
Beef, Frozen Pork, Frozen Poultry, Frozen Turkeys, Frozen Vegetables, Frozen Potatoes, Frozen Peanuts, Shelled Peanuts, In Shell Pecans, Shelled Pecans, In Shell
510,638 1,202,216
10,972 616 , 467 1,088,224 692,899 338,014 295,114 276,646 161,467 1,676,298 754,803 309,582
22,194 22 ,054 94,569
UNITED STATES, December 31,
1984 \,000 Pounds
296,550 986,221
13,392 690,528 964,935 695,967 357,743 274,103 266,796 125,320 1,857,392 892,287 328,509
31,490 20,068 64,045
JANUARY 31, 1985
January 31,
Percent of
1985
Jan. 1984 Dec. 1984
Percent
270,144
53
91
963.229
80
98
15.000
137
112
630.656
102
91
1,105,463
102
115
719. 10'1
107
106
378.163
112
106
291.109
99
106
281.210
102
105
125.401
78
100
1.657.787
99
89
891.468
118
100
385.763
125
117
37.418
169
119
24.551
111
122
76,009
80
119
Q>orgta Crop Reporttng Service
Stephens Federal Bldg.
Suite 320 Athens, Georgia J0613
SECOND-CLASS POSTAGE PAID AT ATHENS, GA 30613
1::1 11
Aif00.(1
t'l
~f OR CIA
FARM REPORT
March 26, 1985 GFR-85-Volume 5
Received
APR 0 7 1985
DOC UM NTS
UGA LI BRARI E~
GEORGIA - CROP REPORTING SERVICE
stephens Federal Bldg. Suite 320 Athens, Georgia 30613 Phone : (404) 546-2236
IIIGHLIGHTS:
10 QUARTERLY STATES DOWN 1 PERCENT
March 1 Hog & Pig Inventory Floriculture Monthly Poultry Ga. Annual Hatchery Product i on Annual Livestock Slaughter Monthly Livestock Slaughter Milk Production Cattle on Feed Cold Storage
GEORGIA IIOG I~VENTORY SF.TS NEW !.OW
Inventory of a ll hogs and pig s on Georgia
fa rm s o n :-lar c h 1 , 198 5, t o t aled 1,1 50,000
head , 8 percent les s than a yea r ea rl ier
and a new all time record low. This new
rec ord low inventory breaks the previous
record of 1,200,000 head set just l a st
quarter. Hogs kept for breeding, also a
record low at 160, 00 0 head, is 11 per c ent
less than a year ago and 2 percent below
last quarter.
Market hog inventory
totaled 990,000 head, 7 percent below
last vear and 5 percent below De c ember 1,
1984 . .
The December 1984-February 1985 pig crop
at 432 , 000 head, is down 6 percent from the same period a year earlier. There were 60,000 sows that farrowed during December-February, 9 percent less than
the previous year. Pigs saved per litter averaged 7.20, compared to 7.00 pip,s saved per litter a year ago.
Georgia producers intend to have 66,000
sows farrow during March-May 1985. If
these intentions are realized , farrowings
will be 14 percent less than the actual
farrowings
during March-May
1984 .
Producers also expect 66,000 sows to
farrow durinp, June-August 1985, 8 percent
below the actual farrowings during the
same period in 1984.
Inventory of all hogs and pigs on March
1, 1985 in the 10 states conducting
quarterly hog surveys is estimated at
39.5 million head, 1 percent below last
March 1 . This is 6 percent below March
1, 1983 and the lowest March 1 inventory
since 1976. Breeding inventory, at 5.22
million head, is 4 percent less than last
year and 13 percent less than March 1,
1983.
This is the lowest March 1
breeding herd inventory since 1973, when
estimates for these comparable 10 states
became
available.
Market
hog
inventory, at 34.3 million head, is
1 pe rcent below a year earlier and 5
percent below two years ago.
The December 1984-February 1985 pig crop was 14.5 million head, 2 percent above the corresponding period last year but 9 percent below two years ago. There were 1.94 million sows that farrowed during the quarter, a decrease of 1 percent from
the year earlier quarter.
Sow farrowings averaged 7.51 pigs per litter compared with 7.27 last year and 7.45 two years ago. The litter rate is the highest of record for a December-
February quarter.
Hog producers in the 10 quarterly states intend to have 2.37 million sows farrow during March-May of this year. If these intentions are realized, farrowings would total 5 percent less than the actual number for the comparable period of 1984. Farrowing intentions for June-August are
2.20 million head, 3 percent below actual farrowings for the same period of last
year.
Agri.eul.t:ural St:at:i.st:ic:lan aud Georgl.a Depart:.ent: of Agri.cult:ure
GRF-85-Vol. S
HOGS AND PIGS : INVENTORY NUMBER, SOWS ' FARROWING AND PIG CROP
GEORGIA AND 10 QUARTERLY STATES 1/ 1984 and 1985
10 States
Georgia
1985 as 7.
Item
1984
1985
of 1984
1984
1985
1,000 Head
Percent
1 ,000 Head
March 1 Inventorv
All Hogs and Pigs
40,070
39,530
99
1,250
1,150
Kept for Breeding
5,446
5,215
96
180
160
Market
34,624
34,315
99
1,070
990
1985 as 7. of 1984 Percent
92 89 93
Market Hogs and Pigs
by Weight Groups
Under 60 Pounds
12,437
12,561
101
433
401
93
60-119 Pounds
8,561
8,427
98
289
271
94
120-179 Pounds
7,769
7,580
98
221
204
92
180 Pounds & Over
5,857
5,747
98
127
114
90
Sows Farrowing December 2/-February March-May December 2/-May June-August September-November June-Novembt!r
1 '964 2,481 4,445 2,259 2,316 4,575
1,935 3/2,366 4/4,301 3/2,196
99
66
60
91
95
77
3/66
86
97
143
4/126
88
97
72
3/66
92
68
140
Pig Cro12
December 2/-February 14,288
14,538
102
462
432
94
March-May
18,814
554
December 21-May
33,102
1,016
June-August
17. 158
511
September-November
17,420
'83
June-November
34,578
994
Pigs 12er Litter
Number
Number
December 2/-February
7.27
7 . 51
103
7.00
7.20
103
March-May
7.58
7.20
December 2/-May
7.45
7.10
June-August
7.60
7.10
September-November
7.52
7. 10
June-November
7.56
7.10
1/ GA , IL,IN,IA,KS,MN,MO,NB,NC,OH. 2/ December preceding year. 3/ Intentions. 4/ Intentions
for March-May.
The Georgia Far~ Report IISSN-Q744-7280) Is published s~l-~nthly by the Georgia Crop Reporting Service, Stephens Federal Building, Athens, Ga. 30613, Larry E. Snipes, Statistician In Charge. Second class postage pa id at Athens, GA. Subscription fee liO per year ""cept frH to data contributors. Subscript ion Information available frOM: Georgie Crop Reporting Serv ice, Stephens Federal Building, Suite 320 Athens, GA. 30613 Telephone: (404) 546-2216.
2
GEORGIA RED MEAT PRODUCTION
Commercial red meat production in Georgia totaled 30 . 0 million pounds during February 1985. This is down 5 percent from Januarv 1985 and down 20 perc ent from February 1984 .
The number of cattle slaughtered by c ommercial plants in Georgia during Februarv totaled 19 thousand head. This is 2 percent less than the previous month and 1 percent less than February 1984. The total live weight was i7.0 million pounds with an average of 898 pounds per head.
There were 125.6 thousand head of hogs
slaughtered in Georgia's commerical
plants during February.
This is 5
percent less than the previous month and
26 oercent less than Fehruarv 1984. The
total live weight was 29.2 million pounds
and an average of 233 pounds per head.
U.S . RED MEAT PRODUCTION
Commercial red meat production for the
United States during February 1985 totaled 2.9 billion pounds, down 5 percent from last year. (Commercial red meat production includes slaughter in Federally inspected and other plants, but excludes animals slaughtered on farms.)
Beef production totaled 1.8 billion
pounds.
Total head killed was 2.8
million and live weight averaged 1,087
pounds per head.
Veal production was 37 million pounds. Calf slaughter of 253.3 thousand head averaged 245 pounds live weight. Pork
production during tqe month totaled 1.1 billion pounds. Ho gs killed totaled 6.4 million head. Average live weight tor the month was 242 pound~.
Lamb and mutton production was 28 million pounds. Head kill at 483.6 thousand was down 6 percent and average live weight
was 114 pounds.
2_e_ecies
Georgia Cattle Calves
llo~s
Sheep & Lambs
GEORGIA ,\ND UN ITED STATES LIVESTOCK SLAUGHTER 1 /
Number Slaughtered
Average
1985
Jan.-Feb.
Live Weight
Februarv
as f. of '85 as f. of
February
1984
1985
1984
1984
1984
1985
1,000 Head
Percent
Percent
Pounds
19.1
19.0
99
1.3
1.4
108
169.8
125 . 6
74
97
904
898
124
342
356
74
230
233
100
Total
Live Weight
February
1984
1985
1,000 Pounds
17,295 452
39,027
17,018 507
29,240
United States
Ca ttle
2,971.1 2 , 776 .4
93
100
1 ,074 I ,087 3,191,698 3,016,714
Calve s
255.0
253.3
99
102
240
245
61,222
62,043
JIOP,S
6,81!.1 6,39fl.6
94
98
241
242 l,fl40,986 1,546,202
=S~h~e~e~p~~&~L~a~m~b~5~--~5~6~1~~3____~4~8~)~..~6~----~8~6__________~9 3
II 5
114
64,484
55,371
1/ Includes slaup,hter under Federal Inspection and other commercial slaughter, excludes
farm slaughter.
COMMERCIAL RF.ll MEAT AND LARD PRODUC110N: liNITE!l STATES WITH COMPARISONS 1/
February
1985 as f.
Jan.-Feb.2/
1985 as f.
Kind
1984
1985
of 19114
1984
1985
of 1984
Million Pounds
Per ce nt
Million Pounds
Percent
I, 859
1 '768
95
3,772
3,834
102
Veal
36
37
103
76
79
104
Por k
! ' j h~
l , I 05
95
2,400
2,386
99
Ln.mb & Mutton
32
28
88
63
60
95
Total Red :-len.t
3,092
2,938
95
6' 311
6,358
101
Lard 3/
73
70
96
I 51
148
98
1 / FIRsed on pa c kers dr<>ss '-"eigh ts and excludes farm slaughter. 2/ Acc umulated totals
based on unro11nded data. 3/ Pre liminar y lard production includes rendered pork fat.
3
GEORGIA BROILER lli\TCII UP
The February hatch of broiler type chicks, at 53.6 million was 7 percent less than the previous month but 2 percent more than a year earlier.
U.S. BROILER HATCH UP
GFR-85-Vol.5
The February hatch of broiler type chicks at 364.6 million was 9 percent less than last month but 2 percent more than a year earlier.
POULTRY HATCHING AND PLACEMENT--FEBRUARY 1985
?. of
?. of
Item
Feb.
Jan.
Feb.
year
Jan. thru Feb.
year
1984
1985
1985 ago
1984
1985
ago
--Thousands--
--Thousands--
Pullet Chicks Placed
Domestic (U.S.) 1/
Broiler Type
2,977
3,471
3,017 101
6,179
6,488
105
Egg Type
209
168
208 100
403
376
93
Chicks Hatched
Broiler Type
Georgia
52,520
57,615
53,609 102
107,367
111,224
104
United States
356,503 400,832
364,599 102
726,990
765,431
105
Egg Type
Georgia
3,942
1,867
1,966
50
7,669
3,833
50
United States
37,451
28,283
28,461
76
74,374
56,744
76
Turkeys
Poults Placed
u.s.
15,304
15,493
16,294 106
2/70,075
2/75,246
107
1/ Reported by leading breeders, includes expected pullet replacements from eggs
sold during the preceding month at the rate of 125 pullet chicks per 30 dozen case
of eggs. 2/Turkey poults placed Sept. 1984-Feb. 1985.
COMMERCIAL POULTRY SLAUGHTER 1/ FEBRUARY 1985
?. of
f. of
Item
Feb.
Jan.
Feb.
year
Jan. thru Feb.
year
1984
1985
1985
ago
1984
1985
ago
- - -Thousands- - -
- - -Thousands-
Young Chickens
Georgia
47,527
42,869
49,124
103
89,931
91,993 102
United States
323,502
358,227
323,530
100
663,743
681, 757 103
Mature Chickens
Light Type U.S.
9,921
18,450
13,718
138
20,315
32' 168 158
Heavy Type U.S.
3,022
3,031
2,241
74
5,674
5,272
93
Total U.S.
12,943
21 481
15,959
123
25,989
37,440 144
Total All Types, Ga. 2,768
4,308
3, 44 1
124
5,661
7,927 140
Percent Condemned
Young Chickens
Georgia
1.4
1.7
2/1.4
2/1.7
United States
1.5
1.8
2/1.5
2/1.8
1/ Federally inspected slaughter data as collected by Meat and Poultry I nspec tion
Program. Current month data estimated by Market News Serv ice. 2/ Januar y-Januar y
condemnations.
4
Week Ending 1984
.Jan. 7 14 21 28
Feb . 4 II 18 25
Mar . 3 10 17 24 31
Ap r . 7 14
21 28
May
5
12
19
26
J une 2 9
16 23 30
July 7 14 21
28
Aug. 4 11 18 25
Sept. I 8
15 22 29
Oct. 6 13 20 27
No v. 3 10 I 7
24
Dec. I 8
15 22 29
TOTAL
15,308 15,242 15,39 5 15,503
15 ,589 15,226 15,400 15, 7 33
15 , 8 30 15, 9 72 16,025 IS, 471 i5,95R
16 , 226 16,196 16,092 IS ,336
16,190 16 ,214 16,375 16,041
16,252 16,216 16 ,172 15,247 15 . 192
16,151 16,172 15,926 16 , 014
15 ,7 00 15,756 15,609 15,405
15,277 14, 6 51 13,546 15,047 15,624
15,22 9 15,436 12,)20 14,244
15,480 16,269 16,218 16 , 271
16,273 IS, Sl2 I 5 , 5 75 16 ,117 16,408
809 8 3 1
12,0.73 12,5 24 12 , 355 12,542
12,477 12,649 12,720 1 2,824
12,6 I 5 12, 7 40 12,968 13.217 13.361
13,40 8 12,957 13 , 293 13, 4 '18
13,387 13,273 12,630 13,312
13,373 13,508 13,190 13,38 9 13,354
13,386 12,472 12,300 13,193
13 , 233 13,043 13,126 12 , 794
12,98 7 12,744 12,584 12,424 II ,877
11 , 021 12,149 12,611 12,360
12,498 10,181 II , 576 12,S20
I 3, 159 13,116 13. !56 11, IS 7 12,548
6fo3 852
11 , 888 12,262 12 , 180 1 2,307
12,257 12 , 391\ 12,44 2 12 , 536
12,354 12 , 502 12,740 12,965 13 . 068
13,098 12.618 13,047 I 3. 168
13,088 13,048 12,380 13,024
13 , 100 13,175 12,949 13,122 13. 105
I 3, 128 12.223 12,070 12,893
12,985 12,846 12,857 12,547
12,724 12,49 7 12,288 12. 135 11,687
10,790 11,880 12,335 12. 120
12.218 9,9'13
11,304 12,3S8
12,'103 12,1189 12.918 12,843 12.421
650 673
1\ 19 974 i7fo 790
702 8 45 7/lfo 7 2i /12 .:0
777 I ,070
816 l\fo3
8.00 11411 953 BD
881 882 1,098 81'1 7'18
912 999 755 835
839 I , 015 I ,041
838
884 864 978 914 934
722 875 I, 135 887
82" /lifo 889 IJS 4
887 '18 0 I , 087 920 9 2i
4S 77'1
505 5 71 )05 554
505 539 Sfo'; 609
51\2 600 5'!1 )7 1 n.:.l\
585 585 578 638
554 632 588 61 5
630 621 588 615 629
635 57) 607 625
628 584 631 606
625 564 655 625 :.03
559 600 645 639
579 .. '14 544 S0 2
622 '>92 611 fo84 467
10 504
12,097 12,663 12,566 12. 511
12,571 12,833 12,653 12.7 17
12,474 12,747 12,<J:\) 11, 119 11,2 44
13,29U 13. 103 13,285 11,393
13 , 374 13 ,264 12,745 11,262
13,35 I 13,436 13,459 13,326 13,274
13,405 12,647 12.218 13 . 103
13,196 13,277 13,267 12,779
12,983 12,797 12.611 12,424
12.~ 1 11
10.953 12, I S5 12,825 12,:\68
12,463 10,315 II, 649 12,810
13. 168 13,277 13,394 13 '079 I 2 , 117 5
fo65 948
I, 166 1,214
963 I, 187
I, 417 1. 239 I ,47 4 I ,.Oj7
1 ,435 I, 231 I, 312 I, 399 I, 341
I, 362 I, 144 I, 333 I, 509
I, 478 I, 358 I, 362 I , 542
I, 265 1,141 I , 331 I ,021
780
753 697 869 886
720 766 b6'1 454
785 511 409 332 20fl
59 5 704 480 545
487 )04 396 428
471 282 537 611
- 7- ., '
4 1! 526
v2e
Ch icks l l a t , hP.ci
8"> 816 784
88~
928
iLt)
91!1 I , I 3(1
974 I, 19"! I . 128 I, I I 9
IJ-d
I ,U20 I, 0 1b I , 08" I ,1177
J. 076 1 t 0 15 I, I I 3 I ,130
I , 049 I ,045 I ,19 2
9b "l 878
9 52 774 604 57 3
526 586
6) :..........
562 523 2911
) .,. (, .. ()il
282 2 )7 !58
4~)
5~ 1
1'1 2 11)2 1'11
3'12 10(1
3 ~0 37 ~
:!26
38 r'n
5
GEORGIA FLORICULTURE SURVEY REINSTATED
Following a 3-year hiatus, the surveying
of production of seven floriculture
commodities produced in Georgia by
commercial growers (defined as $10,000 or
more of sales) has resumed. The seven
commodities
surveyed
we r e
potted
geraniums, potted hydrangeas, potted
lilies, potted poinsettias, flowering
bedding
transplants,
vegetable
transplants,
and non-woody foliage
plants. The aggregate wholesale value of
production for the seven commodities in
1984 totaled $14.32 million, compared
with $8.15 million in 1981, a 76 percent
increase. Individual 1984 values were:
geraniums - $1.01 millioni hvdrangeas$0.16 million; lilies - ~0.3~ million;
poinsettias - $2.40 million; flowering
transplants - S3.96 million; vegetable
transplants
$1.71 million and foliage
plants- $4.75 million.
U.S. 1981
FLORICULTURE
UP 23
GFR-85-Vol.S PERCENT SINCE
The 1984 equivalent wholesale value of
all sales of the 17 floriculture crops
surveyed climbed 23 percent since the
last survey in 1981 to a total of $1.26
billion. Not all states conducted a
floriculture survey, and not all of the
17 crops were surveyed in the. states that
had a survey.
Of the $234 million
increase since 1981, $99.5 million was
a ccounted for by inc reased value of
folia ge plant sal e.s . Foliag e. and be.dding
plants toge ther ac counted f or 56 percent
of the. total wholesale value. All crops
showed increased value over the 1981
c rop,
exce. pt standnrd
c arnations,
standard chrysanthemums, and pompon
c hrvsanthPmums.
For
additional
information, c ontac t La rrv Snipes at 404'>4 6-2236.
U.S. EGG PRODUCTION AND LAYF.R NUMBF.RS UP
GA. EGG PRODUCTION DOWN FROM LAST YEAR
The State's laying flocks produced 336
million eggs during February 1985, down 6
percent from last year.
February
production included 246 million table
eggs and 90 million hatching eggs.
The average number of all layers for February was 18.2 million, 3 percent less than a year ago. The total consisted of 12.8 million layers for table eggs and 5.4 million for hatching eggs. Eggs laid per 100 layers during February averaged 1,847 compared with 1,908 for the
previous year.
Egg product i on for February totaled 5.29 billion and included 4.73 billion table or commercial type eggs and 565 million hatching eggs. Production per 100 layers for the total laying flock during February was 1,887 eggs. February 1985 consisted of 28 days, compared with 29 days a year ago.
All layers on March 1, 1985, totaled 279 million, 1 percent greater than the 277 million on March 1, 1984. Layers on March 1 consisted of 246 million for table eggs and 33.0 million layers for hatching type eggs. Rate of lay on March 1 for all layers averaged 68.0 eggs per 100 layers, compared with 66.8 a year earlier.
~UM BER OF LAYERS A01_E GG f'R Of?_lX:TIO\' I FF.BRUARY i-9'-'R_;_:_S_ _ _ _ _ _ __
No. Layers on
Eggs per 100
Total Eggs Produced
l!nnri-Feb.
----~1-~n_v~e-=r-'~ s -~F_e~h_.,_ _ _ _ _ ___ nurinp FPb.
198 4
1985
1984
1985
1984
1985
Thousands
!'lumber
:-fill ions
Georgia
ilat ch in~
Other ""'""lnl (;P.orP-i a Total U.S.
'),066
5,372
J 3. 641
12,820
IR,707
18, 192
2 7 6, 6_n_-'-3_ _ _2_~0, 38____
1, 807 I, 946
l '908 _1_,__?~ ?..__
1 '683 1 1 918 I ,847 I 887
92 265 357 5 323
90 246 336 5 292
EGGS I ~ INC CBATORS 1 M~RCH 19g5, U~ ITED STATES
:: e m.'------------------1_9_?~------- ___
I 98 5
--Tnou., a nds--
of Y ear~
<. hickens
!':P,gTyp<'
41 , 380
31,'+42.
i f>
Rt-oiler Tvpe
326 , l i7
344;750
106
~:J rk e"s ------------------------=~~2~-~~~l-'4-'---------------------~2~4~0~7~5--------------------------~1~0~6~-----
6
~SORGrA ~ILK PROD C CTIO~ DOW ~ 4 PERCE~T
U.S. MILK PRODUCTION DOWN 3 PERCENT
Georgia's dairy heros produced 109 mi llion pouncis of milk durinP, February 198). 4 percent less than last vear and 1 percent below last month.
The number of milk cows averaged 118,000
head durin~ February, 6,000 less than a
vear ago.
~ilk production per cow
av~ra~~ci 920 pounds for FPbruary,
compared to 9i5 pounds last vear and 9 40
pounds ~er cow last month.
~ilk production durin~ February 1985 totaled 10.6 billion pounds, 3 percent below February 1984 and 6 percent less than last month. February production per cow averaP,eri 977 pounds, 18 pounds less than a year earlier.
'o tal mil k c ows averaP,eci 1n.~ million head, i percent less than February 198~.
"!!!_K r:ows ,,:-;n MILK PRODUCTION FF.RRUARY 1984-1985
Georgia
United States
I tem
:jni t
:984
1985
1984
198)
l"o. Milk Cows on Farms 11 Thous. Head
124
118
10,910
10,811
."'ilk ? roriu c t i.on per Cow 21 Pounds
915
920
995
97 7
Total ~ilk Production 2/
Mil. Lbs.
113
109
10 855
10,566
i I I n c ludes drv C OWS!' f!xr.ludes heifers not yet f re sh . 2/ Ex c ludes milk sucked by ca lves.
CATTLE ON FEED IN 7 STATES UP S PERCENT FROM A YEAR EARLIER
Cattle and calves on feed March
for slaughter market in the 7 states
preparing monthly estimates totaled 7.88
million head, up 5 percent from a year
ago and 4 percent above March 1, 1983.
Marketings of fed cattle during
February totaled 1.54 million, down S
percent from last year but 3 percent
above February 1983.
Placements of cattle and claves on
feed during February were 1.34 million, 3
percent above last year and 15 percent
above February 1983. Net placements of
1.25 million were up 2 percent from last
year and 20 percent above February 1983.
Other
disapperance totaled
94
thousand head compared with 82 thousand
during February 1984 and 121 thousand
two years ago.
CATTLE AND CALVES ON FEEn, MARCH 1
1985 as
7. of
Item
1984
1985
1984
1,000 Head
On Feed Feb. 1 1/ 7,917 8,169
103
Placed on Feed
during Feb.
1,301 1,342
103
Fed Cattle
Marketed during
Feb.
1,621 1,540
103
Other Disappear-
ance during
Feb. 2/
82
94
115
On Feed Mar. 1
1/ Cattle and
1/ ca
l
v
7 e
s 1
51 o
5 n
7 877 feeJ are
105 animals
for
slaughter
market being
fed
a full ration of grain or other
concentrates and are expected to produce a
carcass that will grade good or better.
2/ Includes death losses, movement from
feedlots to pastures and shipments to
other feedlots for further feeding.
Species
- - --
Ca t t ] , . C.:.lvcs !logs Sheee
;\ NNCA L COMMF.RC:L\l. !.I VESTOCl< SL!\l]Gl!TER .
Geor11.ia
:"'umbe r
i\veraP,e
Tot al
of
Live
Li ve
!lead
we!P.ht
\J~"'..f'ht
1, 000
Pou nds
1. 000 Lbs.
242 .6
893
216,589
16 .9
34 3
j ,868 . o
230
5~82 4
.:.29,825
.8
100
84
GEORGIA i\~D
~u m ber
of !lend
1 , oou
37,51\1.8 3,297.3
85,168.] 61759. ()
UNITE D STATE S Un ited States
!\v era~e
Live Weight Pounds
l, 067 244 243 111
1984
Total Live Wei!'lht 1,000 Lbs. 40,0 1\ 4,6 65
804,687 20,727, 868
749 ,5 59
7
COLD STORAGE STOCKS 1 UNITED STATES. FEBRUARY 281 1985
February
January
February
Percent of
Commodity
1984
1985
1985
Feb. 1984 Jan. 1985
1,000 Pounds
Percent
Butter
532,499
277,277
284,475
53
103
Cheese, Natural
1,219,808
968,890
942,365
77
97
Eggs, Frozen
11,361
14,895
13,356
118
90
Fruits, Frozen
534,511
623,629
567,722
106
91
Fruit Juices, Frozen
1,309,852
1,195,625
1,413,312
108
118
Meats, Red
707,665
735,010
709,594
100
97
Reef, Frozen
332,460
375,138
352,943
106
94
Pork, Frozen
311,705
291,925
283,795
91
97
Poultry, Frozen
250,746
281,365
287,807
115
102
Turkeys, Frozen
145,767
124,111
128,928
88
104
Vegetables, Frozen
1,463,357
1,645,455
1,487,186
102
90
Potatoes, Frozen
783,905
900,007
939,052
120
104
Peanuts, Shelled
316,565
385,699
404,776
128
105
Peanuts, In Shell
21,255
37,402
41.349
195
Ill
Pec ans, Shelled
26,537
24,518
27,647
104
113
Pecans In Shell
115 409
77 610
83 682
73
108
Gf'Orga
r.c_~~~Sce;r;:v,arctelng
Stephens Federal BldK. Suite 320 Athens, Georgia l 0613
SECON D-CLASS POSTAGE PAID AT ATHENS, GA 30613
fi'/ DD.C; 1
~EO
FARM REPORT
April 2, !985 GFR-85-Volume 6
Received f\PR 0 7 '985
oocu I::..NTS
UG~ U BRf\R\ES
GEORGIA CROP REPORTING SERVICE
Stephens Federal Bldg. Suite 320 Athens, Georgia 30613 Phone: (404) 546-2236
HIGHLIGHTS Processing Vegetable Acreage Peanut Stocks and Processing Agricultural Prices Data Used to Compute Deficiency Payments
U.S. PROCESSI NG VEGETABLE ACREAGE UP FRACTIONALLY
Prospective plantings of the 5 major processing vegetable crops are up fractionally from last year. Processors plan to contract for [.39 million acres in 1985, just over 3 thousand acres more than were contracted last year.
Increased acreage is expected for cucumbers for pickles, sweet corn, and green peas. Fewer acres are planned for snap beans and tomatoes. Tomato tonnage harvested should ~e down 7 percent from last year if yield expectations are met.
SNAP BEANS:
Planting intentions of
2ll,OOO acres, down 2 percent from last
year.
SWEET CORN:
Planting intentions of
454,000 acres, up 2 percent from last
year.
CUCUMBERS FOR PICKLES:
Contracted
acreage at 93,000 acres. 3 percent above
last year.
GREEN PEAS: Expected acreage 366,000
acres, up ~percent from last year.
TOMATOES: Canning tomatoes are planned
for 272,000 acres, down 8 percent
from 1984.
FEBRUARY PEANUT STOCKS
Peanut stocks in commercial storage on
February 28, 1985, totaled 2.83 billion
pounds of equivalent farmer stock. This
total includes 1.66 billion pounds of
actual farmer stock. February millings
totaled 387 million pounds. Millings by
type were 74.0 million pounds of
VirgiDias, 289 million pounds of runners,
and 24.1 million pounds of Spanish.
Commercial processors utilized
107
million pounds of shelled edible grade
peanuts during February. Crushings for
oil, cake, and meal totaled 36.1 million
pounds during the month.
U. S. VISIBLE SUPPLY OF PEANUTS
l\T MONTH ' S END 1 /
July
Jan.
Feb.
Class
1984
1985
1985
(Million Pounds)
Farmers
Stock
9
1,892
1,661
Shelled
Peanuts 2/ 436
743
805
Roasting
Stock 3/
23
92
98
Total 4/
611
2,972
2,829
1/ Excludes stocks on farms. Includes
stocks owned by or held for account of
CCC in commercial storages. 2/ Includes
shelled edible and shelled oil. stock. 3/
Cleaned and uncleaned. 4/ Actual farmers
stock, plus roasting stoc k, plus shelled
peanu.ts X 1.33.
Agrl.culbara1 Sbltisticlan 8Dd Ceorpa Depart.ent of Agriculture
GEORGIA PRICES RECEIVED
Average prices received by Georgia farmers at mid March were mixed from the previous month. Corn, cotton, steers and heifers and calves were unchanged, wheat, all hogs, all milk and broilers were lower while soybeans, sweetpotatoes, beef cattle, cows, and all eggs were higher. The Georgia Prices Received All Commodity Index for March was 124 percent of the 1977 average unchanged from last month but 20 points below last year.
...
GFR-85-Vol.6 U. S. PRICES RECEIVED INDEX DOWN 1 POINT
The March All Farm Products Index of
Prices Received by farmers decreased 1
point from February to 134 percent of its
January-December 1977 average.
Lower
prices for hogs, cattle, oranges, milk,
and wheat were par tially offset by higher
prices for tomatoes, eggs, cotton,
potatoes, and sorghum. The Index was 11
points below a year ago.
PRICES RECEIVED BY FARMERS MARCil 15 1985 WITII COMPARISONS
Price
Geor~\a
United St ates
per
Mar.
Feb.
Mar. 15,
Mar.
Feb.
Mar. 15 ,
Commoditv
Un i t
1984
1985
1985
1984
1985
1985
Winter Wheat
$/Bu.
3.60
3.09
3.03
3.42
3.33
3.27
Oats
S/Bu .
1.82
1. 70
1. 71
Corn
$/Bu.
3.83
3. 00
2.99
3.21
2.62
2.63
Cotton
Ct./Lb. 66.6
53.5
1/53.5
70. 1
48.9
1/52. 5
Cottonsee d 2/
$/Ton
95.00
93.00
Tobacco
Ct./Lb.
3/ -
138.0
164.5 3/158.0
Soybeans
$/Bu.
7.63
5.74
5.81
7.68
5.75
5.78
Sweet po tatoes
S/Cwt.
17.60
2/18.20
18.60
19.50 2/18.00
19. 10
All Hay, bal ed 2/
$/Ton
79.40
75.40
72.50
Hogs
S/Cwt.
43.20
48.20
43.30
45.80
48.30
43.60
Sows
S/Cwt .
39.40
41. 50
40 .60
43.00
44. 10
40.90
Barr ow s & Gilts
S/Cwt.
43.80
48.60
43 .60
46.00
48.80
43 . 90
Bee f Cattle 4/
S/Cwt .
50.90
48.30
49.40
61.70
58.5 0
57.20
Cows 5/
S/Cwt.
41.50
39.40
41.70
41. 8 0
41 .10
41.40
Steers & Heifers
S/Cwt .
56.40
54. ll0
54.60
65.80
62.90
60.90
Calves
S/ Cwt.
54.60
59 .5 0
59 . 70
6 .1 . 70
65. 40
66.00
All Milk
$ /Cwt.
14.60
15.40
3/15.20
13. 20
13.70 3/13.5 0
Turke ys 2/
Ct. / Lb.
41.6
41.6
40.7
Chickens, Excl uding
Broilers
Ct./Lb. 32 . 0
2/12.5
11. 0
Com'! Broiler s 6/ Ct./Lb. 36.5
29. 0
3/28.5
37.8
30.:>
3/30.1
Eggs, All 7/
Ct./Do~
qR.1
?/fi4.~
~9.~
2/'>~.R
)7.6
Table
Ct./Doz 83.6
2/42.2
49.0
2/44.6
50.4
Hatching
Ct./Doz. 140.0
2/135.0
130.0
1/ First half of mon t h . 2/ Mid-month price. 3/ Entire month. 4/ "Cows" and "steers and
heifers" combined wit!'\ allowance where ne c essary for slaughter bulls. 5/ Inc ludes dairy cows sol d fo r slaughter. 6/ Livewei g ht equivalent pr i~ e for Geo~ g ia. 7/ Avera g e of all
eggs sold by farmers incl udinR hatching eggs sold at retailr
The Georgia Farm Report (ISSN-Q744-7260 l Is published sem i-monthly by the Georgia Crop Reporting Service, Stephens Federal Bul !ding, Athens, Ge. 30613, Larry E. Snipes, Stetlstlclen In Charge. Second class postage paid et Atnens, GA. Subscription t ee S10 per yeer except t ree to dete contributors . Subscription Inf ormation avell able from: Georgie Crop Reporting Servi ce, Stephens Federal Bul Iding Sui te 320 Athens GA. 30613 Tel~hone: (404) 546-2236,
2
PRICES PAID INDEX UNCHANGED FOR U. S.
CONSUMER PRICE INDEX
The Index of Prices Paid by farmers for commodities and services, interest, taxes and farm wage rates for March was 164 perc~nt of its 1977 average. The index was unchanged from a month earlier and a year ago. Increases from last month in the fuels and energy and family living indexes were offset hy decreases in feed, fertilizer and farm machinery components.
The February unadjusted c onsumer price index for all urban consumer (CPI-U) at 317.4 (1967 2 100) was 0.4 percent higher than in January and 3.5 percent above February 1984. On a sea s onally adjusted basis, the CPI-U was 0.3 percent above January. The apparel upkeep index was up 0.9 percent due mainly to a 1.0 percent increase in clothing prices. The food
and beverages index was up 0.5 percent
and both the medical care and housing
indexes were up 0.4 percent.
PRICES PAID BY F'ARMERS MARCH ll 1985 WITH COMPARISONS
Price
Georgia
United States
per
Mar. 15 F'eb. 15. Mar. 15,
Mar~. )5, F'eb. 15, Mat. 15,
Commoditv
Unit
1984
1985
1985
1984
1985
19115
Dairy F'eed 16 /.
$/Ton
215.00
176 . 00
179.00
199.00
174.00
172.00
Dairy Feed 18 /.
$/Ton
220.00
175.00
175.00
210.00
177.00
175.00
Dair v Conct . 32 ~
S/Ton
:?1i~.nn
225.()()
20~.nn
283.00
23 7.nn
230.00
Hog F'eecl 14 /. -18 ;~
S/Cwt.
12.50
10.50
10.5 0
11.80
9.72
9.5<)
Hog Conct. 38 ~ -42/.
S/Cwt.
17.00
13.00
13.00
16.00
12 .90
12 . 50
Beef Cattle Conct.
32 7. -36 %
S/Cwt.
14 . 00
12.00
12. 00
13.40
11.00
10.90
Cottonseed Meal 41% S/Cwt .
16 . 00
12.00
12.50
15.90
12.30
12.20
Soybea n Meal 44/.
ar an
S/Cwt. S/Cwt .
14 . 50 II . OtJ
12. 00 II. 00
11 . 50 11 . 00
14.50 10.60
11.00 9.81
10.60 9.72
Middl ing s
S/Cwt.
9 . 90
10 . 50
10.50
10.20
9. 13
9.18
Corn Meal
S/Cwt.
10.00
9.40
9 . 40
8. 79
7.54
7.58
Broiler Grower
S/Ton
205.00
250.00
245.00
242.00
215.00
214.00
Laying F'eed
$/Ton
210.00
181.00
16 5.00
214 .00
189. 00
18 6 . 00
Chick Starter
$/Ton
240.00
215.00
200.00
239 . 00
209 . 00
209 . 00
Broiler-F'eed Ratio 1/ Lbs.
3.6
2.3
2.3
3. 1
2.8
2.8
Hog-Corn Ratio 2/
Bu .
11.3
16. 1
14. 5
14 . 3
18.4
16.6
Milk-F'eed Ratio 3/
Lb s.
1. 36
1. 75
l. 70
1.33
l. 57
l. 57
~eed Ratio 4/
Lbs.
9.4
7. l
8. 4
7. 4
S.h
6.2
1/ Pounds of broiler grower equal in value to 1 lb. broil e r live wei g ht. 2/ Bushels cf
corn equal in value to 100 lbs. of hog live weight. 3/ Pound s of 16% dairy f e ed equa l
i n value to 1 lb. whole milk. 4/ Pounds of laying feed equal in value to 1 doz. eggs.
!!\DEX :-i lll'!BF.RS- - GEORGL\ ' A::-10 UNI TED STATES
146
144
12 4*
135
136
121,.
156
15 i
127
14 4
145
135
164
164
164
Ill\
88
82
!/M i d-month index in c lud in g inte r est , t a x es and f a rm wa ge rates . 2/ Rat i o o~ Ind ex o f
P r i c es Rece ived to Index of Pr ice s Pn id. In ter est , Taxes and Farm \/age Rates .
* Revised .
3
:1!\T \ USED TO CONPCTE OF.FICIENCY PAYM ENTS
For most of the c r ops in the farm proP, ram, the prices c oll ec ted by th e Statis t ica l Reporti~~ Service ( SRS ) o f USO!\ ar e us e d in t he cc mnutation of d e lici e n ..: y payment s a nd as a - par t of th e dP. Le rminatio n of re l e'> se a nd call leve l s for th e far me ~ g r ai n reserve program.
' f<> nt hlv erai n p r ice s nrv e~s are c ondu c ted bv t h ~ S t a te Statistlcal Offices of SRS i!t 35 S l ate s which i.nclude the major
pr oduc ing State s fo r eac h commodity. Cr op s in t he surv ey iaclude wheat, -:o rn,
oats , barley, soq>,hum g1ai.n, soybeans, fla xs e ed a nd sunflower. !\ s a mpl e of firms or individuals who purchase grain f rom farmers is as ked to report th ~ total quantity of grai n they purchased from farmer s during the pr e vious month and the value of this grain .
Each Slate's s Rmp l e i s stra tifi ed by s ize of o peration for s a mpling efficiency. T.nq~e fir ms are sampled mo re frequ e ntl y than sma ller firms. Each firm's reported p r ice i s wei g hted by the quantity o f g r ai n purchased by that firm during the month and expanded by its sampling fra c tion. Each state's average pri c e is wei ~ ht e d by the total expanded quantity for the State to calculate the U.S.
a v eraee price. This provides a wei e hted average pr1ce which is based on actual ma rketings during the month.
The published entire month average prices are u sed for the calculation of the 5-
mo nth a v e rage price received by farmers tor wh ea t, h<trl ev , oa ts , c orn and sorp,hum g r ai n. ~or co~n , t he weigh ted 5-month a vf' r aec pri ce is d e termined by using th es e entire month prices for the f irst 5 marketing months (Oct. -Feb.). These prices a re weighted by the percent sold dtlring each of these 5 months . Percents sold are based on the survey monthly expanded quantiti es sold as a perc ent
o f total sales during the 5-month period.
The d efici cnc v payment per bushel is
cal c ulated
' by
the
Agricultural
Stabilization and Conservation Service.
P.ayme nt will be made only if the national
wc iR hted average ma rket price r ece ived by
far mers during the first 5 months of the
marketing year is below the target price.
The payment rate is determined by the
d it ference b et wee n the target pri c e and
th e highe r of the market price or the
loan l evel .
4
REPORT
April 30, 1985 GFR-85-Voluae 8
HIGHLIGHTS Poultry Summary Livestock Slaughter U.S. Farm Income Update U.S. Dairy Summary
__AY 1 1985
UU~UMt:.l.. l S
UGA L1 R ES
GEORGIA CROP REPORTING SERVICE
stephens Federal Bldg. Suite 320 Athens, Georgia 30013 Phone: ( 404) 546-2236
Cattle on Feed
Cold Storage Peanut Stocks & Processing
GEORGIA EGG PRODUCTION DOWN FROM LAST YEAR
U.S. EGG PRODUCTION UP BUT LAYER NUMBERS VIRTUALLY UNCHANGED
The State's laying flocks produced 375 million eggs during March 1985, down 3 percent from last year. March production included 272 million table eggs and 103 million hatching ~ggs.
The average number of . all layers for March was 17.5 million, 6 percent less than a year ago. The total consisted of 12.1 million layers for table eggs and 5.4 million for hatching eggs. Eggs laid per 100 layers during March averaged 2,143 compared with 2,060 for the previous year.
The Nation's laying flocks produced 5.93 billion eggs during March 1985, up 2 percent from the 5.79 billion produced a year ago.
Production included 5.29 billion for table or commercial type eggs and 640 million for hatching eggs. The total number of layers during March averaged 278 million, virtually unchanged from a year ago. March egg production per 100 layers for the total laying flock was 2,138 eggs compared with 2,084 eggs for March 1984.
All layers on April 1, 1985 totaled 17.3 million, down 9 percent from 18. 6 million a year ago. The rate of lay on April 1, 1985 for all layers averaged 70.9 eggs per 100 layers compared with 66.9 on April 1, 1984.
All layers on April 1, 1985, totaled 276 million, 1 percent fewer than the 279 aillion a year earlier. The 276 million layers consisted of 243 million for table or commercial type eggs and 33.0 million for hatching eggs. Rate of lay on April 1, 1985, for all layers averaged 69.7 eggs per 100 layers, compared with 67.6 on April 1, 1984.
Acrlcaltura1 Statf.8Uclaa 811111 Georpa ))epar'mea.t of Acriculture
Georgia Hatching Other
Total Georgia
Total u.s.
GFR-85-Vol.8
NUMBER OF LAYERS AND EGG PRODUcTION, MARCH 1985 .~
No. Layers on
Eggs per lOO
Total Eggs Produced
Hand-March
Layers-March
During March
1984
1985
1984
1985
1984
1985
Thousands
Nuber
Millions
5,158 13,527 18,685 277,863
5,366 12,133 17,499 277.504
2,003 2,083 2,060 2,084
1,928 2,241 2,143 2,138
103 282 385 5,792
103 272 375 5,932
Item
Chickens Egg Type Broiler Type
Turkeys
EGGS IN INCUBATORS, MARCH 1, UNITED STATES
1984
Thousands
1985
44,160 333,990
25,564
36,307 346 , 734
25,737
% of Yr. Ago
82 104 101
POULTRY AND EGGS CONSUMPTION OF YOUNG CHICKEN GAINS
In 1984, consumer s used more young
chicken meat (broiler-fryers and other
young birds such as roasters and capons)
than ever before. Per capita use is
currently est i mated at 52.9 pounds, up
from 50.8 pounds in 1983. The 1984 per
capita figures will be final ized when
total 1984 broiler production is reported
in April.
Consumption will likely
continue to expand in 1985, with per
capita use expected to incr e~ se another 3
pounds. 1/
BROILERS
Almost all the signals to broiler
producers are for i ncreased production in
1985--lower feed costs, less pork, and
relativelr strong broiler prices given
supply
evels .
With the expanding
general economy, demand for broilers will
likely remain strong.
Strong prices in 1984 and favorable net returns have encouraged broiler producers to expand their capacity to produce. The number of pullets entering hatchery supply flocks has been above year-ago
levels since the second quarter of 1984. 1/
PER CAPITA DISAPPEARANCE ABOUT THE SAME FOR EGGS
Larger egg production in 1984 did not
boost p~r capita disappearance. Last
year ' s 1ncrease in egg production was
about the same as the population
increase . Al so, more eggs were used for
hatching in 1984 and stocks increased.
However, total disappearance rose with
additional egg imports and a decl ine in
egg exports. Strong e$g prices in firsthalf 198 4 stimulated 1mpor ts of eggs and
the strong dollar tended to discourage
exports.
Shipments of eggs and egg
products to Puerto Rico and the Virgin
Islands were up about a million dozen
from 1983. 1/
CONTINUING TROUBLE AHEAD FOR EGGS
The trend in decreasing per capita egg
consumption continues.
Consumption
peaked at 403 eggs per year in 1945.
There was another slight increase during
the Korean War in the early 1950's .
Since 1954, per capita egg consumption
has declined an average of 3.8 eggs per
year. If this trend were to continue,
per capita consumption would be 228 eggs
by 1990. !/Livestock and Poultry Outlook
and Situation Report-March 1985.
The Georgi~ F~rm Report (ISSN-074 4-7280 ) Is published semi-monthly by the Georgie Crop Reporting Service, Stephens Federol Bu l ldlr.g, Athens, Go, 30613, Larry E. Snipes, Stotlst lc lon In Charge. Second cl~ss post~ge p~ld ~t Athens, GA. Subscription fee SIO per year except free to deta contributors, Subscript ion lnfor~tl on av~ll~ble from: Georgi~ Crop Reporting Service , Stephens F eder~! Bulldlna Suite 320 Athens GA. 30613 Telephone : (404) 546-2236,
2
GA. BROILER HATCH UP , EGG-TYPE HATCH DOWN
The March hatch of broiler-type c hick s a t 6 1.5 mi llion was 7 percent more than a year earlier . Egg-type chicks hatched during March totaled 3.1 million, a decrease of 35 percent from a year ago.
U.S. BROILER HATCH UP, EGG-TYPE HATCH
DOWN
Egg-type chicks hatched duri n g March t otaled 37.0 million, a decrease of 19 percent f rom March 1984. The March 1985 hatch of broi ler-type chi cks , at 419 million, was 5 percent above March 1984.
POULTRY HATCHING AND PLACEMENT--MARCH 1985
% of
% of
Item
Mar.
Feb.
Mar. year
Jan. thru Mar.
yea~
1984
1985
1985 ago
1984
1985
ago
--Thousands--
--Thousands--
Pullet Chicks Placed
Do.estic (U.S.) 1/
Broiler Type
104
10,091
105 1
Egg Type
93
665
93
Chicks Hatched
Broiler Type
Georgia
57,698
53,609
61,485 107
165,065
172,709 105
United States
397,674 364,599 418,967 105 1,124,664 1,184,398 105
Egg Type
Georgia
4,801
1,966
3,123 65
12,470
6,956
56
United States
45,697
28,461
36,963 81
120,071
93 , 707
78
Turkeys
Poults Placed
u.s.
18 1 433
16 1 294
18 1 610 101
2/88 1 508
2/93 1856
106
1/ Reported by leading breeders, includes expected pullet replacements from eggs
sold during the preceding month at the rate of 125 pullet chicks per 30 dozen case
of eggs. 2/Turkey poults placed Sept. 1984-Mar. 1985.
COMMERCIAL POULTRY SLAUGHTER 1/, MARCH 1985
% of
% of
Item
Mar.
Feb.
Mar.
year
Jan. thru Mar.
year
1984
1985
1985 ago
1984
1985 ago
-Thousands-
- - -Thousands- - -
Young Chickens
Georgi a
50,870
49,124
54,384
107
147,842
146,377 99
United States
351,345
315,659
365,519
104 1,015,088 1,054,507 104
Mature Chickens
Light Type U.S.
11,602
13,319
13,829 119
31,837
46,217 145
Heavy Type U.S.
2,595
2,641
3,237
125
8,349
8,909 107
Total U.S.
14. 197
15,960
17,066 120
40,186
55,126 13}-
Total All Types, Ga. 2,569
3,441
3,205
125
8,385
10,954 131
Percent Condemned
Young Chi ckens
Georgia
1. 4
3/NA
2/1.4
3/NA
United States
1.5
1.9
2/1.5
2/1.8
1/ Federally inspected slaughter data as collected by Meat and Poultry Inspection
Program. Current month data estimated by Market News Service. 2/ January-February
condemnations. 3/ Not available.
3
CATTLE ON FEED UP 4 PERCENT IN 13 DAIRY SITUATION I/
GFR-85-Vo1.8
QUARTERLY STATES
Cattle and calves on feed April 1, 1985 for the slaughter market in the 13 quarterly states totaled 9.68 million head, up 4 percent from a year earlier and up 6 percent from April 1, 1983.
Placement of cattle and calves into feedlots during the January-March 1985 quarter totaleQ 5.32 million head, down 3 percent from the same quarter last year, but 6 percent above the first quarter of 1983. Other disappearance totaled 373 thousand head leaving net placements of 4.95 million head.
Marketings of fed cattle for slaughter during the January-March 1985 quarter totaled 5.91 million head, up 3 percent from the corresponding quarter last year and 4 percent above the comparable 1983 quarter.
Cattle feeders intend to market 5.91 million head during the A~ril-June quarter of 1985. This would be an increase in marketings of 5 and 7 percent over the corresponding quarters of 1984 and 1983, respectively.
The number of ilk cows on far may
increase as the diversion progra ends,
but the gains are likely to be liited
because of tight cash flow and the
expected lower support prices. For 1985,
the average number of cows is projected
to remain about unchanged from last year.
Milk per cow is anticipated to be 1.5 to
2.5 percent larger.
Calendar 1984's
reduced yield due to the diversion
program could be overcome in a relatively
short time. Also, the underlying genetic
advancement has continued and will add
upward pressure on yields. Therefore,
milk production in 1985 is forecast up 1
to 3 percent.
Milk production dipped to 135.4 billion
pounds in 1984, down 3 percent from 1983.
This was the first decline in annual output since 1978 and the largest drop since 1973. The decrease resulted from the milk diversion program. as well as
from lower average ilk prices and higher feed costs. Federal order data for the
first three quarters of 1984 indicate that market1ngs of nonparticipants also
weakened as the year progressed.
Prices received by U.S. farmers for all milk during January-February averaged
$13.90 per cwt. 40 cents above the same period in 1984. The all-milk price
during March-June. assuming a lower support price April 1. will likely be about the same as a year earlier. The all-milk price during the summer. assuming a July 1. 1985 0 support price of $11.60 per cwt. will likely be 45 to 75 cents lower than a year earlier. l/ Dairy Situation - ERS.USDA.
CATTLE AND CALVES ON FEED
Total 13 States 1/
Total 7 States 2/
Item
On Feed Jan. 1 Placed on Feed Jan. 1-
Mar. 31 1/ Fed Cattle Marketed
Number
1984
1985
1,000 Head
9.908 10,635
5,511
5,321
1985 as 4 of 1984 Percent 107
97
Number
1984
1985
1,000 Head
8,006
8,617
4,631
4.388
1985 as 4 of 1984 Percent 108
95
Jan. 1-Mar. 31 1/
5,714
5,907
103
4.784
4,881
102
Other Disappearance
Jan. 1-Mar. 31 2/ On Feed Apr. 1
365
373
102
9,340
9,676
104
285
310
109
7,568
7,814
103
Marketings Apr.-June 3/5,620 4/5.908
1G5
3/4,704
4,930
105
1/ Includes cattle placed on feed after beginning of quarter and marketed before end of
quarter. 2/ Includes death losses, movement from feedlots to pastures and shipments to
other feedlots for further feeding. 3/ Total marketings including those placed on feed
after April 1 and marketed before June 30. 4/ Expected total marketings including an
allowance for those placed on feed after April 1 and marketed before June 30. 4
GEORGIA'S RED MEAT PRODUCTION DOWN
U.S. RED MEAT PRODUCTION DOWN
Georgia's red meat production totaled 35.7 million pounds during March 1985. 15 percent below March 1984 but 19 percent more than the previous month.
The number of cattle slaughtered by
commercial plants in Georgia during March
1985 was 21,800 or 800 head more than
March 1984, and 2,800 head more than the
previous month.
Calves slaughtered
during March totaled 1,600 head, same as
last year but 200 more than the previous
month. There were 153.3 thousand head of
hogs slaughtered in Georgia's commercial
plants during March 1985. This was
38,800 less than March 1984, but 27,700
more than the previous month.
co. .ercial red meat production for the United States in March 1985 totaled 3.16 billion pounds~ down 6 percent from March 1984. January-March red meat production, at 9.52 billion pounds, was down 1 percent from last year.
Beef production, at 1.86 billion pounds
was down 4 percent. Head kill was 2.88
million, down 7 percent.
Veal
production, at 40 million pounds, was
unchanged. Calf slaughter totaled 279
thousand head, a decline of 2 percent.
Average live weight increased 3 pounds to
240. Pork production, totaled 1.23
billion pounds, down 8 percent. Hog
kill, at 7.13 million head, declined 9
percent; however, the average live weight
increased 1 oound to 242.
s2ecies
Georsia Cattle Calves Hogs Sheep & Lambs
GEORGIA AND UNITED STATES LIVESTOCK SLAUGHTER 1/
Number Slaughtered
Average
1985
Jan.-Mar.
Live Weight
March
as 7. of '85 as % of
March
1984
1985 1984
1984
1984 1985
1,000 Head
Percent Percent
Pounds
21.0
21.8
104
1. 6
1.6
100
192.1 153.3
80
99
895
891
112
340
363
76
231
233
100
Total
Live Weight
March
1984
1985
1,000 Pounds
18,815 533
44,295 11
19,461 563
35,682 11
United States
Cattle
3,088.5 2,881.9
93
97
1,073 1,091 3,312,540 3,145,346
Calves Hogs
284.9 278.8
98
7,802.3 7,134.3
91
100
237
240
67,456
66,993
96
241
' 242 1,879,391 1,725,880
Shee2 & Lambs 600.5 578.2
96
94
116
11'5
691386
661448
1/ Includes slaughter under Federal Inspection and other commercial slaughter, excludes
farm slaughter.
COMMERCIAL RED HEAT AND LARD PRODUCTION: UNITED STATES WITH COMPARISONS 1/
March
1985 as 7.
Jan.-Mar.2/
1985 as 7.
Kind
1984
1985
of 1984
1984
1985
of 1984
Million Pounds
Percent
Million Pounds
Percent
Beef
1,937
1,857
96
5,709
5,691
100
Veal
40
40
100
116
119
103
Pork
1,338
1,232
92
3,738
3,618
97
Lamb & Mutton
35
33
94
98
93
95
Total Red Meat
3,'349
3,161
94
9,660
9,520
99
Lard 3/
84
78
93
235
228
97
1/ Based on packers dress weights and excludes farm slaughter. 2/ Accumulated totals
based on unrounded data. 3/ Preliminary lard production includes rendered pork fat.
5
MARCH PEANUT STOCKS
EDIBLE USE AND CRUSHINGS
GFR-85-Vol.8
Peanut s tocks in co..ercial storage on March 31, 1 98~, totaled 2.44 billion pounds of equivalent farm stock. This total includes 1.24 billion pounds of actual farmer stock.
Shel l ed peanuts on hand t o taled 1. 12
billion pounds of equivalent farmer
stock.
Roasting stock totaled 83.9
million pounds. There were 39.9 million
pounds of Commodity Credit Corporation
uncommitted stock on hand as of March 31,
1985.
Shelled peanut stocks on March 31, 1985, totaled 840 million pounds of which 817 million pounds were edi ble grades and 22.1 million pounds were oil stocks.
Commercial processors utilized 117 million pounds of shelled edible grade peanuts dur i ng March. Utilization for peanut butter was 61.2 million pounds , utilization for peanut candy was 26.9 illion pounds, and ut i l ization f o r salted peanuts was 25 . 3 million pounds.
Crushing& for oil, cake, and meal totaled 55.2 mill ion pounds during the month.
Deliveries under t he Government Domestic Feeding and Child Nutrition Program amounted to 1,246,046 pounds of peanut butter, 192,000 pounds of roasted peanuts and 46,200 pounds of peanut granules during the month of March.
Period Ending
1984 Jan. July
STOCKS OF PEANUTS AND SPECIFIED PRODUCTS AT MONTH'S END
CROP OF 1984-8~ 1/
Farmer
Shelled
Roasting
Farmer Stock Eauivalent
Stock
Peanuts 2/
Stock (In Shell)
Shelled Peanuts
I Total 3/
1 ,000 Pounds
1,507,187 8,758
562,786 435,512
48,688 23,322
748,505 579,231
2,304,380 ' 611,311
1985
Jan.
1,892,265
742,623
91,684
987,689
2,971,638
Feb.
1,669,1~1
804 , 359
80,346
1,069,797
2,819,294
Mar.
1,236,219
839,515
83,937
1,116,555
2,436,711
1/ Excludes stocks on farms. Includes stocks owned by or held for account of CCC in
commercial storages. Farmer stock on net weight basis. 2/ Includes shelled edible and
shelled oil stock. 3/ Actual farmer stock, plus roasting stock, plus shelled peanuts
X 1.33.
CHANGING PREFERENCES
Per Capita Vegetable Consumption
Changing preferences, demographics,
lifestyles, and greater awareness o f
nutrit ion, diet, and health have
increased consumer demand for fresh
fruits and vegetables . Fueled by the
popularity of salads, fresh vegetable
consumption reached 99.9 pounds per
person in 1983, down slightly from 1982's
30-year high of 100.1 pounds . During the
last 10 years, per capita consumption of
fresh tomatoes rose 6 percent, and
lettuce almost 13 percent.
The fresh
use of such leading non-citrus fruits as
bananas, apples, and grapes rose 16
percent, 15 percent, and 129 percent,
Commercial Vegetables
Pounds
_,_--.;~ ~ 160
'
.
c
..
_
.
__,T;.:oJi:18'1.~
, .6 . .. . .
"";!~
120-----------------------------------------
. ~ )~~.:~:;Freitf ~ ~~ ,... . . =- ~~ . :. .~ --=~ : \ ~ .. .
80 ~~.~.~~~.~-.J.~.-.~.~~.~~--.~.~ --~ 4
_, ____.._. --- .... , %.~~:!1':_$..~;~ ~~~~~-:v.!
'
~",:.:.:7,~:-.:
:.
:
.
..
..
.
:.~_; _;.:.- .
. ' .. -.:.
40---~-----
::.. ~~it.: ~ ; --: .:-~ . . . :
-~
~ ~:--.; ~Frozen
0iiltiil , , - .:
"..J.
I
~T.-1~I ~I - I I ~I . I I-I - I I-I - I I-I -I - I I-I I
1950
55
60
65
70
75
80 83
respectively.
'Excludong6
FARM INCOME UPDATE
The U.S. farm sector economy is expected to rem&in sluggish in 1985. The absence of PIK disbursements (except for a small amount of wheat in January), combined with a small rise in cash expenses, will likely offset a small increase expected in cash marketing receipts. This will likely leave net cash income (current dollars) near the expected 1984 level,
further aggravating farm financial problems, especially for highly leveraged farmers in need of a stronger cash flow. Net cash income is forecast to range between $33 and $38 billion in 1985, compared with the $34 to $38 billion expected for 1984 and the record $40.1 billion of 1983. Deflated (1972 dollars) net cash inco.e is forecast to range fro $14 to $16 billion in 1985, compared with the expected $15 to $17 billion of 1984.
FARM INCOME AND CASH FLOW STATEMENT - UNITED STATES
Item
1981
1982
1983
1984F
Billion Dollars
Farm Income Sources
1 Cash Receipts
142.6
144.8
138.7
139-143
Crops 1/
73.3
74.6
69.5
68-72
Livestock
69.2
70 . 1
69 . 2
70-74
Cash Government Payments
1. 9
3.5
4.1
3-5
Value of PIK CoiRDIOdities 2/
0.0
0.0
5.2
3-5
2. Direct Government Payments
1.9
3.5
9.3
7-10
3. Other Cash Income 3/
1. 9
2.0
1.5
1-3
4. Gross Cash Income (1+2+3)4/ 146.4
150. 2
149 .6
149-153
5. Nonmoney Income 5/
13.6
14.2
13.6
12-14
6. Realized Gross Income (4+5) 160.0
164.4
163.2
162-166
7. Value of Inventory Chan'e
7.9
-2.6
-11.7
5-9
8. Tot.al Gross Income (6+7
167.9
161. 8
151.4
169-173
1985F
140-145 69-73 70-74 4-7 0 4-7 1-3
148-153 12-14
161-166 -3- 1
160-165
Production Expenses 9. Cash Expenses 6/7/
10. Total Expenses
111.4 136.9
113 .4 139.5
109.5 135.3
11 4- 116 139-141
113-117 138-142
Income Statement Net Cash Income: 1/7I
11. Nominal (4-9) Deflated (1972$)8/
35.0 17.9
36.8 17.8
40. 1 18.6
34-38 15-17
33-38 14-16
Net Farm Income: 1/ 12. Nominal Total Net (8-10)
s Total Net (1972$)8/
Total Net (1967 )9/ 13. Off-Farm Income
31.0 15.9 11.4 39.8
22.3 10.8
7.7
39.4
16.1 7.5 5. 4
41.0
29-33 13-15
9-11 41-45
20-25 <:I-ll
6-8 43-47
Other Sources and Uses of Funds
14. Change in Loans
Outstanding 7/
15.5
6.8
2.9
-1-1
-2-2
Real Estate
9.3
3.7
2.1
-2-0
-3-1
Nonreal estate 10/
6.2
3.1
0.8
0-2
-1-3
15. Rental Income
5.7
5.6
4.3
4-6
4-6
16. Gross Cash Flow (11+14+15)
56.1
49.3
47.3
39-43
38-43
17. Capital Expenditures 7/
16.8
13.6
13.1
12-14
11-15
18. Net Cash Flow (16-17)1/7/
39.3
35.6
34.2
26-30
25-30
FForecast. 1/ Includes net CCC loans. 21 PIK data are based on ent1tlement trans-
actions estimates. 3/ Income from custom work, machine hire, and farm recreational
activities. 4/ Numers in parentheses indicate the combination of items required to
calculate a given total. 5/ Value of home consumption of farm products and imputed
rental value of farm dwellings. 6/ Excludes depreciation and perquisites to hire
labor. 7/ Excludes farm dwellings. 8/ Deflated by the GNP implicit price deflator.
9/ Deflated by the CPI-U. 10/ Excludes CCC loans.
7
Commodit)!
Butter Cheese, Natural Eggs. Frozen Fruits, Frozen Fruit Juices, Frozen Heats, Red
Beef, Frozen Pork, Frozen Poultry. Frozen Turkeys. Frozen Vegetables, Frozen Potatoes, Frozen Peanuts. Shelled Peanuts. In Shell Pecans. Shelled Pecans 1 In Shell
COLD
STORAGE STOCKS 1 UNITED STATES 1 MARCH 31 1
March 31
February 28 March 31
1984
1985
1985
1 . 000 Pounds
529.332
289.433
289.738
1,217,438
944,368
896,496
11,999
13,896
13,383
479,933
569,226
514,917
1,396,187
1,385,824
1,450,731
738,138
710,882
722,033
32S,704
3S1,023
334.120
350.727
~85,323
314 . 312
254.684
290.662
300.885
144,358
131.452
133.562
1.311.003
1 . 489.574
1.338,386
827.579
943.384
999.794
332.868
404.776
439.435
24.535
41.349
48.859
30.711
26.677
27.573
117.856
83.655
77 605
198S
Percent of
Mar. 1984 Feb.
Percent
55
100
7'4
95
112
96
107
90
104
105
98
102
103
9S
90
110
118
104
93
102
102
90
121
106
132
109
199
118
90
103
66
93
1985
110
Georgia Crop Reporting Service
Stephens Federal Bldg.
Suite 320 Athens, Georgia J 0&13
SECOND-CLASS POSTAGE PAID AT ATHENS , GA 30613
95 - 25 7 20 5 20
JO 3 'J8
TS
LISR ~ y
G
30 ::>0 2
A4co.c7
~~EORG/A
FARM REPORT
May 14, 1985 GFR-85-Volume 9
AY 16 1985
IJU\,UIVlt;.1'4 j ~
UGA LIBRARIES
GEORGIA CROP REPORTING , SERVICE
stephens Federal Bldg. SUite 320 Athens, Georgia 30613 Phone: (404) 546-2236
HIGHLIGHTS Wheat Forecast 1984 Tobacco & Cotton Estimates Agricultural Prices Grain Stocks
GEORGIA WHEAT DOWN
Milk Production, Disposition, and Income
Hay Stocks Peach Forecast
U.S. WINTER WHEAT OFF 4 PERCENT
Wheat production in Georgia in 1985 will be 21.6 million bushels, a 31 percent decline from last year's crop of 31.2 million bushels. Acreage for harvest, at 800,000, is down 10 percent from last year. The estimated yield at 27 bushels per acre, is down 8 bushels from last year.
1984 GEORGIA COTTON PRODUCTION JUMPS
Georgia's 1984 cotton production, at 281,000 bales (480 pounds net weight) is 151 percent above the 112,000 bales produced in 1983. The 172,000 acres harvested in 1984 is 50 percent more than for the 1983 crop. The record breaking yield per acre of 784 pounds,is 70 pounds per acre more than the previous record yield in 1982.
1984 GEORGIA TOBACCO CROP DOWN
U.S. winter wheat production is forecast
as of Mar 1, at 1.97 billion bushels, 4 percent ess than the 1984 production of 2.06 billion bushels. An estimated 48.5 million acres is expected to be harvested for ~rain, a 6 percent decrease from last year s 51.5 million a c res. Yield per harvested acre is forecast at 40.7 bushels.
1984 COTTON PRODUCTION UP 67 PERCENT
United States cotton production totaled
13.0 million bales in 1984, 67 percent
more than in 1983. Upland cotton
accounted for 12.9 million bales and
American-Pima cotton 130.4 thousand
bales. The U.S. yield per harvested acre
of all cotton increased to 600 pounds,
copared with 50.8 pounds per acre in
1983.
(SEE PAGE 3)
The 1984 Georgia tobacco crop, at
85,500,000 pounds, is 11 percent below
1983's 96,360,000 pound crop.
Acres
harvested for 1984 are estimated at
38,000 acres, 6,000 acres below the
previous year. Yield, at 2,250 pounds
per acre, was up 60 pounds per acre from
the_ 2,190 pounds recorded in 1983.
U.S. 1984 TOBACCO PRODUCTION UP
Production of all tobacco in the United States in 1984 totaled 1.73 billion pounds, 21 percent more than 1983. The increase was caused by the combination of an increase in acres and an increase in yield.
GEORGIA ACREAGE AND PRODUCTION 1984 AND 1985
Acreqe
y eld per Acre
PrOCluctlon
Crop Cotton 2/ Tobacco,
Unit Bales
Har-
For
vested
Harvest
1/1984
11_1985
1nousana Acres
172
NA
1984 784
~na1-
cated May 1,
1985
NA
~na1-
cated
1984
Ma~ 1, 1 85
Tnousanas
281
NA
Type 14 Wheat
Lbs. Bu.
38
NA
2,250
NA
85,500
NA
890
800
35.0
27.0
31,150
21,600
1/ Harvested for principal use. 21 Cotton yield in pounds and production in bales.
Agrieul~ural S~a~is~icl.an and Georgia Depa.rt:.ent of .Agrl.OJ.l~e
GFR-85-Vol. 9
GEORGI A ANNUAL MILK PRODUCTION AND CASH RECEIPTS
Georg ia ' s a nnual milk p roduction tota l ed 1,278 mi ll ion pound s during 1984, 117 million pounds leas than the 1983 production . The aver age number of milk cows on Georgia farms in 1984 was 120,000 head, 9 , 000 less than the average in 1983. Mi l k production per cow averaged 10,650 pounds, compared t o 10, 8 14 pound s in 1983.
Cash receipts from marketings of a ll mi l k totaled $185.3 mil l ion in 1984 , compared to $20 1 . 0 mil l ion in 1983. Prod ucers r eceived a n a verage o f $1 4 . 60 pe r hundred pound s of mi l k s o ld d uring 1984.
U. S: ANNUAL MILK PRODUCTION AND CASH RECEIPTS
Milk production declined 3 percent i n 1984 to 135 bill ion pound s. This was slightly less than 1982 production. The rate per cow at 12 ,495 pounds was 90 pounds lower than the 1983 rate. The a nnual average number of cows was 10 . 8 million head , 2 percen t less than the a verage during 1983.
Cas h receipts from mar ketings of milk and cream during 1984, a t $17 . 9 bil lion, were 4 percent be l ow 1983. Producer returns a veraged $13 . 54 per hundredweight , 12 cents bel ow the 198 3 avera g e. Marke ti n g s tot a led 132 bil lion pounds milk equiva l e nt , 4 percent below 1983. Market i ngs inc l ude who le mil k and produ cer-separated c ream sold t o plants and dealers as we l l as mil k sold directly to consumers.
CROP AND LI VESTOCK SURVEY SCHEDULED
Farmers throughout Georgia will be asked
t o participa te i n a nat i on-wide survey
duri ng late May and early Ju ne .
Informati on obtained in the survey wil l
be used to deve l op estimates of 1985 c r op
acrea ges a n d mi d-yea r li ves t ock n umber s .
Al l
i ndividual
i nformation
is
conf i denti al and used only in developing
official National and State estimates.
Larry Sn ipes, State St atis ti c i an, noted
t hat conce rns a bout cost of production
and retur ns from f armi ng are weighing
heavily on farmers ' p l ans this year.
Th ese uncertai nt i es hi gh li ght the need
for acreage and l ivestock i nfor mation
producers can rely on .
F a r me r
cooperation on t he survey i s the key to
dev.eloping ac curate es ti mat es .
Represen t a tive s f r om the Georg i a Cr op Reporting Serv ice will inte rv iew a cro s s section of f a rmers, and questionnaires wil l be mailed to other farmers, to gather data for the estimates. National and State estimate s will be publ i shed by USDA' s Crop Re porting Board and included in subsequent issues of "The Geo rgia Farm Report". A report on 1985 crop acreages will be avail a ble on July 10, i nc lud i ng estimates of yield and production f or s e veral major crops. Es timates of hog and pig numbers wil l be r e l e ased on J une 21, and cattle numbers on Ju ly 2 2.
An e s t i ma ted 3. 0 7 bil li on poun ds of milk were use d on farms where pr oduced, 30 per c ent more t han during 1983. Calves were fed 73 percent of thi s milk ; the remainder was consumed in producer household s as fluid milk, cream, and t>utter.
Ite No. Milk Cows on Far Milk Production per Cow Total Milk Production Cash Receipts Value of Ho- Consumption Gross IncoiDe
MILK PRODUCTION AND INCOME 1983-1984
Geor ia
Unit
1983
1984
Thous. Head
129
120
Pounds
10,814
10,6~0
Mil. Lbs.
1,39~
1,278
Mil. Dole.
200.1
184.7
Mil. Dol a.
.9
.6
Mil. Dole.
201.0
18~.3
United States
1983
1984
11,098
10,840
12,585
12,495
139,672
13~,444
18,756.9
17,927.1
115.9
112.6
18,872.8
18 , 039.7
2
State
Ala. Ariz. Ark. Cal if. Fla. Ca. Kana. La. Miss. Mo. N. Hex. N.C . Okla. S.C. Tenn. Tex. Va.
u.s .
I
1983
21 9.0 320.5 320.0 960.0
12.5 120.0
.4 420.0 687.0 108.0
67.1 60.0 320.0 69.0 220 .0 4,022.4
.4
7,926 . 3
1984
309.0 480.5 470.0 1,410.0
17.5 175.0
.8 650.0 1,045.0 164.0
87.0 97.0 425.0 104.0 340.0 5, 369.6
1. 0
11,145 . 4
I
1983
Acres ---
21LO
313.3
290.0
950.0
12 . 0
115.0
.4
410.0
675.0
93.0
58.1
59.0
300.0
69.0
215.0
3,572.3
.4
7,347 . 5
1984
307 . 0 479.3 465.0 1,400.0
17.0 172.0
.5 645.0 1,032.0 162.0
79.0 96.0 375.0 104.0 325. 0 4,719.3
1. 0
10,379.1
I 1983
1984
Pound1.1
409
699
1' 183
1,187
535
632
996
999
608
847
467
784
240
288
623
786
640
767
377
554
709
604
350
600
232
234
369
785
337
498
32 4
377
360
528
508
600
State
Ala. Ariz . Ark. Calif. Fla. Ca. Kans. La. Miss . Mo . N. Hex. N.C. Okla. S.C. Tenn . Tex. Va.
Production in 480-Lb .
Net We i ght Bales 1/
I
1983
1984
1, 000 Bales
183.0
447.0
771.9
1,185.1
323.0
612.0
1,971.0
2,913.0
15.2
30.0
112.0
281.0
.2
.3
532.0
1,056.0
900.0
1,650.0
73.0
187.0
85.8
99.4
43.0
120.0
14 5.0
183.0
53 . 0
170.0
15 1.0
337.0
2,412.0
3,709. 9
.3
1.1
COTTON
Price
per Pound
2 /1983
3/1 984
Cents
65.7
55.9
70.2
61.3
66.5
56.2
72.8
65.8
67.3
58.6
67 . 2
59.2
57.8
48.7
65.4
55 . 1
66.2
56.1
68.5
58.5
81.3
66 . 7
70.5
63.0
57.8
48.7
72.4
61.3
68.5
56.9
59 . 9
55 .4
73 .0
63 .0
Value of
Production
2/1983
3 /198 4
1 , 000 Do ll ars
57,711
119,939
260,073
348,626
103,102
165,093
688,746
920,042
4,910
8,438
36, 127
79,849
55
70
167,005
279,291
28 5 , 984
444,312
24,002
52,510
33,476
31,843
14,551
36,288
40,229
42,778
18,419
50,021
49,649
92,04 1
694,032
986,777
105
333
u.s.
7,771.4
12,981 .8
66 . 4
58 .7
2,478, 176
1/ Production g inned and to be ginned. 2/ Includes allowance f or unredeemed loans .
to April 1 , 1985 wit h no a l lowance for unr edeemed loans.
3
3 ,658,25 1 3/ Averag e
GFR-8~-Vol. 9
U.S. PRICES PAID INDEX UNCHANGED
CONSUMER PRICE INDEX
The Index of Prices Pai d by Farmers for Commodities and Services, Interest, Taxes and Farm Wage Rates for April was 164 percent of its 1977 a verage. The Index was unchanged f r om a mon t h earlier but was down 1 point from April 1984.
The fuels and energy and fami ly livi ng indexes for April we r e u p from a mont h ago. Offsetting were slight decr eases
from March by the feed and feeder livestock components and a .oder ate decline in the seed i ndex that is updat ed in Apr il and September o f e ach y e ar.
The March unadjusted Consumer Price Index
for All Urban Consumers (CPI-U) at 318.8 (1967100) was 0.4 percent higher than
in February and 3.7 percent above March 1984. On a seasonally adjusted basis, the CPI-U was 0.~ percent above Febr uary. Sharp incre a s es in the price of motor fu e ls pu s hed the t ransportat i on index up 1.3 percent. The ~dic a l care index
increased 0.8 percent and the apparel and upke ep i nde x rose 0.~ percent. Smaller i nc reases were registered for the other goods and services index and the
housing index--0.4 and 0.3 percent, r e spec tively . The food and beverages i ndex and the entertainment index were unchanged from last .onth.
PRICES PAID BY FARMERS APRIL 15. 1985 WITH COMPARI SONS
Geo1~ g i a
:
Un i t ed States
Coa.odi t
I per
Unit
Apr . 15 . 1984
Mar. 15 , 1985
Apr. 15,: Apr. 15,
1985 :
1984
Mar. 1S, 1985
Apr. 15, 1985
Dairy Feed 16%
$/Ton 210 .00
179 . 00
1 6~.0 0
199.00
172 . 00
171 . 00
Dairy Feed 18%
$/Ton 215 .00
175.00
166.00
212.00
175.00
172.00
Dairy Conc t. 32%
$/Ton
2 5~.00
205.00
197 .00
283.00
2.30.00
227.00
Hog Feed 14%-18%
$/Cwt.
12.50
10 . 50
10.40
11.70
9.59
9.68
Hog Conct. 38%-42% $ /Cwt . 16.00
13 . 00
12.50
15.90
12..50
12.30
Beef Cattle Conct .
32%-36%
$/Cwt. 13.00
12 .00
11.50
13.10
10.90
10.50
Cottons eed Meal 4 1% $ / Cwt .
16 .00
12.50
11.50
16.00
12..20
11.90
Soybean Meal 44%
$/Cwt.
13.~0
11 .~ 0
11.00
14.50
10.60
10.30
Bran
$/Cwt.
10.50
11.00
11.50
10.50
9. 72.
9.54
Middlings
$ / Cw t .
9.20
10. 50
10.50
10.10
9.18
8.88
Corn Meal
$ / Cwt .
9.80
9.40
9 . 10
8.92
7 . 58
7.56
Broiler Grower
$/Ton 215.00
245.00
225 . 00
246.00
214 . 00
2.07 . 00
Laying Feed
$/Ton 210.00
165.00
180.00
214.00
186.00
186.00
Chick Starter
$/Ton 245.00
200.00
205.00
241 . 00
209.00
206.00
Broiler-Feed Ratio 1/ Lbs.
3 .2
2. . 3
2 .3
2.8
2. . 8
2.8
Hog-Corn Ratio 2/
Bu.
11.8
14. 3
13.8
14.3
16.4
15.5
Milk-Feed Ratio 3/ Lba.
1.35
1.68
1. 76
1.32
1.55
1.52
Egg-Feed Ratio 4/
Lba.
10.4
8.4
6.7
8.5
6.2.
5.7
1/ Pounds of broi ler growe r equal in value to 1 lb. broiler live weight. 2/ Bushel of corn
equal iq value to 100 lbs. of hog l i ve weight. 3/ Pounds of 16% dairy feed equal in value to
1 lb. whole milk. 4/ Pounds of layi ng feed equal i n value to 1 doz. eggs.
INDEX NUMBERS--GEORGIA AND UNITED STATES
1977100
March 1984
April 1984
March 1985
April 1985
Georgia
Prices Received
All Commodities
144
Crops
136
Livestock & Products
1~1
144
124
137
122*
150
126*
United States
Prices Received
145
146
134
Prices Paid 1/
164
165
164
Ratio 2/
88
~8
82
1/Mid-month index including interest, taxes and farm wage rates. 2/ Ratio of Index of
Prices Received to Index of Prices Paid, Interest, Taxes and Farm Wage Rates. * Revised.
4
GEORGIA PRICES RECEIVED
U.S. PRICES RECEIVED INDEX DOWN 2 POINTS
Average pricea received by Georgia
farmers at id-April were down from the
previouw month.
Corn, hoga, cattle,
calves, milk, broilers and all eggs were
lower while wheat, soybean and other
chickens were higher.
Cotton and
sweetpotatoes were unchanged fro the
previous month.
The Georgia Prices Received All Commodity Index for April was 119 percent of the 1977 average, down 5 points fro last month and 25 points below last year.
The April All Farm Products Index of Prices Received by Farmers decreased 2 points from March 1985 to 132 percent of its January-December 1977 average. Lower price for cattle, hogs, milk, eggs and tomatoes were partially offset by higher prices for potatoes, corn, grapefruit arad sorghum. The Index was 14 points below a year ago.
PRICES RECEIVED BY FARMERS. APRIL 15. 1985 WITH COMPARISONS
Price
Georaia
United State
per
Apr.
Mar.
Apr. 15,
Apr.
Mar. Apr. 15,
Co-.odit
Unit
1984
1985
1985
1984
1985
1985
Winter Wheat
$/Bu .
3.74
3.11
3.16
3.53
3.32
3.31
Oat a Corn
$/Bu.
stBu.
3.88
3.10
3.07
1.82 3.32
1.69 2.66
1.63 2.68
Cotton
Ct./Lb. 68.5
54.0
1/54.0
67.2
54.5 1/55.0
Tobacco
Ct./Lb.
3/-
97.0
158.0 . 3/139.0
Soybeans
$/Bu.
7.93
5.90
5.97
7.83
5.88
5.86
Sweet potatoes
$/Cwt.
17.50 2/18.60
18.60
20.20 2/19.10
19.70
All Hay, baled 2/ $/Ton
79.80
72.50
73.40
Milk Cows, 4/5/
$/Head 850.00
890.00
910.00
885.00
Hogs
$/Cwt. 45.70
44.20
42.50
47.50
43.60
41.60
Sows
$/Cwt. 40.70
40.90
39.60
44.10
41.10
39.80
Barrows & Gilts
S/Cwt.
46.60
44.40
42.80
47.90
43.80
41.80
Beef Cattle 6/
$/Cwt. 48.10
47.50
46.50
60.10
57.30
56.10
Cowa 7/
$/Cwt.
41.30
40.40
39.40
40.80
40.90
40.00
Steer s & Heifers
$/Cwt.
52.80
54.20
51.70
64.60
60.70
59.70
Calves
$/Cwt.
53.30
61.50
60.20
62.30
65.90
65.80
All Milk
$/Cwt.
14.20
15.00 3/14.50
13.10
13.30 3/13.00
Turkeys 2/
Ct./Lb.
42.9
40.7
40.3
Chickens, Excluding
Broilers
Ct./Lb. 20.5
2/11.0
11.5
Com'l Broilers 8/ Ct./Lb. 34.0
28.5
3/26.0
33.8
30.1 3/28.8
Eggs , All 9/
Ct./Doz 109.0
2/69.5
60.5
91.3 2/57.6
53.0
Table
Ct./Doz 98.4
2/49.0
41.2
87.4 2/50.4
45.1
Hatching
Ct./Doz. 140.0 2/130.0
115.0
1/ First half of month. 2/ Mid-month price. 3/ Entire month. 4/ Animals aold for dairy
herd replacement only. 5/ Prices esti-ted quarterly. 6/ "Cows" and "steers and heifer"
combined with allowance where necessary for alaughter bulla. 7/ Include dairy cowa aold
for slaughter. 8/ Liveweight equivalent price for Georgia. 9/ Average of all eggs aold
by farers including hatching eggs sold at retail.
The Georgia Farm Report (ISSN-0744-7280> Is published semi-monthly by the Georgia Crop Reporting Service, Stephens Federal Building, Athans, Go. 30613, Lorry E. Snipes, Stotlstlclon In Chorge. Second closs postage paid ot Athens, GA. Subscription fee SIO per year except free to date contr ibutors. Subscription Information ~v alloble fr~ : Georgia Crop Reporting Service, Stephans Federal Bul !d ing, Suite 320, Athens, GA. 30613 Telephone: (404) 546-2236.
5
State
Conn. Fla. Ga. Ind. Ky. Md.
Ha
Mo.
N.C.
Ohio Pa.
s.c.
Tenn. Va.
w. Va.
Wi.
Area Harveted
1983
1984
Ac re
1, 930
1,770
7,800
7,000
44,000
38,000
8,100
8,100
203,300
228,500
27,000
24,000
425
500
3,100
2,900
277.700
271,600
11,900
12,000
12 ,000
12,000
54,000
47,000
72,910
74,990
54,190
53,840
2,200
2,400
8,600
8,000
TOBACCO BY STAT!S
[
Yield 1983
1984
Pound
1,738
1,595
2,260
2,560
2,190
2 , 250
1,610
2 , 320
1,597
2,320
1,100
1,300
1,842
1,570
2,070
2,015
1,969
2,172
1,485
2,209
1,832
1,864
2,090
2,245
1,621
2,062
1 , 828
2,153
1, 710
1,870
1,941
1,968
GFR- 85- Vol. 9
I
Production
1983
1984
1,000 Pound
3,354
1,824
17,628
17,920
96,360
85,500
13,041
18,792
324,602
530,088
29,700
31,200
783
785
6, 417
5,844
546,869
590,026
17,668
26,507
21,985
22,370
112,860
105,515
118,197
154,646
99,052
115 , 897
3,762
4,488
16,691
15,744
u.s.
Conn. Fla. Ga . Ind. Ky. Md.
Ma
Mo. N.C.
Ohio Pa.
s.c.
Tenn. Va.
w. Va.
Wi.
789 155
792 600
1 811
Season Av erage Price Per
Pound Received by Farmer
1983
1984
Cent
558.5
642.3
171. 4
180.4
180.3
182.6
176.9
186.5
175 .0
185 .2
104.8
1/
446.5
838.5
179.0
185.7
178.0
180.9
167.7
180.8
94.3
93.8
180.9
181.3
179.7
179.4
172.3
178.7
176.0
168.9
109.6
110.5
2 180
1
Value of
Production
1983
1984
1 ,000 Dollar
18,733
18, 139
30,214
32,328
173 ,737
15'6 , 123
23,070
35,047
567 , 965
981,549
31,126
44,834
3 , 496
6,582
11,486
10,852
973,362
1,067,128
29,632
47,920
20,724
20,984
204,164
191,299
212,428
277,133
170,633
207,092
6,621
8,078
18,285
17,398
728 146
u.s.
174.6
180.7
2.495.676
3.122.486
1/ !valuated at 143.7 cent per pound, the average ale through April 30, 1985.
6
GA. SOYBEAN STOCKS DOWN 11 PERCENT; CORN DOWN 6 PERCENT
Soybeans in all positions on April 1, 1985 in Georgia totaled 14,710,000 bushels, 11 percent less than the 16,457,000 bushels on hand April 1, 1984. Farm stocks of 5,200,000 bushels were 77 percent above April 1, 1984. Off-farm stocks totaled 9,510,000 bushels, down 30 percent fro April 1, a year earlier.
Stocks of corn stored in all positions totaled 17,378,000 bushels, 6 percent less than a year ago . Corn on farms amounted to 12,923,000, up 12 percent from last year, while off-farm stored corn dropped 36 percent to 4,455,000 bushels.
Stocks of wheat in all positions totaled 2,565,000 bushels, down 24 percent from the 3,388,000 a year earlier . Wheat stored on faras totaled 1,090,000 bushels, down 22 percent while off-farm stocks amounted to 1,475,000 bushels, down 26 percent from a year earlier.
Oats stored in a ll positions totaled 739,000 bushels, 4 percent more than last year. On-farm storage at 594,000 bushels was 14 percent above last year. Oats stored off-farms showed a d r op of 24 percent from the 192,000 bushels a year ago to 145,000 bushels thi s year. Sor ghum stored in all posi tions totaled 580,000 bushels , down 17 percent from the 698,000 bushels last year.
Grain
GEORGIA GRAIN STOCKS--APRIL 1, 1985 WITH COMPARISONS
On Farms
Ott Farms I/
AirYoeitions
1984
1985
1984
1985
1984
1985
-1,000 Bushels -
12,923
6,952 4,455
18,528 17,378
594
1,09*0
192
145
*
21
1,475
711
739
*
21 2,565
522
58
580
200
9.510
14.710
U.S. CORN AND SOYBEANS UP ; WHEAT DOWN FROM A YEAR EARLIER
Corn stored in all posit ions on April 1, 1985 is estimated at 3.96 billion bushels, 22 percent more than the April 1, 1984 level of 3. 25 billion bushels. Of the total corn on hand April 1, 1985, 71 percent was stored on farms. This is 46 percent more than the April 1 farm stocks a year ago . Off-farm stocks, at 1.13 billion bushels are down 14 percent from last April 1.
All wheat stored in all positions on April 1, 1985 totaled 1.67 billion bushels, 5 percentless than the 1.76 billion bushels stored on April 1, 1984. Farm stocks, at 714 million bushels are
down 7 percent from April 1 a year ago. Off-farm stocks amounted to 954 million bushels, off 3 percent from April 1, 1984.
Soybeans in all pos itions on April 1, 1985 totaled 898 mill ion bushels , up 14 percent from April 1 a year ago but 22 percent below April 1, 1983. Farm stocks a re estimated at 488 million bushels, 30 percent more than April 1, 1984. Offfarm stocks were down 1 percent from last April 1 and total 410 million bushe ls .
Stocks of other grains were: grain sorghum 481 mill i on bushels, up 2 percent; oats 256 million bushels, down 5 percent; and barley 319 million bushels, up 19 percent.
Grain
U.S. GRAIN STOCKS--APRIL 1, 1985 WITH COMPARISONS
On Farms
Off Farms 17
AII-p08It1ons
1984
1985
1984
1985
1984
1985
MIIrion-Bushe 1 s
2,829
1,317 1,132
3,251 3,961
211
43
45
270
256
216
100
103
269
319
714
987
954
1,758 1,668
135
381
346
470
481
488
416
410
790
898
evators, warehouses, termlna
processors.
7
~~f ~~
~~~~::r
~
- ... .....~... aIll :r~o -
~ (3
...
I.t!..
~
Ill
Q ~i~.~..
:r <!~
-
.~.~.~,
0 ~
~ 0
QIQ
........
a0 -
.....
cCJ:I
C!C'
>g>-j"i~'O"o~'
iH1~
1:'1 I
(")
g;~t;:
..., HC/l t:ICil
o>
..<....7,.>.-i
GFR-85-Vol. 9
GEORGIA PEACH CROP DOWN 50 PERCENT
Georgia' 1985 peach crop is expected to be 75 million pounds, a 50 percent decrease from the 1984 crop. The reduction is due to a hard freeze in January which killed many of the dormant buds in the northern part of the State and additional damage from spring freezes during and/or after bloom.
9 SOUTHERN STATES PEACH CROP DOWN 52 PERCENT
Peach production in the nine southern states is forecast at 369 million pounds, down 52 percent from last year as freezes again limited the crop. Texas is the only southern state that expects increased production.
PEACH PRODUCTION SOUTHERN STATES. 1983-1984
St a t e
1985
Mi ll i on Pounds
Al a .
14 .0
22.0
1 .5
Ark. Ga.
2 1.0 100.0
23.0 150.0
7.0 75 . 0
La.
6.0
7.0
6.0
Mi s s .
4.0
5. 0
2. 5
N.C.
12 .0
43 .0
2/
Okla.
7. 5
9. 0
7. 0
S. C.
95. 0
480.0
240. 0
Tex.
27. 0
23.0
30.0
9 Sout hern
States 286 . 5
762 . 0
369.0
1/ Includes unharve sted producti on and
harvested no t sold (mi l. lbs . ) : 9 Sou th-
ern States, 1983-28 . 0, 1984-108.0. 2/
No significant commerc i al produc ti cn due
to frost.
GEORGIA HAY STOCKS RISE
Georgia's Hay 1 hay stocks, at 198,000 tons, are 183 percent above last year's Hay 1 stocks of 70,000 tons . Disappearance since January 1, 1985 was 673,000 tons.
Hay 1 har stocks on u.s. farms totaled
26.9 i l ion tons, 33 percent more than the Hay 1, 1984 stocks. Disappearance from Januar~ 1 through April totaled 73.8 illion tons in 1985 compared with 69.1 million tons during the comparable pe riod last year.
a
1711
1\LfOO, C1
~~GEORGIA
~5/10
FARM REPORT
~ay 29, 1985 GFR-85-Volume 10
GEORGIA
~ CROP REPORTING SERVICE
stephens Federal Bldg. Suite 320 Athens, Georgia 30613 Phone : (404) 546-2236
HIGHL I GHTS :
Farm Labor Cattle on Feed Milk Production Livestock Slaughter Cold Storage
Peanut Stoc ks Turkey Eggs in I ncubators Poultry Summary Livestock Cash Receipts
FARM LABOR PAY RATE DOWN
During the s urve y week of Apr il 7-13, 1985, southeast r eg ional (Ala . , Ga., S. C.) hired farm workers were paid an average hourly wage of $3 . 51. This compares with $3 .56 paid during October 1984, when a Farm Labor Su rvey was l ast c onducted in the southeast.
All far m worke rs in the s outheast region numbered 120,000 for the survey week. Thi s i s down 25 percent fr om the 16 1, 000 workers for the week of October 7-13, 1984 .
FARM WAGE
The average weekly hours . worked by hired workers were up f rom 27 .9 i n Oc to ber 1984
to 33.3 i n Apri l 1985 . Weekll average hours worked by the self-emp oyed, at 34.7 , were down from October's 35. 0 hours. Un paid workers wor ke d 35.1 hours compared with 36 . 1 hours worked in
October.
To
provide
increased
estimate
reli ability, farm labor data is published
on a regional basis e xcept for Florida,
Cal ifornia, and Hawai i. Fifteen regions
consi s t o f t wo o r more states comb ined.
State and Region 2/
: ------r'1 e 1d
:
Southeast
Florida Appalachian I Appalachian II
3. 18 4. 28 3 . 73
3.65
Live-
Super-
Other : Hour ly
Stock
visory
:
- - - - Do llars per Hour - - - -
3.85
5.76
3. 39
3 . 58
4.49
8 . 21
5.13
4 . 76
3.93
5 . 14
3.68
3 .64
4. 13
3/
3 .76
3.77
Piece Rate
3/ 4 . 74
3/ 3/
Delta
3.86
3. 89
Northeast I
4. 19
3 . 33
Northeast II
4 . 47
3 . 96
Lake
4. 66
3.33
Cornbelt I
4.20
4.26
Cornbelt II
4 .04
3.94
Northern Plains
4.89
4.23
Southern Plains
4 . 11
3 .92
Mountain I
3/
3 . 58
II
3/
4. 47
III
4 .15
4.15
4.78
4.69
5.31
4.81
6.72
3/
4.53
3.94
ootnotes on page 2.
5 . 92
5.99 7.05
6.88 7.72
3/ 6.71
6.48 4.90 5.68 6. 14
6.26
8.09 10.97
6.96
3. 75 5.03 5.18
4.71 4.28
3. 82 4 . 29 4.31
3 .9, 4. 34
3/ 4.42
3/ 5.87
3/
45..0036
~
..,
4.10 4. 74
3/ 3/
4.62 ~
4.4\~~~
3/
~ ~\~' 44.2.973~~3-\t9
4.75
4.25 ':>
65..2327
.JJ , ..~.'(\
3/ 3/ 3/
6.9 2
uG . 43.5/6
' 7'
53.6/1
Agrlcu1tural Statisticlan and Georgia Depart.ent of Agricu1ture
Other
3.38 5 . 29 4.48 4.33 4.32 3.66 4.79 3.78 4.67 3.99 4.86 4.21 4.10 4.93 4.54 5.50 6.66
3/ 4.64
State and
ReR.ion 2/
.
GFR-8'>-Vol. 10
WORKERS ON FARMS BY STATE. REGION AND
I I All Farm Workers
p y
I
IR 6
[' ~& D a
I 6
,191 4
o v
----- thousands -----
Southeast
120
59
17
44
27
17
Florida
104
19
3
82
57
2S
Appalachian I
136
68
22
46
29
17
Appalachian II
177
118
28
31
13
18
Delta
126
61
16
49
37
12
Northeast I
129
so
28
Sl
35
16
Northeast II Lake
128
S3
348
187
34
41
86
75
32
ss
9 20
Cornbelt I
245
156
42
47
33
14
Cornbelt II
273
172
62
39
28
11
Northern Plains
234
147
52
35
27
8
Southern Plains
272
lSI
36
85
69
16
Mountain I
81
40
18
23
17
6
Mountain II
66
34
IS
17
13
4
Mountain III
47
8
19
20
16
4
Pacific
lOS
40
13
52
32
20
California
217
48
9
160
130
30
Hawaii
13
2
1
10
9
1
U.S. ~~t~~e_!l)
2,821
1. 413
SOl
907
659
248
tate and ReR.ion 2/
HOURS WORKED PER WEEK AND WAGE RATES FOR ALL HIRED WORKERS, BY STATES AND REGIONS. APRIL 7-13. 1985 1/
our
Southeast Florida Appalachian I Appalachian II Delta Northeast I Northeast II Lake Cornbelt I Cornbelt I I
Northern Plains Southern Plains Mountain I
Mountain II
Mountain III Pacific California
Hawaii
34.7
36.2 37.0 30.7 40.0
55.7 45.7 52.0 42.7
45.5 53.0 38.2 55.8
50.4
45.1 48.3 38.2
30.4
35.1 34.1
32.7 27.4 37.7 40.0
34.7 35.3 34.1
36.2 41.0 37.2 37.8
30.3
34.8 34.6 35.1
30.5
33.3 37.2 33.9 27.0 46.0 41.1
39.6 36.6 33.8 39.4
45.2 41.4 50.2
45.1
47.1 41.9 44.1
38 . 6
3.51 4.84 3.84 3.90 3.93 4.00 4.48 3.92 4.42 4.08 4.79 4.39 3.98 4.54
4.41 4.93 5.57
7.63
U.S. (49 States)
44.2
35.7
40.1
4.52
l/ Excludes agr1cultural service workers. 2. Reg1ons cons1st of the follow1ng:
-
Southeast-AL,GA,SC; Appalachian I-NC,VA; Appalachian II-KY,TN,WV; Deltg-AR,LA,MS;
Northeast I-CT,ME,MA,NH,NY,RI,VT; Northeast II-DE,MD,NJ,PA; Lake-MI,MN,WI; Cornbelt I-
IL,IN,OH; Cornbelt II-IA,MO; Northern Plains-KS,NE,ND,SD; Mountain I-ID,MT,WY;
Mountain II-CO,NV,UT; Mountain III-AZ,NM ; Pacific-OR,WA. 3/ Insufficient data for
this category. Data included in all hired farm workers and in region and U.S. wage
rates.
2
CATTLE ON FEED IN 7 STATES UP 2 PERCENT
Cattle and calves on feed May 1 for the slaughter market in the 7 states preparing monthly estimates totaled 7.50 million head, up 2 percent from a year ago and 4 percent more than May 1, 1983.
Marketings of fed cattle during April totaled 1. 60 million, a 5 percent increase from last year and 9 percent above April two years ago.
Placements of cattle and calves on feed in the 7 states during April totaled 1.42 million, 6 percent below last year and 10 percent below 1983. Net placements of 1.28 million for April were down 4 percent from last year and 10 percent below April 1983.
Other disappearance totaled 133 thousand head compared with 184 thousand during April 1984 and 143 thousand two years ago.
CATTLE AND CALVES: NUMBER ON FEED, PLACEMENTS, MARKETED, AND OTHER DISAPPEARANCE,
7 STATES, APRIL 1 TO MAY 1
1985 as i.
Item
1984
1985
of 1984
1,000 Head
On Feed, April 1 1/
7,568
7,814
103
Placed on Feed during April
1,515
1,417
94
Fed Cattle Marketed during April
1,523
1,603
105
Other Disappearance during Apri 1 2/
184
133
72
On Feed May__l_1L
_______ 7,3_76_
7,495
102
1/ Cat tle and calves on feed are animals for slaughter marke t being fed a full
rati on of grain or other concentrates and are expected to produce a carcass that
will g rade goo d or better. 2/ Incl udes death losses, mo vement from feedlots to
pastures and shipments to other feedlots for further feeding.
GEORGIA'S MILK PRODUCTION DOWN 3 PERCENT
Georgia's dairy herds produced 11! million pounds of milk during April 1985, 3 percent less than last year, and 3 percent below March 1985.
U.S . APRIL MILK PRODUCTION TOTALED 12.0 BILLIO~ POUNDS
Milk production during April 1985 totaled 12.0 billi on pounds, 3 percent more than April 1984.
The number of milk cows averaged 116,000 head during April, 5 percent less than a
year ag o and l percent bel ow last month. Production per cow averaged 960 pounds for the month, 25 pounds above last year, b ut 20 pounds per cow below March 1985.
Accumulated milk production for the first
four months totaled 45.6 billion pounds,
virtuallv t he same as the comoarable
period in 1984 .
-
Production per c ow averaged 1,101 pounds, 22 pounds more than April 1984.
The average number of m1lk cows in herds averaged 10.9 million head during April
1985, 1 percent more than both April 1984 and March 1985.
MILK COWS AND MILK PRODUCTION 1 APRIL 1984-1985
Georgia
:
United States
Item
Unit
1984
1985 :
19 84
1985
No . Milk Cows on Farms 1/ Thous. Head
122
116
10,810
10,903
Milk Production per Cow 2/ Pounds
935
960
1 ,079
1 '1 01
Total Milk Product ion 2/
Mil. Lbs.
114
111
11 1662
121007
1/ Includes dry cows, excludes heifers not yet fresh. 2/ Excludes milk sucked by calves .
The Geor ~ la Ferm Report (ISSN-0744-7280) Is published semi -monthly by the Georgia Crop Reporting Service, Stephens Federal Bui lding, Athens, Ga . 30613, Lerry E. Snipes, Statistician In Charge. Second c lass postage paid t Athens, GA . Subscription tee SIO per year except tree to dat contributors, Subscription lnt ormetlon available from: Georgie Crop Reporting Serv ice, Stephens Federal Build ing , Suite 320, Athens, GA. 30613 Telephone: (404) 546-2236,
3
GEORGIA'S RED MEAT PRODUCTION
Georgia's red meat production totaled
37,152 million pounds during April 1985, down 1 percent from April 1984. The January-April 1985 red meat production of 134,596 million pounds was 14 percent less than the 155,873 million pounds produced during the same period of 1984.
The number of cattle slaughtered by
commercial plants in Georgia during April
1985 was 22,300 head, an increase of
2,400 head from April 1984.
Calves
slaughtered during April totaled 2,200,
900 head more than the 1,300 head
slaughtered during April 1984.
There were 157,500 hogs slaughtered in Georgia's commercial plants during April 1985. This was 13,300 head less than the
number slaughtered during April 1984.
GFR-85-Vol. 10 U.S. RED MEAT PRODUCTION
Commercial red meat production for the United States in April 1985 totaled 3.29
'billion pounds, up 7 percent from April 1984. January-April red meat production, at 12.8 billion pounds, was up 1 percent from last year.
Beef production, at 1.94 billion pounds,
was up 9 percent. Cattle kill totaled
2.97 million head, an increase of 4
percent.
The average live weight
increased 30 pounds to 1,097.
Veal production, at 41 million pounds,
was up 14 percent.
Calf slaughter
totaled 270 thousand head, up 9 percent,
averaging 254 pounds live weight or 8
pounds heavier than l a st year.
Pork production, totaled 1.29 billion
pounds, an increase of 4 percent. Hog kill totaled 7.38 mi llion head, an
increase of 3 percent, averaging 245 pounds live weight, up 3 pounds.
Soecies
Georgia Cattle Ca l v e s Hogs Sheep & Lambs
GEORGIA AND UNITED STATES LIVESTOCK SLAUGHTER 1/
Number Slaughtered
: Average
1985
Jan.-Apr. : Live Weight
Apr i l
as 7. of '85 as 7. of :
April
1984
1985
1984
i 98 4
: 1984
1985
1,000 Head
Percent
Percent
Pounds
19 . 9
22.3
112
103
906
899
1.3
2.2
169
128
34 3
350
170.8 157.5
92
80
230
233
. 1
. 1
100
100
101
94
Total
Live Weight
April
1984
1985
1,000 Pounds
17,979 438
39,231 6
20,088 778
36,639 7
United States
Cat tle
2,854 . 6 2, 970.6
10 4
99
1, 067 1,097 3,046,611 3 ,25 9,378
Calves
248.4 270.0
109
10 2
246
254
61,087
68,539
l~gs
7,161.1 7,380 .9
103
98
242
245 1,734,382 1,807,314
Sheep & Lambs
615.8
534.3
87
92
112
113
68,742
60, 417
1/ Includes slaughter under Federal I nspec tion and o ther commercial slaughter, excludes
farm slaughter.
COMMERCIAL RED MEAT AND LARD PRODUCTION: UNITED STATES WITH COMPARISONS 1/
April
1985 as 7. :
Jan. -Apr.2/
1985 as 7.
Kind
1984
1985
of 1984 : 1984
1985
of 1984
Million Pounds
Percent
Million Pounds
Percent
Beef
1,776
1 ,935
109
7,485
7,626
102
Veal
36
41
114
152
159
105
Pork
1,233
1,288
104
4,971
4,906
99
Lamb & Mutton
34
30
88
132
123
93
Total Red Meat
3,079
3,294
107
12,739
12,814
101
Lard 3/
79
81
. 103
314
309
98
1/ Based on packers dress weights and excludes farm slaughter. 2/ Accumulated tota l s
based on unrounded data. 3/ Preliminary lard production includes rendered pork fat.
4
Commoditv
COLD STORAGE STOCKS 2 UNITED STATES 2 APRIL 30 2 1985
April 30,
March 31,
April 30,
1984
1985
1985
I A
1,000 Pounds
Butter
532,356
291,669
271,401
Cheese, Natural
1,182,416
907,723
891,982
Eggs, Frozen
12,674
13,526
13,174
Fruits, Frozen
444,440
512,055
456,173
Fruit Juic;:es, Frozen
1,374,694
1,472,412
1,579,636
Meats, Red
777,537
721,245
774,653
Beef, Frozen
324,578
333,953
327 ,499
Pork, Frozen
390,403
314,114
370,569
Poultry, Frozen
265,004
300,084
334,623
Turkeys , Frozen
142,224
131,058
157,723
Vegetables, Frozen
1 , 226,398
1,333,747
1,246,942
Potatoes, Frozen
808 , 168
1,003,290
1,024,214
Peanuts, Shelled
333,497
439,821
446,568
Peanuts, In Shell
21,697
48,859
48,392
Pecans, Shelled
34,207
27,602
30. 153
Pecans, In She ll
103 951
77 685
68 666
Mar. 1985
Percent
51
93
75
98
104
97
103
89
115
107
100
107
101
98
95
118
126
112
111
120
102
93
127
102
134
102
223
99
88
109
6.6
B8
APRIL PEAN UT STOCKS
Peanut stocks in commerc i al storage on ~pril 30, 1985, totaled 2 . 23 billion pounds o f equiva lent farmer stock. This tot a l inc ludes 900 million pounds of a ctual farmer stock.
Shelled b i 11 i on s t oc k.
peanuts on hand totaled 1. 24 pounds of equivalent farmer Roasting stock totaled 8 4 .3
Peri od F:nciing
'iTOCKS OF
I Farmer Stock
Shelled Peanuts 2/
million pounds. There were no Commodity Credit Corporat i on uncommitted stock on hand a s o f April 30, 1985.
Shelled peanut stocks on April 30, 1985, totaled 936 million pounds of which 922 million pounds were edible grades and 14 .4. million pounds were o i l stocks. Edibl e grade stocks by type are Virginias, 194 million pounds; Runners, 656 million pounds; and Spanish, 71.9 million pounds.
oasting
ent
Stock
(In Shell)
.J anu a ry
1, 892,265
987,689
2 ,97 1 , 638
February
1 ,669,15 1
1 , 069,79 7
2 , 8 19,294
~ a rch
1 ,236,21 9
1,116,555
2 , 436,711
A r il
900 012
1 24 4 933
2 229 198
~x c1 uaes stoc s on rarm s .
nc u es stoc s
v or e
o r account o
1n
comme r ci al storages. Farmer stock on net weight bas i s. i! Includes shelled edible and
shel led oil stock. 3/ Actua l farme r stock, plus roast i ng stoc k, plus shelled peanuts X
1. 33.
Period End in
FARMER STOCK
HAND AT MONTH'S
CROP OF 1985 1 /
CCC Uncommitted
Stocks
Commercial Stocks
1,532,788 1,332,733
994,341
726 . 780
259,144 144, 744
39,9 4 7
0 or account o
5
POULTS PLACED DURING APRIL, U.S.
GFR-85-Vol. 10 TURKEY EGGS IN INCUBATORS, MAY 1, U.S.
The 20.5 million poults placed during April 1985, in the United States, were 7 percent above the placements during the same month a year earlier. There have been 114.4 million poults placed in the United States during the September 1984April 1985 period, up 6 percent from the same period last year. The West North Central geographic division ~placed the largest number of poults during April, which at 7.4 million, was 6 percent more than a year earlier.
The turkey eggs in incubators on Hay 1, 1985, totaled 27.3 million, 4 percent above the 26.3 million a year earlier. The West North Central geographic division had the most eggs in incubators on Hay 1, 1985, at 9.8 million, a 2 percent increase from a year earlier. The South Atlantic division was second with 6.7 million, an increase of 14 percent from a year earlier.
Geographic Division
Eggs in Incubators
Hay 1
1984
1985
Thousands
ALL TURKEYS Percent of Previous Year Percent
Poults Placed
During Apr. 1/
1984
1985
Thousands
Percent of
Previous Year
Percent
N. Atlantic E.N. Central W.N. Central S. Atlantic S. Central West
891 2,807 9,607 5,897 2,359 4, 778
76 1 2,839 9,767 6,739 2,543 4,654
u.s.
26,339 27,303
1/ Excludes exported poults.
85
606
535
88
101
1, 997
2,128
107
102
6,977
7 , 367
106
114
4,446
5~225
118
108
1,869
1. 916
103
97
3,248
3,368
104
104
19, 143 20 , 539
107
Georgia Hatching Other
Total Georgia Total U.S.
NUMBER OF LAYERS AND EGG PRODUCTION, APRIL 1985
No. Layers on
Eggs per 100
Total Eggs Produced
Hand-April
Layers-April
During April
1984
1985
1984
1985
1984
1985
Thousands
Number
Millions
5,223 13,274 18,497
277~~82
5,385 11,856 17,241 274,335
1,947 2,004 1,990 2,032
1,899 2,142 2,065 2,067
102 266 368 5,639
102 254 356 5,672
Item
Chickens Egg Type Broiler Type
Turkeys
EGGS IN INCUBATORS, MAY 1985, UNITED STATES
1984
1985
% of Year Ago
Thousands --
43,646 335,319
26,339
34,732
80
348,363
104
27,303
104
6
COMMERCIAL POULTRY SLAUGHTER 1/. APRIL 1985
7. of
Item
Apr. 1984
Mar. 1985 -Thousands-
I Apr.
year
1985 I..- ago
Jan. thru Apr.
1984
1985
- - -Thousands- - -
Youns Chickens
Georgia
49,203
54,384
55,751
113
197,045
202,128
United States
342,948
350,607
370,840
108 1,358,036 1,421,960
Mature Chickens
Light Type U.S.
11,684
12,942
12,881
110
43,521
58,681
Heavy Type C.S. Total U.S.
2,778 14,462
3,236 16,178
3,423
123
16,304
113
11,127 54,648
12,331 71,012
Total All Types, Ga. 3,056
3,205
2,856
93
11,441
13,810
Percent Condemned
Young Chickens
Georgia
1.4
3/NA
2/1.4
3/NA
United Stat-es
1.5
1.7
2/1.5
2/1.8
1/ Federally inspected slaughter data as collected by Meat and Poultry Inspection
Program. Current month data estimated by Market News Service. 2/ January-March
condemnations. 3/ Not available.
7. of year a ~to
103 105
135 111 130 121
POULTRY HATCHING AND PLACEMENT--APRIL 198~
% of
% of
Item
- -- -
Apr. 1984
Mar. 1985
I Apr.
1985
year ago
--Thousands--
Jan. thru Apr.
1984
1985
--Thousands--
year ago
Pullet Chicks Placed
Domestic (U.S.) 1/
Broiler Type
4,012
3,603
3,884
97
136' 420
13,975
102
Egg Type
309
289
343
111
1,023
1,008
99
Chicks Hatched
Broiler Type
Georgia
56,985
61,485
60,623
106
222,050
233,332
105
United States
394,806 418,967 411,828
104 1,519,470 1,596,226
105
Egg Type
Georgia
4,505
3,123
2,637
59
16,975
9,593
57
United States
47,936 36,963 41,068
86
168,007
134,775
80
Turkeys
Poults Placed
u.s.
19,143
18,610
20,539 . - _107 2/107,651 2/114,395
106
1/Reported by leading breeders, includes expected pullet replacements from eggs sold
during the preceding month at the rate of 125 pullet chicks per 30 dozen case of eggs.
2/Turkey poults placed Sept. 1984-Apr. 1985.
7
L)
-l O
~n
rnc .s.
V>
rn
('
r
t-"1 U; ,AJ
:t>
WAI
O-< v
0
c z
...... N < r
0 .c.....
\
c;,
m'
w
...L) 0
;;o 0 0
t-< 1 0
p
0
'J-,
I
"'.U...1.,
or~
00
,J)
Vl
~r-J
000 C.
"'"'
~:~:~r~~~~~J:!r ~~3...
--"8 .g "' 1M ,.
~0""" :'I
~"'('111C1l!.
~II-.
3... ;c.;. 1"1 ~
c:e!. II II :;-
Dt ~ OQ
.....
0
"...'.
a:1:11
~
""'
>'"CICil
~g~
l:"lo-!0
~g;~
1:"1 I
(")
~:n:
H Cll
ow
OC
>
il
"...'.o-l
w
GFR-85-Vol. 10
GEORGIA'S 1984 LIVESTOCK AND POULTRY CASH RECEIPTS UP 8 PERCENT
The sale of livestock, poultry and associated products brought Georgia farmers $1.81 billion in 1984, up 8 percent from the $1.68 billion in 1983. All of the increase was attributed to poultry and poultry products as livestock and livestock products were below 1983. Commercial broilers again lead the way in cash receipts with $835.5 million, an i ncrease of 23 percent from the previous year. Eggs were second in total cash receipts with $321.0 million, 15 percent more than 1983. Cash receipts fr om the sale of hogs totaled $217.5 mil lion, 5 percent less than 1983's total. Cat tle and calves had the l argest decline in cash receipts from a year ago, at $193.1 million, a drop of 24 percent from the $25 4.4 million in 1983 . Milk and c ream cash receipts were d~wn 8 percent to $184 .7 million.
GA . LIVESTOCK & POULTRY CASH RECEIPTS 1/
Item
1983
198 4
Thousand Dollars
Hogs
228,787
217,458
Cattle & Calves
254,410
193 , 125
Milk & Cream
200,1 00
184,690
Commercial Broilers 676,675
835,462
Other Chickens
15,556
20,314
Turkeys
24,110
34,578
Eggs
278,734
320,951
TOTAL
1,678,372 1,806,578
1/ The fiscal year for hogs, commercial
broilers , other chickens and eggs ends
Nov. 30. Others are on calendar year
basis. Total does not include products
or species not in t he Federal Estimat i ng
program.
8
v
At.foo. C.1
~P!i;i.E OR CIA
FARM REPORT
June 11, 198'i GFR-85-Volume 11
JUN 14 ).;.85
. . . ~ {
~0
GEORGIA CROP REPORTING SERVICE
stephens Federal Bldg.
S"uite 320
Athens, Georgia 30613
Phone: (404) 546-2236
HIGIILIGHrS: Agri.eu1tura1 LaDd Ya1ues Wheat Agri.eu1tura1 Prices Peaches
GEORGIA FARMLAND VALUE DECLINES
The average value of Georgia's farmland and buildings was $865 per acre on April 1, 1985, down 5 percent from the same date last year. This coupled with an expected 4 percent rise in the Consumer Price Index implies a 9 percent fall in real value. Urban pressures, demand for land for non-farm purposes, as well as farms used primarily for residences minimized the decline for agricultural land in Georgia.
U.S. FARMLAND VALUE CONTINUES DECLINE
On April 1, the value of farmland and buildings averaged $679 per acre, down 12 percent from 1984. Average values ranged from a low of $163 an acre in New Mexico to $3,525 in New Jersey. Increases were the greatest in six New England states, at 14 percent. The largest declines occurred in Iowa and Nebraska at 29 and 28 percent, respectively.
GEORGIA WHEAT PRODUCTION
Based on conditions as of June 1, t he 1985 Georgia wheat crop is est imated at 24.0 million bushels , up 11 perc ent or 2.4 million bushe ls from the May 1 forecast, but 23 percent or 7.2 million bushels less than the 1984 crop. Grain harvest is expected from 800 thousand acres with an average yield of 30 bushels per acre . For comparison, last year's harvested acres were slightly more at 890 thousand acres. Yield was 35 bushels per acre for the 1984 crop.
U.S. WINTER WHEAT CROP DOWN
The June 1 winter wheat production forecast is 1.89 billion bushels, 8 percent less than 1984's 2.06 billion bushels. Acreage for harvest is expected to be down 6 percent from last year. The expected yield is 39.1 bushels per acre, down .9 bushel from last year's yield.
WINTER WHEATA SELECTED STATESA JUNE 1, 1985
rea
Y1el
Production
State
Harvested
Bushels
1,000 Bu.
1,000 Acres
Ala.
350
33.0
11,550
Ga.
800
30.0
24,000
N.C.
680
30.0
20,400
S.C.
370
25.0
9,250
Tenn.
300
40.0
12,000
u.s.
48,402
39.1
1,892,438
FARM REAL ESTATE VALUES, U.S. AND SELECTED STATES
AVERAGE VALUE PER ACRE OF LAND AND BUILDINGS,
state
1977
FEBRUARY 1, 1977-81; AND APRIL 1, 1982-85
1978
1979
1980
1981
1982
1983
1984
Dollars
S.C.
600
653
773
900
972
980
946
927
Ga.
581
685
777
896
971
926
929
910
Fla.
861
981 1,149 1,381 1,565 1,518 1,576 1,608
Ala.
477
527
639
780
910
885
826
809
48 States
474
531
628
737
819
823
788
782
Agrlc:ultara1 Sblt:i.st:i.dan and Georgia Depart.ent: of Api.eult:are
1985
899 865 1,527 769 679
GEORGIA PRICES RECEIVED
Average prices received by Georgia
farmers at mi d-May were down from the
previous month.
Only harrows and
gilts, o ther chickens and broilers showed
an increase wh ile all other items pri ced
were lower. The Georgia Prices Received
All Commodity Index for May was 120
percent of the 1977 average, unchanged
from the previous month but 16 points
below last year.
GFR-8S-Vol. 11
U, .S. PRICES ~ECEIVED INDEX DOWN 2 POINTS
TWe May All Farm Products Index of Prices Received by Farmers decreased 2 points from April to 129 percent of its JanuaryDe c ember 19 77 average. Lower prices for tomatoes, cattle, wheat, milk, and soybeans were part i ally offset by hjgher pr i ces fo r o ranges, on ions, hay, lettuce, and potatoes. The Index was 16 points below a year ago.
?RICES RECEIVED BY FARMERS. MAY IS. 198S WITH COMPARISONS
Price
Geors!.ia
United States
per
May
April
May 1S,
May
April May 15,
Commodit
Unit
1984
198 5
1985
1984
1985
198S
Winter Wheat
$/Bu.
3 . 18
3.17
2.90
3.56
3.32
3.19
Oats
S/Bu.
1.84
1.69
1.62
Corn
$/Bu.
3.88
3.19
3.11
3.34
2.70
2.66
Cotton
Ct./Lb. 72.7
S4.0
1/54.0
72.7
55.9 1/55.6
Tobacco
Ct./Lb.
3/-
139.0 3/127.2
Soybeans
S/Bu.
8.26
S.98
5.85
8.12
5.87
5.71
Sweet potatoes
S/Cwt.
13.70 2/18.60
23.00 2/19.70
19.70
All Hay, baled 2/ $/Ton
85.00
73.40
78.90
Milk Cows, 4/5/
$/Head
890.00
885.00
Hogs
S/Cwt.
46.20
42.20
42.80
47.20
41.20
40.70
Sows
S/Cwt.
40.90
39.10
35.40
42.60
39.80
36.30
Barrows & Gilts
S/Cwt.
47.00
42.30
43 .20
47.70
41.40
41.10
Beef Cattle 6/
$/Cwt.
45.90
47.10
45.90
58.60
56.20
55.50
Cows 7/
S/Cwt.
41.10
39.10
37.60
39.40
39.70
39.80
Steers & Heifers
S/Cwt.
49.80
S3.70
53 . 00
62.70
59.60
58.80
Calves
S/Cwt.
52.40
60.30
59.50
60.80
65.40
64.20
All Milk
S/Cwt.
14.30
14.50 3/14.30
13.00
12.90 3/12.70
Turkeys 2/
Ct./Lb.
42 . 3
40.3
39.4
Chickens, Excluding
Bro ilers
Ct./Lb. 15.5
2/11.5
15 . 5
Com'l Broilers 8/ Ct./Lb. 32.5
26.0
3/27.0
33.8
28.8 3/29.1
Eggs, All 9/
Ct./Doz 83.1
2/60.5
58.0
69.2
2/53.0
50.0
ab le
Ct./Doz 64.5
2/41.2
38.7
62.0 2/45.1
41.7
Hatching
Ct./Doz. 135.0 2/115.0
110.0
1/ First half of month. 2/ Mid-month price. 3/ Entire month. 4/ Animals sold for dairy
herd replacement only. 5/ Prices estimated quarterly. 6/ "Cows" and "steers and heifers"
combined with allowance where necessary for slaughter bulls. 7/ Includes dairy cows sold
for slaughter. 8/ Liveweight equivalent price for Georgia. 9/ Average of all eggs sold
by farmers including hatching eggs sol~ at retail.
The Georgi~ F~rm Report <JSSN-0744-7280) Is pub l ished semi-monthly by the Georgi~ Crop Reporting Service, Stephens Fader~! Bul Jdlng, Athens, G~. 30613, Larry E. Snipes, St~tlstlclan In Charge, Second cl~ss post~ge paid ~t Athens, GA. Subscription fee $10 per year except free to dat~ contributors . Subscription Information av~llable from : Georgia Crop Reporting Service, Stephens Federal Bulld l ~ Suite 320, Athens, GA. 30613 Telephone: (404) 546-2236.
2
U.S. PRICES PAID INDEX UNCHANGED
CONSUMER PRICE INDEX
The Index of Prices Paid by Farmers for Commodities and Services, Interest, Taxes , and Farm Wage Rates for May was 165 percent of its 1977 aver age. The Index was unchanged from last month and last year. The feed and feeder livestock indexes were lower than fo r April, wh i le the fu e ls and energy i ndex was higher.
The April Unadjusted Consumer Price Index
for all urban consumers (CPI-U) at 320.1
(1967100) was 0.4 percent higher than in
March and 3.7 percent above April 1984.
On a seasonally adjusted basis, the CPI-U
was 0.4 percent above March. Continued
sharp increases in petroleum-based energy
costs pushed the transportation index up
0.8 percent. The medical care index was
0.6 percent above March.
Both the
housing and other goods and services
indexes increased 0.4 percent.
The
entertainment index was up 0.3 percent
but the apparel and upkeep index remained
unchanged.
Food and beverages index
declined 0.2 percent.
PRICES PAID BY FARMERS. MAY 15. 1985 WITH COMPARISONS
Price
Geor ia
:
United States
per
May 15, Apr. 15, May 15, : May 15, Apr. 15, May 15,
Commodit
Unit
1984
1985
1985 :
1984
1985
1985
Dairy Feed 164
S/Ton 200.00
165.00
168.00
197.00
171.00
170.00
Dairy Feed 187.
$/Ton 205.00
166.00
172.00
207.00
172.00
17 1. 00
Dairy Conct. 324
$/Ton 265.00
197.00
180.00
283.00
227.00
223.00
Hog Feed 147.-187.
S/Cwt .
12.00
10.40
10.50
~1.50
9.68
9.63
Hog Conct. 384-42% S/Cwt.
16.60
12.50
12.00
15.60
12.30
11.80
Beef Cattle Conct.
32 7.-36 7.
S/Cwt.
13.50
11.50
11.00
12.70
10.50
10.42
Cottonseed Meal 417. S/Cwt .
17.00
11.50
11.50
15.80
11.90
11.90
Soybean Meal 444
$/Cwt.
14.00
11.00
11.00
14.20
10.30
10.10
Bran Middlings
S/Cwt. S/Cwt.
11.50 10.00
11.50
1o : so
10.50 9.30
10.40 9.99
9.54 8.88
9.47 8.85
Corn Meal
S/Cwt.
9.90
9.10
8.70
8.87
7.56
7.41
Broiler Grower
S/Ton 240.00
225 . 00
200.00
246.00
207.00
199.00
Laying Feed
$/Ton 225.00
180.00
162.00
214.00
186.00
183.00
Chick Starter
S/Ton 235.00
205.00
185.00
233 . 00
206.00
205.00
Broiler-Feed Ratio 1/ Lbs.
2.7
2.3
2.7
2.7
2.8
2.9
Hog-Corn Ratio 2/
Bu.
11.9
13.2
13.8
14.1
15.3
15.3
Mi lk-Feed Ratio 3/ Lbs.
1.43
1. 76
1. 70
1.32
1. 51
1. 49
Egg-Feed Ratio 4/
Lbs.
7.4
6.7
7.2
6.5
5.7
5.5
1/ Pounds of broiler grower equal in value to 1 lb. broiler live weight. 2/ BUshels of corn
equal in value to 100 lbs. of hog live weight. 3/ Pounds of 167. dairy feed equal in value to
1 lb. whole milk. 4/ Pounds of laying feed equal in value to l doz. eggs.
1977100 Georgia Prices Received
All Commodities Crops Livestock & Products United States Prices Received
INDEX NUMBERS--GEORGIA AND UNITED STATES
April 1984
May 1984
April 1985
144
136
120*
137
137
123*
150
135
118*
146
145
131*
May 1985
120 122 118 129
Prices Paid 1/
165
Ratio 2/
88
165
165*
165
88
79*
78
1/Mid-month index including interest, taxes and farm wage rates. 2/ Ratio of Index of Prices Received to Index of Prices Paid, Interest, Taxes and Farm Wage Rates. * Revised.
3
u
C) (j
me
~..!:
VIm ;;c
.....
V'l
n1
n.....
...~
CD
)0
C> -<
(J'
0
c.
.z....
.$>N
<
0.,
.C"..>.
....
m'(i1 l l
0 0 :;Q C> (,) C> H I C>
0
..0 V1 I N
\J1 -.J
ON
oo
..0
Ul
~:::~r;:~o~ ~ !(!:;)
~II :::r
~
.. ~a .,. ~,o~ II :r~o -
!:) (!;
<!!.
a..._.
~~
:c!"C 0
;:
I'D
rao.-o
~ . .
:I 011
...""' Clll
a0 -
.....
0:::
C!CI
>"dtll
~g!!l
~C>l-l!~0~
I'd nI ~ ~ .s;:
HCil
w o
t::l
>
tll
"...'..>-!
w
GEORGI A PEACH PROSPECTS
The June 1 forecast of Georgia ' s 1985 peach crop is placed at 75 mil lion pounds. A crop of this size would be 75 million pound s below the 1984 total production, but unchanged from the May 1, 1985 forecast. Harvest through June 9 was 29 percent complete compared with 28 percent at this time last year.
U.S. PEACH CROP DOWN
The United States peach crop for 1985 is
forecast at 2.16 billion pounds, 18
percent less than last year's 2. 64
billion pound crop. Freestone production
is down 29 percent, while Cl ings t ones are
down 2 percent . Product i on from the n i ne
southern peach states is now forecast at
369 million pounds, down 52 percent from
the 1984 crop and unchanged from the May
1 estimate.
This sharply reduced
production was due to crop freeze damage
Texas is the only southern state that
expect s increased production.
PEACH PRODUCTION, SELECTED STATES, JUNE 1
i
Total ProductfOniTJ
State
I 1983
198~il<f-:-T9"8"5
Hi 11 ion Pounds
Ala.
14.0
22.0
1.5
Ark.
21.0
23.0
7.0
Ga.
100.0 150.0
75.0
La. 2/
6.0
7.0
6.0
Miss. 2/
4.0
5.0
2.5
N.C.
12.0
43.0
3/
Okla. 2/
s.c.
7.5 95.0
9.0 480.0
7.0 240.0
Texas
27.0
23.0
30.0
9 Southern States
286.5
762.0
369.0
California Freestone Clingstone
435.0 445.0 683.0 1,042.0
470.0 1,020.0
u.s.
Freestone 1,172.3 1,601.8 1,141.5 All Peaches 1, 855.3 2 643.8 2,161.5 1/ Includes unharvesteA product1on and harvested not sold (million pounds) : United States, excluding California clingstones, 1983-37.~, 1984-115.4. 2/ Estimate for current year carried forward from earlier forecast. 3/ No significant commercial production due to frost.
4
~ 4oo
;tEo
Cf9S/!~
FARM REPORT
June 26, 1985 GFR-85-Volume 14
HIGHLIGHTS Hog and Pig Inventory Livestock Slaughter Poultry Summary
GEORGIA
~ CROP REPORTING SERVICE
stephens Federal Bldg. Suite 320 Athens, Georgia 30613 Phone: ( 404) 546-2236
Cattle on Feed Milk Production
HOGS AND PIGS: INVENTORY NUMBER, SOWS FARROWING AND PIG CROP
Io U.S. 1
GEORGIA AND United
10 QUARTERLY States
STATES
1S/ 1t
a
1984 tes
AND
198~
Georgia
Item
1984
198~
1984
198~
1984
198J
(000)
(000)
(000)
June 1 Inventor:~::
All Hogs and Pigs
~2,8 1 ~
~2,0~0
41,91~
41,4~0
1,320
1,200
Kept for Breeding
7,401
6,997
~. 771
~.397
200
16~
Market Hogs
4~,414
4~,0~3
36,144
36,0~3
1,120
1,03~
Market Hoss and Piss
6:~:: gef~fit Grou2s
Under 0 Pounds
19,377
18,968
1~,437
~~.168
493
4~0
60-119 Pounds
11,387
11,100
9,187
9,000
302
28~
120-179 Pounds
8, Ill
8,14~
6,361
6,44~
202
190
180 Pounds and Over
6,~39
6,840
~.1~9
~.440
123
110
Sows Farrowin~ December 2/- ebruary
March-May December 2/-May
June-August September-November
June-November
2,~60
3,126
~.686 2,9~~
2,901
5,8~6
2,52~
3,040
~.~65
3/~.613
1,964 2,481
4,44~
2,n9 2,316
4,~75
1,93~
2,420 4,35S 3/2,149 3/2,234 3/4,383
66
60
77
70
143
130
72
:J/64
68
3/~8
140
3/122
PiB Cro2
Decemoer 2/-February
18,73~
18,988
14,288
14.538
462
432
March-May
23.~87
23,512
18,814
18,762
~54
H8
December 2/-May
42,322
42,500
33,102
33,300
1,016
9~0
June-August
22,346
17,158
511
September-November
21,808
17,420
483
June-Noveber
44,154 4/42,098
34,~78
994
Pigs 2er Litter
Number
Number
Number
Decemoer 2/-February
7.32
7.~2
7.27
7.51
7.00
7.20
March-May
7 . ~4
7.73
7.~8
7.75
7.20
7.40
December 2/-May
7.44
7.64
7.45
7.6~
7.10
7.31
June-August
7.~6
7.60
7.10
September-November
7.52
7.52
7.10
June-November
7.~4
4/7.~0
7.56
7.10
l/ GA, IL,IN,IA,KS,MN,MO,NB,NC,OH. 2/ December preceding year. 3/ Intentiorili.-- 4/Average
number of pigs per litter with allowance for trend used to compute indicated June-November
pig crop.
Agrlcoltural Satf.stic-..:l.an aDd Georgia nepart:.en~ of Agrlcultare
GEORGIA HOG INVENTORY DOWN 9 PERCENT
GFR-~ol. 14 U.S. INVENTORY DOWN r PERCENT .
Inventory of all hogs and pigs on Georgia
farms on June 1, 198S, totaled 1,200,000
head, 9 percent less than a year ago.
This is the lowest June 1 inventory since
196S, but is 4 percent above March 1 of
thi s year.
Hogs kept for breeding
totaled 16S,OOO head, 17 percent less
than the previous year.
Ma rket hog
inventory, at 1 ,03S,OOO head is 8 percent
less than a year ago , but S percent more
than March 198S.
Inventory of all hogs and pigs in the U.S. on June 1, 198S, is estimated at S2.1 million head. This is 1 percent below a year ago and 10 percent below June 1, 1983. Breeding inventory, at 7.00 million head, is S percent below a year ago and is the smallest June breeding inventory since U.S. inventory estimates were first established in 1964. Market hog inventory, at 4S.1 million head, is 1 percent below a year ago and
10 percent below two years ago.
SJ:!ecies
Georgia Cattle Calves Hogs Sheep & Lambs
GEORGIA AND UNITED STATES LIVESTOCK SLAUGHTER 1/
Number Slaughtered
: Average
1985
Jan. -May : Live Weight
May
as % of '85 as % of :
May
1984
1985
1984
1984
: 1984
1985
1, 000 Head
Percent
Percent
Pounds
22. 2
24.2
109
104
914
910
1.2
1.4
117
126
324
336
184.2
153.6
83
81
231
233
. 1
1
100
100
84
106
Total
Live We ight
May
1984
1985
1,000 Pounds
20,311 394
42,606 8
21,984 482
35,789 8
United States
Cattle
3,301.4 3,173.4
96
98
1,063 1,103 3,509,654 3,501,026
Calves
254.7 264.5
104
103
255
266
65,411
70,241
Hogs
7 , 367.3 7,563.1
103
99
245
247 1,801,420 1,864,729
Sheep & Lambs
573.4
509.3
89
92
110
113
62,981
57,658
1/ Includes slaughter under Federal Inspection and other commercial slaughter, excludes
farm slaughter.
COMMERCIAL RED MEAT AND LARD PRODUCTION: UNITED STATES WITH COMPARISONS 1/
May
1985 as % :
Jan.-May 2/
1985 as %
Kind
1985
of 1984 : 1984
1985
of 1984
Million Pounds
Percent
Million Pounds
Percent
Beef
2,060
2,088
101
9,545
9,714
102
Vea l
39
42
108
190
201
106
Pork
1,281
1,328
104
6,252
6,234
100
Lamb & Mutton
31
29
94
163
152
93
Total Red Meat
3,410
3,086
102
16,150
16,301
101
Lard 3/
80
83
104
394
392
99
1/ Based on packers dress weights and excludes farm slaughter. 2/ Accumulated totals
based on unrounded data. 3/ Preliminary lard production includes rendered pork fat.
MILK COWS AND MILK PRODUCTION, MAY 1984-1985
Georgia
United States
Item
Unit
1984
1985
1984
1985
No. Milk Cows on Farms 1/ Thous. Head
120
116
10,805
10,984
Milk Production per Cow 2/ Pounds
950
970
1,132
1,164
Total Milk Production 2/
Mil. Lbs.
114
113
12,227
--~790
1/ Includes dry cows, excludes heifers not yet fresh. 2/ Excludes milk sucked by calves. 2
CATTLE AND CALVES: NUMBER ON FEED, PLACEMENTS, MARKETED, AND OTHER DISAPPEARANCE,
7 STATES, HAY 1 TO JUNE 1
1985 as ~
Item
1984 1,000 Head
1985
of 1984
On Feed, Hay 1 1/
7,376
7,495
102
Placed on Feed during Hay
1,798
1,666
93
Fed Cattle Marketed during Hay
1,637
1,589
97
Other Disappearance during Hay 2/
219
128
58
On Feed June 1 1/
7,318
. 7_.. 444
102
1/ Cattle and calves on feed are animals for slaughter market being fed a full
ration of grain or other concentrates and are expected to produce a carcass that
will grade good or better. 2/ Includes death losses, movement from feedlots to
pastures and shipments to other feedlots for further feeding.
Georgia Hatching Other
Total Georgia Total U.S.
NUMBER OF LAYERS AND EGG PRODUCTION, MAY 1985
No. Layers on
Eggs per 100
Total Eggs Produced
Hand-May
Layers.,..May_. ________ Dui" i n_g_!"!liY
1984
1985
1984
1985
1984
1985
Thousands
Number
Millions
5,259 13,090 18,349 275,995
5,366 11,268 16,634 270,838
1,987 2,012 2,000 2,079
1,972 2,086 2,050 2,112
104 263 367 5,738
106
23~
341
~ ~721
Item
Chickens Egg Type Broiler Type
Turkeys
EGGS IN INCUBATORS, JUNE 1985, UNITED STATES
1984
1985
--Thousands--
43,833 337,060
27,260
31,690 348,493
27,607
7. of Year Ago
72 103 101
POULTRY HATCHING AND PLACEMENT--HAY 1985
7.-of
x-oT
Item
May
Apr.
May
year
Jan. thru May
year
1984
1985
1985 ago
1984
1985
ago
--Tfiousands--
--Tliousands--
Pullet Chicks Placed
Domest1c (U.S.) 1/
Broiler Type
3,520
3,884
3,672 104
17,162
17,647
103
Egg Type
437
343
253 58
1,460
1,261
86
Chicks Hatched
Broiler Type
Georgia
58,321
60,623
63,006 108
280,371
296,338
106
United States
408,825 411,828
423,951 104 1,928,295 2,020,177
lOS
Egg Type
Georgia
4,795
2,637
2,966 62
21,770
12,559
58
United States
49,005
41 ,068
39,066 80
217,012
173,841
80
Turkeys
Poults Placed
u.s.
2_L_2_{t3 20,539
21,859 103 2/128,894 2/136,254 106
11 Reported-by leading breeders, includes expected pullet replacements from eggs
sold during the preceding month at the rate of 125 pullet chicks per 30 dozen case
of eggs. 2/Turkey poults placed Sept. 1984-May 1985.
3
COMMERCIAL POULTRY SLAUGHTER 1/, MAY 1985
% of
% of
Item
May
Apr.
May
year
Jan. thru May
year
1984
198~
198~
ago
1984
1985
ago
- - -Thousands- - -
- - -Thousands- - -
Young Chickens
Georgia
~2,443
~~.751
~3,183
101
249,448
255,311 102
United States
387,890 382,701
390,997
101 1,745,926 1,828,619 105
Mature Chickens
Light Type U.S .
13,657
13,535
12,037
88
~7,178
71,711 125
Heavy Type U.S.
Total u.s.
2 , 965 16,622
3,~12
17,047
3,233
109
1~,270
92
14,092 71,270
15,653 111 87,364 123
Total All Types, Ga. 3,510
2,856
3,150
90
14,951
16,960 113
Percent Condemned
Young Chickens
Georgia
I .4
3/NA
2/1.4
3/NA
United States
1. 4
1. 6
2/1.5
2/1.7
1/ Federally inspected slaughter data as collected by Meat and Poultry Inspection
Program. Current month data estimated by Market News Service. 2/ January-April
condemnations. 3/ Not available.
Georgia Crop Reporting Service
Stephens Federal Bldg.
Suite 320 Athens, Georgia J 0& 13
.'--
4 lRO 1 3 0 0
I
95 - 25 7 _09520
00
J8
T
A y
GA 30o 2
SECOND-CLASS POSTAGE PAID AT ATHENS, GA 30613
'V'I
f\ '-/00 , ~7
~~ CEO
g 5/13
FARM
REPORT
July 2, 1985 GFR-85-Volume 13
~"
Received
3 ' U' v ' L. l~'. ) ~ :) cc..
uu~ u ll'-.1~ r~
- c U~" 1 1
f )
GEORGIA
~ CROP REPORTING SERVICE
stephens Federal Bldg.
Suite 320 Athens, Georgia 30613
Phone: (404) 546-2236
HIGHLIGHTS Peanut Stocks Agricultural Prices Cold Storage
Shelled peanuts on hand totaled 1.36
billion pounds of equivalent farmer
stock.
Roast i ng stock totaled 80.2
million pounds. There were no Commo dity
Credit Corporation uncommitted s t ock on
hand as of May 31, 1985.
MAY PEANUT STOCKS
Peanut stocks in c o mme rc ial storage on May 31, 1985, total e d 2 . 0 4 billion pounds of equivalent farmer stoc k. This total includes 602 mil l i o pounds of actual farmer stock.
Shelled peanut stocks on May 31, 1985,
totaled 1.02 billion pounds of which 1.01 billion pounds were edible grades and 14.4 million pounds were oil stocks. Edible grade stocks by type are Virginias, 200 mi llion pounds; Runners, 736 million pounds; and Spanish, 70.7 mi l lion pounds.
STOCKS OF f EANUTS AND SPECIFIED PRODUCTS AT MONTH'S END, CROP OF 1985 1/
Pe riod
Fa r me r
Shelled
Roasting Stock
Farmer Stoc k Equivalent
Shelled
Total
Ending
Stock
Peanuts 2/
(In Shell)
Peanuts
3/
1,000 Pounds
January
1,892,265
742,623
91,684
987,689
2 , 971,638
February
1,669,151
804,359
80,3 4 6
1,069,797
2 , 819,294
March
1,236,219
839,515
83,937
1,116,555
2,436,711
April
902,757
938,273
84,322
1,247 ,903
2 ,234,981
May
601,507
1,020,910
80,246
1,357,811
2,039,543
1/ Excludes stocks on farms. I ncludes stocks owned by or held for account of CCC in
commercial storages . Far mer stock on net weight basis. 2/ I nc l udes shelled edible
and shelled oil stock. 3/ Actual farmer stock, plus roasting stock, plus shelled
peanuts X 1.33.
FARMER STOCK PEANUTS, BY TYPES, ON HAND AT MONTH'S END, CROP OF 1985 1/
Spanish (by Areas)
Virginia
Total
Period
Virginias
Runners
North
South
South
Total
All
Ending
Carolina
East
West
Types
1,000 Pounds
January
288,966
1,532,788
579
69,932 70,511 1,892,265
February
288,029
1,332,733
0
571
47,818 48,389 1,669,151
March
207,652
994,341
0
520
33,706 34,226 1,236,219
April
151,273
729,525
0
0
21,958 21,958
902,757
Hay
91,210
493,115
0
0
17,182
17,182
601,507
1/ Excludes stocks on farms. Includes stocks owned by or held for account of CCC in
commercial storages. Faraer stock on net weight basis.
Agricultural .statiatic:l.aa aDi Georpa Depart:.-t of .&8rica1blre
;EORGIA PRICES RECEIVED
\v e rage pr ices rece i ved by Ge orgia farmer s at mid-June were up from the previous mon th. Higher p rices for wheat, corn, cot ton , harrows and g ilt s, other c hick e ns, b r o il er s, and market eggs wer e partially off s et hy lowe r prices for soybeans , sows, beef ca t tle , cal ves, mil k, and hat c hing eggs. The Ge orgia Prices Recei ved All Commodity Index for June wa s 122 percent of the 1977 average, 3 po int s h i g her than the pre v iou s month but 12 poi nts lower than la st year.
"
OF'l-85- Vol. 13
PR I CES RECE IVED INDEX UNCHANGED
The June Index of Prices Received by farmer s for a ll farm product s was unchanged f rom May at 129 percen t o f its Janua ry-December 1977 a verage . Hi gher prices for hogs, tomatoes, potatoes, broilers, and cotton were offset by lower pri c es for cattle, milk, wheat, hay, feed grains, and lettuce . The Index was 15 points below a year ago .
PRICES RECEIVED BY FARMERS. JUNE 15 . 1985 WITH COMPARISONS
Price
Geor_g_i a
United States
per
June
May
June 15,
June
May
June 15,
Commodi tv
Unit
1984
1985
1985
1984
1985
1985
Winter Wheat
$/Bu .
3.22
2.86
2.9 1
3.36
3.14
3.03
Oats
$/Bu.
1.80
1. 59
1. 55
Corn
$/Bu.
3.94
3.07
3. 11
3.36
2.67
2.64
Cotton
Ct./Lb.
53.0
1/56.0
68.0
54.7
1/58 . 1
Tobacco
Ct./Lb.
127.2
Soybeans
$/Bu.
8 .00
5.83
5.80
7.99
5.70
5.66
Sweet potatoes
S/Cwt.
12.60 2/19.70
20.50
All Hay, baled 2/
$/Ton
78.00
78.90
71.80
Hogs
S/Cwt.
48.60
42.90
44.30
49.00
41.40
43.70
Sows
S/Cwt .
38.10
35.80
34.50
42.10
36 . 90
36.20
Barrows & Gilts
$/Cwt.
50.50
43.20
44.80
50.10
41.80
44.50
Beef Cattle 4/
$/Cwt .
43.00
45.30
43.90
57.60
55.30
54.50
Cows 5/
$/Cwt.
38 .50
38.60
36.70
39.10
39 . 30
37.60
Steers & Heifers
$/Cwt.
47.70
52.70
52.00
61.50
58 .40
57.90
Calves
$/Cwt.
49.40
59.10
57. 00
59.20
65.60
64.00
All Milk
$/Cwt.
14 . 20
14.10 3/14.00
12.90
12.50 3/12 .20
Turkeys 2/
Ct./Lb.
42.0
39 .4
41. 4
Chickens, Excluding
Broilers
Ct . /Lb.
9.5
2/15. 5
19.5
Com'l Broilers 6/ Ct./Lb. 32.0
27.0
3/29.5
33.4
29.1
3/3 1.1
Eggs, All 7/
Ct. /Doz 75.6
2 /58.0
61.0
61. 2
2/)0. 0
53.2
Table
Ct./Doz 57 . 6
2/38.7
45.2
53 .8
2/4 1.7
4 5.5
Hatching
Ct./Doz. 125. 0
2/1 10.0
100.0
1/ First half of month. 2 / Mid-mo nt h pri c e. 3 / Entire month . 4/ "Cow s " and "s teers a nd
heifer s" comb ined with a llowance where ne cessary for slaug hter bulls. 5/ In cludes d a iry
cows sold for slaughte r. 6/ Livewe ight equivalent pric e for Georgi a . 7/ Ave r age of a l l
eggs sold by farmers including hatching eggs sold at r etail .
The Georgl o Form Report <I SSN- 074 4-7280) Is published semi -monthl y by the Georgia Crop Reoortlng Service, Steohens Fed erol Bu l ld l ng, ~the n s, Go. 306 13, Larry E. Sni pes, St atistic ion In Charge. Second class postoge paid ot Athens , GA . Subscripti on tee SiO pe r year e~ cep 1 t r ee to dota contri butors. Subscr i ption i ntorma t lon avol lobl e trom : Georglo Crop Reporting Service, Stephens Federa l Bul !ding, Suite 320, Athens, GA. 306i3 Telephone : (404) 546-2236.
2
PRICES PAID INDEX DOWN 1 POINT
CONSUMER PRICE INDEX
The June Index o f Pri c es Pai d by farmers for commod i t ies and services, i ntere s t, taxes, and farm wa ge rates was 164 percen t of its 19 77 a v erage. The ind ex for Ju ne was 1 p oint below both a month and a year ear lie r. The f e eder l i vestock and feed indexes were down f r om May wh i le the fami ly living component was h igher. The tractor price index was l ower than three months ago as incent i ves offered by deal ers a nd manufacturers lowered prices.
The May u nad ju ~ ted co n s umer price i ndex for all urban consumers (CPI-U) at 3 21.3 (196 7=100) was 0 . 4 percent higher t ha n i n Apr i l and 3.7 pe r cent above May 1984. On a seasonally ad j usted bas is , t he CPI - U was 0.2 percent above April . Higher cost s for med i cal care and renters' and homeowners ' costs pus hed both the medical care and housing i nd e xes u p 0.6 percent .
PRICES PAID BY FARMERS. JUNE 15. 1985 WITH COMPAR ISONS
Pr i c e
Geo rgia
Uni t ed Sta t es
per
June 15, May 15 , J une 15,
June 15, May 1 5 , June 15,
Commodit y
Un i t
1984
1985
1985
1984
1985
198 5
Dai ry Feed 16k
$/Ton
190 .00
168.00
165 .00
195 . 00
170.00
168 .00
Dai ry Feed 18~
S/Ton
196.00
172.00
167.00
205.00
171.00
170.00
Dairy Gonet . 32 ~
$/Ton 255.00
180.00
172 .00
277.00
223.00
220.00
Hog Feed 1 4 ~-18~
S/Cwt .
12.00
10.50
10 .20
11.30
9 . 63
9.46
Hog Gonet . 387.-42~
S/Cwt.
15 .50
12.00
11.50
15.30
11 . 80
11.60
Beef Cattle Gonet.
327.-36~
S/ Cwt .
14 . 00
11.00
11.00
12.60
10 . 42
10.20
Co ttonseed Meal 417. S/ Cwt.
16.50
11 . 50
11. 50
15 . 40
II . 90
11.50
Soybean Meal 44~
S/Cwt.
14.00
11.00
10 . 50
13.60
11. I 0
9.82
Bran
$/Cwt .
11.50
10.50
10.50
10 . 40
9.47
9 . 48
Middlings
S/Cwt.
10.50
9.30
10.00
9. 83
8.85
8.84
Co rn Meal
$/Cwt.
10.50
8 . 70
9 . 10
8 . 96
7.41
7.40
Broiler Grower
$/Ton 245.00
200 . 00
200.00
243.00
199.00
198 . 00
Laying Feed
S/Ton 205.00
162 . 00
162.00
212.00
183.00
182.00
Chick Starter
S/ Ton 220.00
185.00
185. 00
229 . 00
205. 00
202.00
Broiler-Feed Rat io 1/ Lbs.
2.6
2.7
3.0
2.7
2.9
3.1
Hog-Corn Ratio 2/
Bu .
12 . 3
14. 0
14.2
14 .5
*15.5
16.6
Milk-Feed Rat i o 3/ Lbs .
1.49
1. 68
1. 70
1. 31
1.49
1.45
Egg-Feed Rat i o 4/
Lbs .
7.4
7.2
7. 5
5 .8
5. 5
5.8
*Re vised . 1/ Pounds of bro i l e r gr owe r equal in val ue to 1 lb. br o il e r li ve weight. 2/ Bu shels
of c orn equal in value to 100 lhs. of hog li ve we i gh t. )/ Pound s o f 167. dairy feed equal
in va l ue to 1 lb. whol e milk. 4 / Pounds of laying feed equal in value to I doz. eggs.
INDEX NUMBERS--GEORGIA AND UNJTF. D STATES
1977100
May 1984
June 1984
May 1985
J une 1985
Georgia
Pr i ces Received
All Commodities
136
134
119
122
Crops
13 7
13 7
121
122
Livestoc k & Products
13 5
131
118
123
United States
Pr i ces Recei ved Pri c e s Pai d 1/ Ra ti o 2/ !/Mid - mont h inde x
14 5 165
SA i ncludi ng inte r est,
144 16 5
87 ta xes a nd farm wa g e
12 9 16 5
78 r ates . 2/
Ratio o f
12 9 164
79 Index of
Pric es Recei ve d to I n d ex o f Prices Pa id, I n t e r es t , Ta x e s and Fa rm Wage Ra t e s.
3
COLD
Commodity
Butter Cheese, Natural Eggs, Frozen Fruits, Frozen Fruit Juices, Frozen Meats, Red
Beef, Frozen Pork, Frozen Poultry, Frozen Turkeys, Frozen Vegetables, Frozen Potatoes, Frozen Peanuts, Shelled Peanuts, In Shell Pecans, Shelled Pecans, In Shell
STORAGE STOCKS, May 31, 1984
538,489 1,207,993
12,836 406,500 1,462,403 818,851 312,801 437 , 718 301.777 180,935 1,094,891 843,309 342,997
23,506 35,401 88.760
UNITED STATES, April 30, 1985
1,000 Pounds 272,695 898,619 13,213 458,482
1,579,008 772,737 328,049 368,166 333,948 156 , 995
1 ,249,413 1,023,644
451,810 49,165 30,998 68,605
MAY 31, 1985 May 31, 1985
276,513 904,251
15,214 442,712 1,685,076 784,583 300,724 410,321 343,715 176,252 1,185,517 1,082,469 460,992
49,679 29, 106 57,045
Percent of
May 1984 Apr. 1985
Percent
51
101
75
101
119
115
109
97
115
107
96
102
96
92
94
Ill
114
103
97
112
108
95
128
106
134
102
211
101
82
94
64
83
Gftoorg1a Crop Reportmg
~ice
Stephens Federal Bldg.
Suite 320 Athens, Georgia 30613
SECOND-CLASS POSTAGE PAID AT ATHENS, GA 30613
42~=' 0 1 3 0 0 0 95 - 25 7 20 5 2
I
0 88
IV f G R I
JOCU E TS SE T IS~ RY
T E S
G
06 2
&A ~ '/OO.C. 7
FJrfORG/A
FARM REPORT
July 12, 1985 GFR-85-14
R
5198S
UUWIVIt.l" 1~
GA LIBRARIES
GEORGIA
~ CROP REPORTING SERVICE
stephens Federal Bldg. Suite 320 Athens, Georgia 30613 Phone: ( 404) 546-2236
HIGHLIGHTS: Planted and Harvested Acres July 1 Crop Forecast
GEORGIA CROP ACRES RELEASED
Grain Stocks 1984 Pecan Estimates Cold Storap,e
SOYBEAN ACREAGES DIP 14 PERCENT
The June Acreage report on plantings of
Soybean plantings for Georgia are
Georgia's row crops shows significant
estimated at 1.80 million acres tor 198 5.
changes in acreage planted to soybeans
This is a decline of 14 percent from last
and cotton, but only modest shift s for
year's 2.10 million acres. Through July
most other crops. Collectively, there
7, 97 percent of the intended soybean
are 334,000 fewer acres planted to 1985
acreage had been planted.
Survey
surveyed crops, bringing the aggregate
indications show 31 percent of the 1985
acreage down to 5.52 million acres, a 6
plantings
would be
doubl e-cropped
percent decline.
Surveys of Georgi a
(planted after another crop).
Acres
farmers conducted dur i ng late May and
projected for soybean harvest are 1.75
early June provided jnformation for the
million, down 12 percent from 1984.
acreage estimates.
GEORGIA ACREAGE A~D PR OD C CTIO~. 1984 A~D 1985
Acreage
Yield per Acre
Produc tion
Planteci
Crop
Unit for all
Har-
For
Indi-
Indi-
Purposes vested
Harvest
cated
cated
---------------
1985
1984 1/ 1985 1/ --Thousand Acres--
1984 1985 - -- --------
1984
1985
--Thou sands--
~eat
Bu.
950
890
825
35.0
30.0
31,150
24,750
Oats
Bu.
115
60
50
55.0
40.0
3,300
2,000
Rye
Bu.
450
80
100
22.0
21.0
1,760
2,100
Tobacco, Type 14 Lbs.
38
37
2,250 2,250
85,500
83,250
/1ppl es, All
Commercial
Lbs.
50,000
35,000
Peaches
Lbs.
150,000
80,000
Corn
Bu.
1,080
985
1,000
82.0
2/
80,770
2/
Soybeans
Bu.
1,800
2,000
1,750
20.0
2/
40,000
2/
Peanuts
Lbs.
610
640
607
3,375
2/ 2,160,000
2/
Sorghum Grain
Bu.
175
113
140
42 .0
2/
4 ,746
2/
Cotton 3/
Bales
250
172
2/
784
2/
281
2/
Hay, All
Ton
-
550
520
2.40
2/
1,320
2/
Sweetpotatoes
Cwt.
6.5
6.4
6.3
140
2/
896
2/
1/ Harvested for principal use. 2/ The first yield and production forecast will be
released at 3 : 00P.M., August 12 . 3/ Cotton yield in pounds per harvested acre,
production in bales.
Agrlca.ltura1 Statiatid.an and Georgia :oepart::.ent o W"ieultare
COTTON ACRES PLANTED EXPANDS 43 PERCENT A resurgence of interest in cotton l ifted plant i ngs to an estimated 250,000 acres, up 43 percent from last year. Acres for harvest will be surveyed about August and an estimate released on August 12, 1985. Planting progress this year was slower than average through the first week in May, but then surged ahead for an earlier t han average compl e tion.
HAY BELOW 1984
llay producers expect to harvest 520,000
acres in 198 5, 5 percent less than last
year's
550,000
acres.
Producers
indicated no change i n plans from their
February intentions .
SORGHUM PLANTED UP 6 PERCENT Sorghum planted and to be planted f or all purposes is forecast at 175,000 acres, up 6 percent from the 165,000 a c res plant e d last year. Far mers indi c ated t he y would harvest 140,000 acres for grain, up 24 percent from the 113,000 acres harves t e d for grain in 1984.
GEORG IA PEANUT ACREAGE OFF 5 PERCENT Peanut seedings in Georgi a are e stimated at 610,000 acre s f o r 1985, down 5 percent from 1984. Acres for harvest are also off 5 percent at 607,000 acres. Plan t i ng began on schedule and progressed at or slightly ahead of the average. The crop was in very favorable condition as of July 7, 198 5.
GFR-85-Vol. 14 GEORGIA TOBACQO CROP DOWN - SMALLEST IN 28 YEARS The initial 1985 production forecast f or Georgia's tobacco crop is 83.3 mi l l i on pounds, 3 percent below last year's 85 . 5 million pounds. The 198 5 tobacco crop is expected to be the smallest f or Ge o rgia in 28 years due to reduced ac reage. Indicated area for harvest is 37,000 acres, down 3 percent from the 38,000 acres harvested last year. The Stat e's yield estimate is 2,250 pounds per acre, unchanged from 1984 . Harvesting progress through July 7 ~as ahead o f last year but behind the 5-year average.
GEORGIA WHEAT PRODUCTION FORECAST 21 PERCENT LESS Georgia's 1985 wheat crop is estimated at 24.8 millio n bushels, up 3 percent from the June 1 forecast hut 21 percent or 6 . 4 million bushels le~s than the 1984 crop. Grain harvest is expected from 830,000 acres with an ave rage yield of 30 . 0 bushels per acre .
Georgi a ' s 1985 Oat crop was har ves ted
from 50,000 a cres, down 17 percent f rom
the 1984 c rop.
Yield was a ve ry
disappointing 40 bushels per acre a nd the
lowest yield since 1972.
Rye production in Georgia f or 1985 , at 2.1 million bushels, wa s 19 perc ent a bov e the 1984 crop. Harvested acres were estimated at 100,000 acr es an d yield was set at 21.0 bushels per acre.
State
I 1983
Al a bama
Florida
Georgia New Mexico No rth Carolina Oklahoma
South Carolina Texas Virginia
182.0
69.0
567.0 11.0
150.0
93 . 0
13.0 230.0
96.0
United States 11411.0
1984
221.0 85.0
643.0 14.6
157.0 97 . 0 15 .0
232.0 98.0
11562.6
1985
1,000 Acres
215.0
180 . 0
80.0
60.0
610. 0
562 . 0
13 . 0
11.0
157.0
147.0
95.0
91.0
14.0
! 2. 5
230.0
215 . 0
98.0
95 .0
11512.0 2
11373 . 5
219 . 0 77.0
640 .0 14. 5
155. 0 91. 0 14 .5
221.0 97. 0
11 5 31. 0
213.0 71.0
607.0 13.0
155.0 93.0 14.0
220.0 97. 0
1 , 483.0
GEORGIA PEACH CROP OFF 47 PERCENT
The July 1 Georgia peach production
e stimate, at 80 million pounds, is 47
percent less than the 1984 crop. This
year's freeze-reduced crop 1s smaller
than the 100 million pound 1983 freeze-
damaged crop, and the smallest production
since 1974.
However, the current
estimate is 7 percent above that of June
1. Harvest through July 7 was 74 percent
complete compared with 70 percent a year
ago.
SOUTHERN STATES PEACH CROP DOWN
Pe ach production in the nine Southern States is forecast a t 362 mill i on pounds, down 2 percent from the June 1 forecast a nd less than half of last year's crop. Conditions continued to deteriorate in Arkansas and South Carolina as t he extent of the freeze damage became more evident .
GEORGIA APPLE CROP DROPS
App le p r oduction is est i mate d a t 35
mi l li on p ound s, a 30 per cent dec l i ne from
last ye ar ' s r e c o rd cro p. Thi s ye ar ' s
fr eeze -d amaee d c rop i s I S mi l l ion po unds
be low the 1984 c rop bu t s t i ll h igher t han
the f r e e ze - reduced c ron s of 1982 and
1983.
No r th Ge o rgia - production i s
e stimate d at 21 million nou nds wi th the
r emain i n g 14 mil lion po~nd s fr om Sou t h
Geo r gia .
U.S. APP LE CROP OFF 3 PERCENT
Appl e produ c t i on for the Nation is f oreca st a t 8. 0 6 billion pounds , down 3 percent fr om last year and 4 percent from 1983.
PEACH PRODUCTION~SELECTED STATES, JULY 1
I
Total Product1 o n 17
State
I 1983
1984 Ind. 1985
Mill ion Pounds
Ala.
14.0
22.0
1.5
Ark.
21.0
23.0
5.0
Ga.
100.0
150.0
80.0
La. 2/
6.0
7.0
6.0
Miss. 2/
4.0
5.0
2.5
N.C.
12.0
43.0
4/
Okla. 2/
7.5
9.0
7.0
S.C.
95.0 480.0
230.0
Texas
27 . 0
23 . 0
30.0
9 Southern States
286.5
762.0
362.0
California Freestone Clingstone 3/
u.s.
Frt'!estone
435.0 683 . 0
1,172.3
445.0 1,042.0
1 '601.8
470.0 1,020.0
1,115.5
All Peaches
1/ I nclude s
1 1 855.3 2 643.8 2,135.5 unharvesteJ pr oduc tion and
harvested not so l d (mi l li on pounds) :
U. S., e x cluding Cal if . Clingstone
peaches, 1983-37 . 5; 1984-115.4.
2/ Es timate s f o r cu rren t year c arri ed
forward fr om ea rl ier for ecas t . 3 / Calif.
Clingstone i s over the s cale tonnaee and
includes c u lls and cannerv di ve rs ions
(mi l lion pounds) : 198 3-64 . 0; 1984-7 6.0.
4/ No s i gn i ficant c o mmercial p r odu cti on
due to f rost.
APPLES.
COMMERCIAL
1/,
?RODUCT IO N1
SF.LECTF.D
STATES AND UNITED PROD IJCT!Of':
STATES
TOTAL 2/
I~D.
STATE
I
1981
1984
1985
s---
Georgia
20 .0
50.0
35.0
New York
1,100.0
1,020.0
1,060.0
North Carolina
415 . 0
360. 0
330.0
South Carolina
i/LO
45.0
12.0
Tennessee
8. ')
11.0
7.0
Virginia
45 5. 0
465.0
350.0
Washington
3,055.0
2,950. 0
2,500.0
West Virginia
220 . 0
225.0
235.0
1983-1985
70 104
92 27 64 75 85 104
Other States 3/
3,081.5
3,159. 0
3,526.0
I 12
u.s.
8,373.0
8,2P.5. 0
8,055.0
97
1/ In orchards of 100 or more bea ring a ge trees. 27 Inc ludes unharvested proouction
and harvested not sold (million pounds): c n j ted States 1983-20.6, 1984-14.4.
3/ In c ludes AR, CA, CO, CT, DE, IA, ID, IL, IN, KS, KY, Mil, MD, ME, MI, MN, MO, Nil,
~J, NM, 011, OR, PA, RI, liT, VT, WI.
3
l!NITEn STATES ACREAGE ANn PRODUCTION~ 1984 AND 1985
Area RarveRted
Y1el per Acre
GFR-85-Vol. 14 Product1on
Indi-
Tndi-
----Indicate
cated
cated
Jul v 1,
Crop
Un i t
1984 1 ;ooo
Acre1s985
1q84 - - -1-9--8-5--
1984
1~85
-.;;: "Thousands- -
Winter Wheat
Bu.
51,513
48,668
40.0
38.1
2,060,646
1,854,254
Oats
Bu.
8, 123
8,800
58.1
56.7
471,921
498,953
Rve
Ru.
981
677
33.0
28.4
32,392
19,255
Bar lev
Bu.
11 ' 1 71
12,319
53 . 4
51.3
596,546
632,228
Tobacco, Flue-
cured,
Types 11 - !4
Lbs.
392.0 362.2 2, 206
2,138
864,625
774,250
Apples, Commercial Lbs.
-
-
-
-
8,285,500 8,055,000
Peaches
Lbs.
-
-
-
-
2,643,800 2,135,500
Corn for Gra i n
Bu.
71,816
74,756
106 . 6
1/
7,656,195
1/
Soybeans f or Bea ns Bu.
66, 09 J
62,293
28 . 2
1/
1,860, 783
1/
Peanuts
Lbs.
1 , 531.0
1, 483.0 2,878
1/
4,405,745
1/
So rghum Gr ai n
Bu.
15 ,3 48
16,136
56.4
1/
865,856
1/
Upland Cotton
Bales 10 ,299.5
1/
599
1/
12,851 .4
1/
All Hav
Tons 61 ,585
61,951
2.45
1/
150,781
1 I
I/ The t1rsc y1e1d ana proauc t1on fore c ast ~111 be released at ~00 P.M., Au gu~ .
UNITED STATES JIIGIILJGHTS
Corn pl ant ed f or all purposes is est1mated a t 83.2 mill i on a c. res, up 3 percent from last year. Growers expect to harvest 74.8 mil lion a cre s fo r gr ain i n 1985, up 4 percent from 1984. This is 90 percent o f the pl an t ed acres.
Sweet potato acreage i s set at 109 t housand acres, up 2 pe r cent fr om last yea r and 4 percent a bove 1983 plantings . Ar ea for harvest is es timated at 106 thousand a cres, a gain of 2 pe rcent from las t year and 3 perc e n t above 1983 .
All Tobacco a rea har vested is expected to total 705 tho usand acres , off 11 perc en t from 1984 and the lowes t si nce 188 1. Flue- Cured area for harves t, at a reco rd low of 362 thousand ac r es, is down 8 percent from t he previous record low of 392 thousand a cres harvested in 1984. Production o f flue-cured tobacco i s expected to total 774 mil lion pounds, 10 perc ent below last vear and 6 percent below 1983. This wo ~l d place flu e-cu r e d nroduction at the lowest l evel since i941.
Hal growers expect to harvest 62.0 lion acres of al l hay during 1985.
This is 1 percent more than t he 6 1 .6 million acres harve sted last year and 4 percent above the a c reage harvested in 1983.
Cotton a c reag e planted is expect ed to
total 10.8 mil lion a cres, down 3 percent f rom 1984 p lantings. Upland area is
est imated at 10. 7 mill i on ac r es and Ame ric an- Pima is estimated at 8 8.0 t hou sand ac r e s. By J une 2, about 88 pe rcent of t he in t ended acreaee was
p lanted and by June 23 planting was virtually c o mp let ed .
Oats production is forec a st at 499
miTTion bushe l s , up 6 perc e n t f rom l ast
year.
The inc rease in product ion
resulte d from a n 8 percent increase in
ha r vested a cres. The U.S . ave r age yie ld,
f o rec a st at ~6.7 bushels p e r ac r e, i s
d own from the 58. 1 bushe ls pe r acr e yi eld
l ast year.
Barley prod u ct i o n is fore c ast at a r e~ or d
high 532 mi llion b ushels, up 6 percent from t h e previous r ecord hiBh produc tion s et in 198 4. Ave rag e yie l d, at 5 1.3
bushels per acre, i s down 2 .1 bushels
from las t vea r. This is more than off s et by the 10 percent inc rease in harvest acres.
Wi nt er Whe at producti on , as o f .July J,
1985, i-s--forecast at 1. 85 billi on
bushel s . This is down 10 percent from last year's production o f 2.06 bil lion bushels. Yields are now ex pe~t e rl t o avera ge 38 . 1 bushels per acre , down 1 .0 hush t> i from the .Jun e I fo recast and off 1.9 bushel s f r om 1984 .
Rve produc t i on is forecast at 19.3 mTilion bushels, 41 percent less than th e 32.4 million bushels pr oduced i n 1984. Yields are expected to average 28. 4 bushels per a c re, 4. 6 bushel s less than last year. Area for grain har vest ~ s placed at 677 thousand a c r es, down 31 percent from 1984's level.
4
The Georg i a Farm Report (I SSN-Q744-7280) Is p ubl i shed sem i -mon thly by the Georg i a Cr op Report l ng Ser v ice, Step he ns Federal Bu l l dIng, Athens, Ga. 306 13, Lar r y E. Sn ipes, Stat istic ian- I n-Charge, Second C las s pos t ag e paid at Athens , Ga. Subscr i pt ion fee SID per yo except free tc da ta con tri butors. Subscripti on In formati on availab le f ran: Georgia Crop Reporting Service, Stephens Federal Buildi ng, Suite 320, Athens, GA . 30613 Telephone : (404) 546-2236.
UNITED STATES JUNE ACREAGE SUMMARY, SELECTED CROPS
Area Planted ror All Purposes
:
Area Harvested 1/
I~!--:----
Ind.
1985/
Crop
1984
1985
l~OOU-Acresu
---P1e9r8c4ent
:
1984r;ouo
1985
1984
A c r e s _ _ _ _ _ _ _ _P e r c e n t
All Corn
80,434
83,217
103.5
71,816
74,756
104.1
All Sorghum
17,249
17,800
103.2
15,348
16,136
105.1
Oats
12,364
13,140
10 6 . 3
8,123
8,800
108.3
.Winter Wheat
63,419
58,095
91.6
51,513
48,668
94.5
Rye Soybeans
2,971 67,735
2,558 63,320
86.1 93.5
981 66,093
677 62,293
-69.0 94.3
Peanuts
1,563
1,512
96.7
1,531
1,483
96.9
Upland Cotton 11,065
10,682
96.5
10,300
All Hay
-
Sweetpotatoes
106
-
-
61,585
61.951
100.6
109
102.8
104
106
101.9
Tobacco
-
-
-
793
705
88.9
l-~ested for princi pal use of each crop, i.e., gra in , beans , nuts, etc.
GEORGIA CORN STOCKS JUMP 34 PERCENT; SOYBEANS FALL 5 PERCENT
Corn stored in all posi tions on June 1, 1985, in Georgia total ed 12,675,000 bu shels, 34 perce nt more than the 9,473,000 bushels on hand J une I, 1984. Farm stocks of 8,885 , 000 bus hel s were up 61 percent from June 1, 1984. Off-fa rm stocks totaled 3,790,000 bus hel s , down 4 percent from June a year earlier .
Stocks of soybeans stored in a ll positions totaled 10 ,74 1 , 000 bus hels, 5 percent less than a year ago. Soybeans st ored off- f a rm a mounted to 7 ,141,000 bushels, down 28 percent f r om last year. On- farm stored soybea n ~ jumped 145 percen t to 3,600,000 bushels.
Stocks of wheat i n all positions at 1,442,000 bushel s, declined 14 percent from the 1,673,000 bushels stored a year earl i er. Wheat on-farm stocks at 779,000 bushels wer e up 5 percent, but off-farm stocks were down 26 percent at 663,000 bushels.
Stocks of oats at 456 ,000 bushels, were down 11 percent. Stock s of grain sorghum at 352,000 bushels were up 40 percent from a year earlier .
I.EORGII\ GRAI N STOCKS - - J UNE i , 1985 WITII COMPARISONS
On F"ar ms
---OTtF"arms 1/
Al l Posit ions
Grajn
198 4
1985
1984
198 5
198 4
1985
r;aTITI Bu shels - - -
Corn
5, 513
8,885
3,960
3,790
9,473
12,675
Oats, Old Crop
415
363
Rarley, Old Crop
-
-
*95
93 8
5*10
456 8
Wheat, Old Crop
774
779
Rye, Old Crop
103
229
Sorghum
251
332
899
66 3
*
12
*
20
1,6 73
* *
1 ,442 261
352
So~heans
1 ,470
3 600
q 880
7 , 141
11 ,3 50
10,741
*ot published to avoid discfosing indiviJual operations.
1/ Includes stocks at mi lls, e leva tors, warehouses, term in als and processors.
U.S. CORN, WHEAT i\ND SOYBEANS UP FR OM A YEAR EARLIER
Corn s lored in all positions on June 1, 1985 is estimated at 2 .83 b illi on bushels, 32 percent more t han the June 1, 198 4 level of 2 .1 5 bil lion bushels. Of t he tota l corn stocks on hand June l, 1985, 71 per cent or 2.00 billion bushels wa s stor e d on f a rms. Farm stocks were 65 percent higher than June I, 1984 farm s tocks. Off -farm s tocks, at 828 million bushels are down 11 percent from last June J.
Old c rop wh eat stored in all positions on
June I, 1985 totaled 1 . 42 billion
bushe ls, 2 per cent more than the 1.40
billion bushels on hand l a st June 1.
Farm
stocks
amo unted
to
582
million bushels, 2 percent less than on
June 1, 1984. Off-farm stocks , at 842
million bus he ls, are up 4 percent trom
June 1 a year ago.
5
U.S . GRAIN STOCKS CONTINUED
GFR-85-Vol. 14
Soybeans stored in all positions on June
1, 1985 totaled 609 mill1on bushe ls , up 29 per c ent from .June 1, 1984 but 21 perc ent hf"low .Tune 1, 1983. Farm stocks
on June 1, 1985 are estimated at 327
million bushels, 82 percent mo r e than on June 1 last year. Off-farm stocks, at
282 million bushels, are down 4 percent from a year ago .
Stocks of other ~rains were: Grain s o rghum 360 million bushels , down 2 percent; oats 180 million bushels, down 1 percent; and barley 248 million bushels up 31 percent.
Grain
tl.S. GRAIN STOCKS--JUNE 1~ 1985 WITH COMPARISONS
On Farms
Off Farms 1/
All Positions
1984
1985
1984
1985
1984
1985
Corn Oats, Old Crop
1,213.1 151.2
2,828.8 146.1
1,000,000 Bushels
932.0
827.7
29.8
33.4
2,145.1 181. 1
2,83 1. 8 179 . 5
Barley, Old Crop
117.0
163. 1
72.4
84.5
189 . 4
247.6
Wheat, Old Crop Rye , Old Crop 2/
591.7 6. 5
582.2 10.5
807.0 *
842.3 9.4
1. 398.6 *
1 , 424 . 5 19.9
Sorghum Soybeans
61.5 17q. 6
89.0 326.8
307.4 292 . 1
271.3 2 81.8
368.9 471.7
360.3 608.6
*Not published to avoid di sc losing indiv i dua l ope ra ti ons .
1/ In c lude s s tock s a t mi lls, elevator s , ware h ouses , t er min a l s and proc e s s o r s .
2/ Four State Total: Ga, Minn., N.D . ,S.D.
EORGIA ' S 1984 PF.CAN CROP RF.V ISED UPWARD
198 4 U. S . PECAN CRO P OFF 14 PE RCF.NT
!Geo rgia's 1 984 p ecan prod uc t ion a mo unted
to 12 0 million poun d s, 5 mi l li o n po u nd s
mo re t h an the Dec ember 1 , 1984 f ore c a st
and 2 0 mi 1 1 ion pounds abov e th e 1983
c rop. This es ti ma te i s ba s e d on e nd -of-
seas o n
report s f r om vir t ua lly
a ll
shellers, most buyers and a large sample
o f growers. The 1984 c rop t i ed th e 1981
crop as the fo u rth lar gest crop o f
record .
The 1984 produc tion was
surpassed by the 1963 crop of 124 million
pounds, the 1982 crop of 125 mill ion
pounds, and the 1978 record h i gh crop of
135 million pounds. Georgia produced 52
percent of the 1984 national output.
Quality of th e c rop was hurt by dry
weather
and
heavy
fall
insect
infestation. The average price received
by growers for Georgia's 1984 pecans
averaged 55.3 c ents per pound, down 7.6
cents per pound from 1983,
and
the lowest average price si11 c e 1975.
Value of the crop total e d $66.4 million,
up 6 percent from 1983.
The i 98 4 lJn j t ed State s pec an c r op to t a l e d 2 32. 4 mi l lio n pound s , 14 per c e n t le s s t han th ~ 198 3 ~ r o p of 270.0 milli on po u n ri s, but 6 p er c e n t mo re t han t he 1 9 82 c r op. I mproved va r ie ti e s a c count e d f o r 73 percent o f th e tota l c rop i n 1984 , r ompare d with 62 per cent of the total in 1983.
The average pr i c e r e ce ived by pecan
producers for the 1984 crop was 62.3
cents per pound, up 3.6 c ents pt!r pound
from the 1983 crop. Despite the higher
pri c e s , thP o verall value of the 1984
crop fell 9 percent to $ 145 mill ion
becmtse of the lower production. Pl ease
see pnge 7 of this publication f or
P.st i malf-'s
of
ind i vi<iual
Stale's
produc tion, average pr i c e , and va lue of
produc tion.
6
PECANS, UTILIZED PRODUCTION, PRICE AND VALUE, SELECTED STATES & IJNITE D STATES, 1982-84
Variety
Utilized Produc tion I I
and
State
1982
1983
1984
1,000 Pounds
IMPROVED VARIETIES 2/
Ala.
14,000
17,000
9,000
Ark.
600
1 , 750
1. 100
Fla.
2,000
1,500
2,200
Ga.
105,000
85,000 100 ,000
La .
2,500
3,000
1 ,500
Miss.
3,000
5,500
4,000
N. Mex. 25,000
29,000
24,000
N.C.
900
500
1 ,830
Okla.
800
1,000
2,000
S.C.
1,200
1, 000
3,600
Tex.
14,000
22,000
20,000
u.s.
169,000
167,250 169,230
Price Per Pound
1982
1983 Cent s
1984
71.3 108.0
61.0 66.5 70.0
87 .o
83.0 65.0 137.0 79 . 5 95 .4
52.0 85.0 70.3 66 .0 65.0 65.0 73.0 75.0 86.0 84.6 77 . 0
68.0 81.0 65.5 58.0 75.0 72.0 83.0 70.0 91.0 63.0 98.3
72.6
67.7
68.2
Value of Utilized Prod.
1982
1983
1984
1,000 Dollars
9,982 648
1. 220 69,825
1. 750 2, 610 20,750
585 1,096
954 13 ,356
8,840 1,488 1 ,055 56. 100 1, 950 3,575 21. 170
375 860 846 16,940
6,120 891
1. 441 58,000
1,125 2,880 19,920 1,281 1 ,820 2,268 19 ,660
122,776
113,199 115,406
NATIVE AND SEEDLING
Ala.
9 , 000
Ar k.
400
F'la .
2,500
Ga.
20,000
La.
7,500
Miss.
1,000
N.C.
1,000
Okla .
4,200
S.C.
1,000
Tex.
3, 000
7,000 750
1,900 15,000 19,000
2,500 1,100 7,000
500 48,000
u.s.
49,600
102,750
4 ,000 400
2,800 20 ,000
3, 500 1. 500 1 ,070 23,000 1, 900 5,000
63,170
49.1 46.0 51.0 49.0 46.0 42.0 50.0 57.0 60.2 55.7
49.8
38.0 50.0 46.5 45.0 39.0
41 .o
50.0 43.0 50.7 46.4
44.0
48.0 49.0 45 . 0 42.0 45 . 0 45.0 50.0 50.0 47.0 49.4
46.6
4,419 18 4
1. 275 9,800 3,4 50
42 9 500 2,394 602 1. 671
24,715
2,660 375 884
6,750 7,410 1 ,025
550 3,010
254 22,272
45,190
1,920 196
1,260 8,400 1. 575
675 535 11,500 893 2,470
29,4 24
ALL PECAN S
Ala.
23,000
Ark.
1,000
F'la.
'. 500
Ga .
125,000
I.a .
10,000
Miss.
4,000
N. Mex. 25,000
N.C.
1, 900
Okla.
5,000
S.C.
2 ,200
Tex.
17,000
24,000 2. 500 3,400
100 ,000 22,000 8,000 29,000 1,600 8,000 1. 500 70,000
13,000 1. 500 5 ,000
120,000 5,000 5, 500
24,000 2,900
25 ,000 5,500
25 ,000
62.6 83.2 55 .4 6 3.7 52.0 75.8 83.0 57. 1 69.0 70.7 88.4
47.9 74.5 57.0 62.9 42.5 57.5 73.0 57.8 48.4 73.3 56.0
62.0 72. 0 54 .0 55.3 54.0 64.6 83.0 63 . 0 53. 3 57.0 88.5
u.s.
218,600
270,000 2 32 ,400
67.5
58.7
62.3
1/ In-shell basis. 2/ Budded, grafted, or topworked varieties.
14,401 832
2,495 79 ,625
5,200 3,030 20,750 1 . 085 3,490 1,556 15,027
147,491
11.500 I ,863 1,939
62,850 9,360 4 ,600
21 ,170 925
3, 870 1. 100 39,212
158,389
8,040 1. 087 2,701 66,400 2,700 3,555 19,920 1,816 13 ,320 3,16 1 22,130
144,830
7
d -1 0 ::I:c-1
me
2~
VIm
:z.
-1
(/)
(/)
m n
-1
r
H CXl :::0 )> UJ;JO O-< 0.. 0 N
c: z......
0
~
N
<: (..
0 .0....
"11 ....
m'G'l w
0 0
;<;I 0
G'l 0
H IO
];;> 0
\.11
I
N
.V..1.,
ON
oo
\ll
\.11
N 0
)~.....>c,:... V~...>V>~~
~
-"'
"~"~" ~~~
~
)f~0"C'J.!:
o-a .. 00
~.~....
<"t;) 0
~- a0 "t;)
,.
~
::
(JQ
...... a0_-.
nti:l
<!"
"""
:1-"d tll _,Ot'l
:CCI>()
t'l_,O
Bi~~
1'1 I
~
...,
;n:()
o.....u":'
..ao.....,.->.,
WHAT'S THE FARM SLICE?
c=== ===:t\::::fi:=i::::::m:;:::::ttPtm)::::i:ill~
I n 1984 , farmers got only 27 cents out of
the average dollar that consumers spent
on food.
This dollar includes food
consumed away from home, nonfarm produced
foods, and imported foods.
Labor continues to take the lion's share of the food dollar, accounting for 32 cents in 1984.
Where does the consumer's "at-home" food dollar go? When he/she eats at home, the average American uses over one-third of the food dollar for meat and poultry items. This group includes eggs, nuts, and peanut butter, too.
8
crn
A'wll.c
~EORGIA
~FARM REPORT
.July ~
GFR-85-Volume 15
ed '~-'"'-""'v- f
JUL 2 885
uuL u
( ft: " r '
i' ~
GEORGIA
~ CROP REPORTING SERVICE
stephens Federal Bldg. Suite 320
Athens, Georgia 30613
Phone: ( 404) 546-2236
HIGHLIGHTS :
Cattle Inventory Livestock Slaughter Poultry Summary rarm Production Expenditur es Cold Storage
Peanut Stocks
~ink
Milk Production Cattle on Feed Vegetabl es
ll. S. ALL CATTLE A:-ID CALVES INVE:-ITORY DOWN 4 PERCE:-IT
Total cattle inventor y in the United States o n July 1, 1985 , is placed at 116 million head, d o wn 4 p erc e n t f r o m .lu ly i a year aP. o a nd 6 per ce nt below July 1, 1983. This is the l owes t July 1 all cattle inve ntory since mid-year estimates began in 1973. The cu rrent estimate is the f ourth consecu tive year o f inventory decline after only two years of e xpan sion.
Cows and heife rs that have ca lved, at 46 . ) mi l li on, are down 5 percent from July 1 , 1984 and down 7 perc ent f rom July 1 , 1983. Bee f cows were 7 percent below the previous year, wh ile th f! milk .::ow herd w;;s tlp 2 ?P. r r.e nt .
The 1985 c al f c rop i s expected to tot al 41.1 milli on head, down 3 percent from 1984. This would l>e the smallest calf c rop since 1961. Calves hor n during January through June ar e estimated at 29.4 mill ion, 71. 5 pe rcent of the expected full year calf cro p.
l.ATTLE AND CALVES : XCMBER BY CLASS A~D CALF CROP, UNITED STATES
JCLY 1, 1983-19 8 5
i985 a s Y.
Class
1983
1984
1985
of 198.:.
Cattle & Calves Cows & Deiters that have Calved
123,)40 49,600
1,000 Hearl 121,500 48,700
116,300 4 6,3 00
Perc ent 96 95
Beef Cows
38,500
37,900
35,250
93
~ilk Cows
: 1 ,1 00
10,800
11, 0 50
!02
Heife rs 500 Pounds & Over
18,570
18,500
18,200
98
For Beef Cow Rep lacement
5,800
3 ,5 00
4,900
89
For Mi lk Cow Rep lacement
4,880
4 ,95 0
5,000
101
Other llej f ers
7, 890
1\,050
8,300
10 3
Steers 500 Pounds 6. Over
16,8 40
16,400
15,900
97
Bulls 500 Pounds & Over
2,560
::.,sno
2 ,300
92
Calves Under 500 Pounds
35,97 0
35,400
33,600
95
Calf Cron i/
43 925
42 499
41 100
97
1/ For t he current year, the calf crop is the number of calves born before July 1 plus
the number expected to be born on and after July 1 .
Agrlcu1t:ural St:at:ist:icl.an aad Georgia Depart:.ent: of Agricu1t:ure
GEORGIA RED MEAT PROD~CTION DO~
GFR-85-Vol. 15 UNITED STATES RED MEAT PROD UCTION
Georgia red meat production totaled 30.6 million pounds during June 1985 , down 18 percent from Mav 1985 a nd 8 percent from J une 1984.
The January-June red meat prod;Jction totaled 202.6 mill i on pounds, 12 percent less than the same period last year.
The number of cattle slaughtered in Georgia during June was 19,600 head, a decrease of 600 head from last year. Calves slaughtered totaled 1,200 head, up 300 head from June the previous year.
There were 128,900 hogs slaughtered in Georgia during June, 20,800 head less than June 1984.
Commercial red meat production for the
United States i n June 1985, totaled 3.08
billion pounds, down 4 percent from June
1984. January-June red meat production
a t 19.4 billion pounds, fractionally from last yea~
was up
Beef production, at 1.89 billion pounds, was down 5 percent from June 1984. Head kill was 2.88 million, down 10 percen~ from the same month a year earlier. The average live weight was 1,103 pounds an increase of 44 pounds from June 1984.
Pork production, totaled 1.13 billion pounds, down 3 percent from June 1984. The 6.39 million head killed was down 3 percent while the average live weight was 247 pounds, the same as last year.
Species
Georgia Cattle Calves Hogs Sheep & Lambs
GEORGIA AND UNITED STATES LIVESTOCK SLAUGHTER 1/
Number Slaughtered
Average
1985
Jan.-June
Live Wt>ight
June
as 7. of '85 as 7. of
June
19114
1985 19114
1984
1984 1985
1,000 Head
Percent Percent
Pounds
20.2
19.6
97
103
878
906
.9
1.2
133
125
318
335
149.7 128.9
86
82
227
230
.l
1
100
75
108
95
Total
Live Weight
June
1984
1985
1,000 Pounds
17,767 2,537
33,917
9
17,763 3,343
29,647 6
United States
Cattle
3,187.4 2,878.5
90
97
1 , 059 1,103 3,376,259 3,175,729
Calves
242.0 235.4
97
102
264
267
63,837
62,748
Hogs
6,595.3 6,394.4
97
98
247
247 1,628,171 1,582,279
Sheep & Lambs 516.4 437.8
85
91
107
113
55,400
49,410
1/ Includes slaughter under Federal Inspection and othP.r commercial slaughter, excludes
farm slaughter.
.. - C:O~ERC I."ll. ;u:n ~E.'\T _!\;>;D !.ARO PRO OIJCTT ON : t;NITF.D STATES WITH COMPARISONS 1/
Jun.:
1985 as 7.
Jan.-June 2/.
1985 as 7.
Kind
1984
1985
of 1984
1984
1985
of 1984
!'!illion Pounds
Percent
Million Pounds
Percent
Beef
1, 984
1,894
95
11,5 28
11, 608
101
Ve a l
38
37
97
228
238
104
Pork
1 . 15 6
1. i 2 5
97
7,408
7,359
99
Lamb .S. Mutton
27
24
89
191
176
92
Total Red Meat
3,205
1,080
q6
19,355
19,381
100
Lard 1/
71
70
96
467
463
99
1/ Based on parkers rirPss wei~hLs Anri PXcludes fn rm slaughtPr. 2/ Acrum u la c eri totnls
based on unrouncied data. 3/ Prelimina ry lard production includes render ed pork fat.
2
GEORGIA LAYER AND EGG PROD UCTION DOW~
Georgia's . laying flocks produced 320
million eggs during June 1985, 7 percent
less than .June 1984.
Production
consisted of 220 million table ot
c ommercial type eggs and iOO mil1 ion
hatching eggs.
The average number of layers in Georgia during June 1985 was 16.3 million, 11 percent less than June 1984. The 16.3 million consisted of about 11.1 million for table eggs and 5.2 million layers for hatching eggs.
Eggs laid per 100 layers during June 198 5 averaged 1,965 compared with 1,887 for June 1984.
UNITED STATES EGG PRODUCTION DOW~
The :-Jation's laying flocks produced 5.48
billion eggs during June 1985, down I
percent f rom the 5.5 2 billion produced a
year ago.
Production included 4 .8 7
billion table or c ommercial type eggs and
610 million hatching eggs. The total
number of layers during .Ju r u~ averap,ed
269.5 million, 2 percent less than the
276.2 mil lion a year ago. June egg
production per 100 layers for the tot~l
laying floc k was 2, 0 34 eggs compared wi th
1,999 eggs for June 1984.
All layers on July 1 , 1985 totaled 269.8
million, down 2 percent from the 276 . 5
million a year earlier.
The 269.R
million layers consisted of 237.7 million
for tahle or commercial type eggs and
32.1 million for ha t c hing eggs. Rate of
lay on July I, 1985, for all 1ayers
averaged 67.5 eggs per 100 l a yers,
compared with 67.0 on July I, 1984.
Georgia Hatching Other
Total Georgia Total U.S.
~U~BER OF LAYERS AND EGG PRODUCTION, J UNE 1985
No. Layers on
Eggs per 100
Total Eggs Produced
H a n d - .J u n e
La yers-June
During June
1 9 8.:.
1985
198 4
1985
198 4
1985
Tho usands
~umber
~ill ions
5,212 13 ,0 i4 18 , 226 276,214
5,242 11,042 16 , 284 269 ,487
1,893 1, 884 1 ,887 1 ,999
1, 914 1,989 1,965 2,034
99 245 344 5,522
100 220 320 5,481
I tem
Chickens Egg Type Broiler Type
T urkey~-----
EGGS IN I~CUBATORS, JULY 1985, C~ITEO STATF.S
1984
1985
--Thousands--
35, 337 325,788
24 , 246
28,366 337,306
25 , 007
7. of Year Ago
80 10 4 :0 3
The Geo r gi a Far m Report (ISSN - 0 74 4-72 80) Is pub l i shed semi -mon thl y by the Georg ia Cr op Repor ti ng 5 erv lc e, St ephens Fede ra l Bul I ding , Athens , Ga . 30613, Larry E. Sni pe s , Sta ti stician In Charge . ! s econd cl as s pos t age paid a t At ne ns , GA, Subscr iption tee $10 per year except tree t o da ta co nt r ibuto r s , Su bscript i on ln t ormat lon avai l ab le f r om : Georgia Crop Reportin g Service , Stephens Federal Bu ll d l~ Suite 3 20 , AThen s , GA, 306 13 Telephone: (404) 546-2236,
3
GEORG IA BROILER IIATCII t;p
GFR-85-Vol. 15 UNITED STATES BROILER HATCH CP
The June 1985 hatch of broiler type
chicks at 61.1 million was 7 percent above the 57.3 million a vear earlier. The January through June 1~85 hat ch was 357.4 mi lli on, 6 percent more than the
same peri od last vear. There were 49.2 million broiler type eggs in Georgia's incubators on July 1, 1985, up 6 percent from a year ago.
The June 1985 hatch of broiler type chicks, at 4 11 million was up 3 percent from a year ago. The January through June hatc h wa s 5 per c ent more than the same oeriod last vear. There were 337.3 mil lion eggs in incubators on Julv 1, 1985, up 4 percent from a year ago. '
POULTRY HATCHING A~D PLACEMF.NT--JUNE 1985
/. of
/. of
Item
June
May
J une year
Jan. thru June
year
1984
1985
1985 ago
1984
1985
ago
--Thousands--
--Thousands--
Pullet Chicks Placed
Domestic (tj.S.) l/
Broiler Type
3, 399
3,672
3, 162
93
20,561
20,809
101
Egg Type
424
253
223
53
1,884
1,484
79
Chicks Hatched
Broiler Type
Georgia
57,266
63,006
61,105 107
337,637
357,443
106
United States
396,961 423,951
410,745 103 2,325,256 2,430,922
105
Egg Type
Georgia
4,378
2,966
2,263
52
26. 148
14,822
57
L'nited States
46,545
39, 0 66
33,966 73
263,557
207,807
79
Turkevs
Poults Placed
u.s.
20,388
2I,8_2J _____10~J01
99 .. 2/149,282 2/156,355
105.
1/ Reported by leading breeders, includes expected pullet replacements from eggs
sold during the preceding month at the rate of 125 pullet chicks per 30 dozen case
of eggs. 2/Turkey poults placed Sept . 1984-June 1985 .
COMMERC IA L POULTRY SLAUGHTER 1/a JUNE 1985
/. of
/. of
Item
June
June
June
year
Jan. thru June
y ear
i984
1985
1985
ago
1984
198 5
ago
-Thousands- - -
- - -Thousands -
Young Chickens
Georgia
44. 169
56, .. 42
55,198
125
259,883
310, 509 119
United States
367,532
393,813
370,088
101 2,113,458 2,207,245 104
~ature Chickens
Light Type U.S.
Heavy Type t.:.s.
13,932 3,391
12,236 3,253
8,930
64
71,110
2,821
83
17,483
81 '196 114 18,494 106
Total U.S.
17,323
15 ,489
11 '7 51
68
88,593
99,690 113
Total All Types, Ga . 3,359
3,064
2,2 34
67
18,310
19' 194 105
Percent Condemned
Young Chickens
Georgia
1.3
2/1.5
2/1.4
3/~A
United States
1.4
1.5
2/l. 5
2/1 . 7
1/ Federally inspected slaughter data a s collected by ~eat and Poultry I nspection
Program . Current month data es tima ted by Market News Service. 2/ January-May
condemnations. 3/ Not available.
4
FARM PRODUCTION EXPENDITL~ES HIGHER FOR
THE SOUTHEAST REGION
ran. Sarvtc
I
Farm production expenditures totaled $7.5
billion for the Southeast region in 1984,
7.0 percent above the $7.0 billion of
1983.
In
com parison,
the U.S.
expenditure decreased 2.3 percent from
1983 to $128.3 billion . The Southeast
accounted for 5.9 percent of total U.S.
expenditures. Increases in expenditures for livestock and poultry, farm services
Aucoa . Tnu:ka. tracton, &. _
Kacbl.lluy
and feed were the maier contributors to the i ncrease. Parti~lly offsetting were declines of 18 percent fo r wages and
lu.ildio&'-1 2.11 Fanein&
Fa r- 6 Hl>t.or
sup"u... -
~
--1
-v ~
contract labor and 11 percent for
interest. The average expenditure per
farm in the Southeast was more than 20
percent below the National average at
$43,582 but $4,666 more than a year
earlier for this reg i on. The
average
expenses per farm for feed, wap,es and
contract labor, fertilizer, lime and so i l
Saa48. Pla.au. /
conditioners, seeds and plants and
fartilbal'., 6 Chealc.a t. '
agricultural chemic als exceeded the U.S .
averages. The four major groups of feed,
farm services, livestock and poul t ry and
wages and contract labor accounted for half of all expenses. Feed was the single
largest expense for farmers in the Southeast acc ounting for neary 19 percent of the
total. Farm services contr ibu ted 12 percent and livestock and poultry and wages and
contract labor each contributed 11 percent of the total. Nearly a fifth of the farms
reported s ales greater tha n $100,000 and accounted for three- fourths of the regional
expenses. One-fifth of the far ms had sales of $20,000-$100,000 a n d accounted for 14
percent of the expenses. The remaining 61 percent of the farms wit h sales of less
than $20,000 account e d for 11 percent of the expenditures.
tmiTED STATES TOTAL EXPENDITURES FOR SELECTED ITEMS BY
1/ EXPENDITURES 1984
Selec ted Items
Total Fa rm Produ c tion Expenditures, U. S.
Total Farm Production Expenditures S.E . Region 2 /
Livestock, Poultry & Other Related Expenditures
Farm Serv i c es Feed Wages & Contract Labor Interest Fertilizer, Lime & Soil
Cond itioners Fuels & Energy Farm & Mot o r Suppl ies Building, Fencing & Farm
Improvements Tractors & Self-Propelled
Machinerv Other Farm Ma c hiner y &
Implements Seeds & Plants Purchased Taxes Autos, Trucks & Other Moto r
Vehicles A2ricultural Chemi ca ls
ncludes AL,FL,GA, A
I Under
$20.000
to $100,000
I $100, 000+ ars
12,505 , 707
29,779,896
86, 062 , 54 7
798,580
1,091,807
5 ,649,337
69,901 99,6 4 5 71,940
36,072 68,975
69,164 18 7 ,271
73' 101 80,143 125,873
718, 493 595,9 30 1,249,024
701,828 357,772
89,815 76,252 37,674
144,613 112 , 943
45 ,940
499,198 342,986 277,464
54,41 7
67,234
88,337
26,944
16,354
154,736
17,385 78,256 29,573
22,396 35,866 18,068
50, 621 232,932
60,195
41,084
56,130
51,549
263.031
may not add cue to rounding.
5
I All Farms
128,348,151
7,539,72 4
857,558 882,847 1 ,394,065 818,0 4 3 552,620
733,626 532,181 361,078
209 ,988
198,03 4
90,402 347,055 107,836
124,31 4 328.744
~ OLD
Commoditv
Butter Cheese, Natural Er.gs, Fro?.en F'ru its , Ftozen Fruit Ju i ces, Frozen Meats, Red
Beef, Frozen Pork, Frozen Poultry, Frozen Turkeys, Frozen Vegetables, Frozen Potatoes, Frozen Peanuts , Shelled Peanuts, In She l l Pecans , Shel l ed Pecans, In She ll
STORAGE STOCKS, June 30, 1984
516,713 1,193,159
16,365 451, 472 : ,303,859 776,349 303,150 405,213 352,220 226.296 1 ,081,'174 840,438 108, 063
17 . 182 35,60 7 75,795
UNITED STATES, May 31, 198">
1,000 Pounds 283,191 911,008 15,119 442,203
1,632,201 784,917 300,938 410,289 349,122 181,741
1,188,015 1,081,589
4 ">6,514 50 ,116 29,156 . 54, 109
JUNE 30, 198~ June 30, 1985
277,383 944,219
15 ,5 53 528,635 1,427,304 748,351 288,420 382,832 419,441 241,799 1,263,709 1,057,990 449,714
45,159 29,095 45 78 2
GF'R-85-Vol. 15
Percent of
.June 1984 . ~av 1985
Percent
54
98
79
10 4
9">
101
117
120
109
87
96
95
95
96
94
93
119
120
107
13 3
117
10 6
126
98
146
99
2 63
90
82
100
- -1',()
85
JUNE PEANUT STOCKS
Peanut stocks in commercial storage on
June 30, 1985, totaled 1.68 bill i on
pounds of equivalent farmer stock. This
total includes 358 million pounds of
actual farmer stock. Shelled peanuts on
hand total e d 1.24 billion pounds of
equivalent farmer stock. Roasting stock
totaled 83.9 million pounds. There were
no
Commodity
Credit
Corporation
uncommitted stock on hand as of June 30,
1985. Shelled peanut stocks on June 30,
1985, totaled 934 million pou nds of wh ic h
923 million pounds were edible grades and
11.4 mill i on pounds were oil stocks.
Edible grade stocks by type are
Virginias, 181 million pounds; runners,
666 million pounds; and spanish, 75.8
million pounds.
U.S. VISIBLE SUPPLE OF PEA~UTS
AT MONTH'S END 1/
.Tulv I Jan. j June
Class
1984 J 1985 1 198 5 2/
!oiillion Pounds
Farmer Stock
9
1,892
358
Shelled
Peanuts 3/
436
743
934
Roasting
Stoc k
23
92
84
Tota l 4/
611
2 972
1 68 4
l / Fxc lude s sto c ks on f arms. !nc lurle s
stock s owned by or held for ac c ount o f
CCC i n c omme r c ial storages. Farmer s t ock
on net weight ba sis. 2/ Preliminary. 3/
Inc l udes shel l ed e dible and shelled o i l
stock. 4/ Actual farmer stoc k, plus
roasti ng stock, plus shelled peanuts X
1.33.
MINK PELT PRODUCTION UP
Mink pelt production in the United States in 1984 totaled 4.22 million pelts, up 2 percent from 1983. Wisconsin, the major mink State, produced 1.19 million pelts. Mink pelts sold during the 1984 crop year were valued at 119.0 million dollars, down 4 percent from 1983. The average price per pelt for the 1984 crop year was $28.20, compared wi t h an average price of $29.90 in 1983 and $28.90 in 1982. Female mink bred to produce kits in 1985, in
th~ u.s., totaled 1.12 million, unchanged from 1984. Females bred to produce kits in
1985, in Georgia, amounted to 11,000 compared to 11,200 bred for 1984 production. There were 1,069 mink farms producing pelts in 1984 compared with 1,098 the previous year. Leading States were Wisconsin with 241 farms, Utah with 159 and Minnesota with 156 farms. F'ox were raised on 14 percent of the mink farms, the same as a year ago.
6
GEORGIA MILK PRODUCTION UP 6 PERCENT
U.S. MILK PRODUCTION UP 6 PERCENT
Milk production during June in totaled 102 million pounds, 10 less than the previous month percent more than last year.
Georgia percent b.ut 6
The number of milk cows on Georgia farms averaged 116,000 head during June, the same as last month, but 3 percent below June 1984.
Production per cow averaged 880 pounds during June, 70 pounds more than June 1984.
Milk production during June 1985 totaled
12.4 billion pounds, 6 percent above June
1984 and the highest June production
since 1947.
The current month's
production is 4 percent below the June
record established in 1945.
Production per cow averaged 1,128 pounds during June, 43 pounds above the June 1984 average.
The total number of milk cows averaged 11.0 million head during June, 41 thousand more than during May.
~ILK COWS AND MILK PRODUCTION, JUNE 1984-1985
Georgia
United States
I~em
Unit
!984
1985
Percent
1984
1985
Percent
Milk Cows 1/
Thous. Head
119
116
97
10,801 11.02 5
102
Milk per Cow 2/
Pounds
810
880
109
1,085
1,128
!04
Milk Production 2/ Mil. Lbs.
96
102
106
11,720 12,434
106
1/ Includes dry cows, excl udes heifers not yet fresh. 2/ Excludes milk sucked by
calves.
CATTLE ON FEED DOWN LESS THAN 1 PERCENT IN 13 QUARTERLY STATES
Cattle and calves on feed July 1, 1985 for slaughter market in the 13 quarterly states totaled 8.66 million head, down fractionally from .July 1 last year. Placements during the April-June quarter totaled 5.19 million, 7 percent below last year. Other disappearance of 439 thousand head leaves net placement at 4.75 million. Marketings of fed cattle for slaughter during April-June totaled 5.76 million, up 3 percent from the same quarter last year.
CATTLE ON FEED: NUMBER 1 PLACEMF.NTS 1 MARKETED AND OTHER DISAPPF.ARANCE 1 APRIL 1 TO .JULY
Total 13 States
Total 7 States
Number
1985 as i.
Number
1985 as i.
Item
1984
1985
of 1984
1984
1985
of 1984
1,000 Head
Percent
1 ,000 Head
Percent
On Feed Apr. 1
9,3 40
9,676
104
7,568
7,814
103
Placed on Feed Apr. 1-
June 30 1/
5,562
5,186
93
4,758
4,350
91
Fed Cattle Marketed
Apr. !-June 30 1/
5,620
5,763
103
4,704
4,764
101
Other Disappearance
Apr. !-June 30 2/
582
439
75
497
348
70
On Feed July 1
8,700
8,660
!00
7. 12 5
7,052
99
Marketings July-Sept. 3/5,68-' 4/5,978
105
3/4,725 !./ 5,000
i06
1/ Includes cattle placed on feed after beginning of quarter and marketed before end of
quarter. 2/ Includes death losses, movement from feedlots to pastures and shipments to
other feedlots for further feeding. 3/ Total marketings including those placed on feed
af ter July 1 and marketed before Sept. ]0. 4/ Expected total marketings including an
allowance for those placed on feed after July 1 and marketed before Sept. 30 .
7
l--U (;;. .....,
-i O 2 ~
...I. c 1 1'-'1 N
< l""rtC:
, L..$. a
Vl
no
mr-
f-1
CD
;0 l> v.J:;IJ
o -<
(J'
0
rn 'Gl '..AI
l:l 0 ;JO 0
"1 0 H IO :P
..,IJ
U't
I N
U't -..j
ON 00
-.D
U't Co N
co
0 Ol
~:~::~T~~o;'~Ic~I
~Q0
Oil
-"'"~"'aI:I f:ODI-
.oQ0a
~ <!"t:l 0
I~I l-ila0 ."t:l
~ ~
.....
0
aOi:l
"'~ '!Cl
'-'
>"dUl
~Ot<l
O:Ul()
C'l~O
~~~
t<l I
(")
s;: ~ .r;:
HUl
ow
I:='Ul
>
"....'~
w
JA~ U ARY-JU~E
FRESH
MARKET
PR O DCCTIO~ DO W~ 3 PERCE~T
VEGETABLE
The 1985 Januarv-June production o f 7
fres h market vegetables i n the major
producing States is estimated at 68.8
mil lion cwt . c ompar ed with 71.1 mil lion
cwt . produced in the same period of 1984.
Harvested acres for the 7 c r ops is
estimated at 329 thousand acres, 1
percent less than the January-June period
last vear. Januarv-June production was
below" last year fo r broccoli, carrots,
celery,
and
lettuce .
Production
increased fo r cauliflower, sweet corn,
and tomatoes.
VEGETABLES, PROSPECTIVE AREA FOR HARVEST
st:~ER QUARTER 1 , u~ITED STATES
Area
For
Cro p
Harvest
1983
1984
1985
Acres
Winter
156,500 165,600 159,500
Spring
164,900 171,300 174 ,0 20
Summer
Broccoli 2. / 19,200
17 ,900
18,500
C<trrots 2/
23,800
27,000
27,800
Cauli-
f lower 2/
13,900
14,300
13,700
Celery 2/
8,030
8,450
6,830
Sweet Corn 109,500 1 i 1 '900 113.300
Lettuce 3/
47,200
49,300
49,800
Tomatoes
50,800
50,000
49,100
Total 7 Ve~t ab_!es 272,430 278,850 279,030
1/ July, Aug., and Sept. 2/ Includes total for fresh market & processing uses.
FRESH MARKET VEGETABLE ACRES UP 1 PERCE~T
Prospective acreage of 7 fresh market vegetables f or harvest during the summer quarter (July, August and September 1985) in the major producing States is estimated at 279 thousand acres, 1 percent above a year ago. Cauliflower, c elery, a nd tomato acreage decreased while the other crop acreages increased. The vegetables included <tre broccoli, carrots, cauliflower, celery, sweet corn, lettuce, and tomatoes.
8
n4rc. cr1
I )RGIA FARM REPORT
August ' l4, 1985 GFR-85-Volume 16
c -
~1985
LJUWMt!~lS
- lU~R~RIES
GEORGIA
~ CROP REPORTING SERVICE
Stephens Federal Bldg. Suite 320 Athens, Georgia 30613 Phone: ( 404) 546-2236
HIGHLIGHTS: August 1 Crop Forecast A~ricultural Pr i ces
Farm Numbers & Land In Farms
Financial Summary, U.S. Farms Vegetables
FAVORABLE YIELD PROSPECTS
Early spring planting was off to a rapid start this year. Variable soil moisture supplies caused some concern during the early phase of the planting season. The prospects for good yields are attributed to the high moisture and moderate temperatures during July.
CORN EXPECTED TO YIELD 80 BUSHELS PER ACRE
Georgia's 1985 corn yield are forecast at 80 bushels per acre, the third highest of record for the State . The combination of dry soils and high temperatures in June caused extremely varied yields. Irrigated field are expected to offset some of the low yields. Growers expect to harvest 1,000,000 acres for grain, up 2 percent from the previous year.
(Continued on Page 2)
GEORGIA ACREAGE AND PRODUCTION. 1984 AND 1985
Acreage
Yield per Acre
Production
Indi-
Indi-
Crop
Unit
Har-
For
cated
cated
vested
Harvest
Aug. 1 ,
Aug. 1
1984 1/ 1985 1/
1984
1985
1984
1985
--Thousand Acres--
-- Thousands--
Corn
Bu.
985
1 ,000
82.0
80.0
80,770
80,000
Sorghum
Bu.
113
140
42.0
43.0
4,746
6,020
Cotton 2/
Bales
172
243
784
725
281
370
Hay, All
Tons
550
520
2.40
2.30
I ,320
1,196
Soybeans
Bu.
2,000
1,750
20.0
24.0
40,000
42,000
Peanuts
Lbs.
640
607
3,375
3,300 2,160,000 2,003,100
Sweetpotatoes
Cwt.
6.4
6.3
140
130
896
819
Tobacco, Type 14 Lbs.
38
37
2,250
2,250
85,500
83,250
Apples, All
Commercial 3/
Lbs.
50,000
35,000
Peaches 3/
Lbs.
150,000
80,000
Grapes
Tons
2.7
2.9
Wheat 3/
Bu.
890
825
35.0
30.0
31,150
24,750
Oats 3/
Bu.
60
50
55.0
40.0
3,300
2,000
Rve 3/
Bu.
80
100
22.0
21.0
1, 760
_____L 100
1/ Harvested for principal use. 2/ Cotton yield in pounds and production in bales.
3/ Estimates brought forward fro earlier forecast.
Api.cu.l.taral St:atutlciaa aad Georsf.a Departllellt of Agrlcu.l.t:ure
(Continued from Page 1)
PEANUT PRODUCTION SECOND HIGHEST OF RECORD
Ge orgia, the Nation's leading peanut, Sta te i s expected to produce 2.00 billion pounds, a decrease of 7 percent from last year's crop and the second highest of record. The season's first yield esti.ate is 3,300 pounds per acre, which is 75 pounds per acre less than the record high yield of 1984. An estimated 607,000 acres are expected to be harvested this year, 5 percent below the previous year.
GEORGIA SOYBEAN CROP UP 5 PERCENT
Georgia's soybean crop is e xpected to total 42.0 million bushels, an increase of 5 percent from last year's crop. This increase is the result of an increase in yield from 20 bushels per acre l ast yea r to the estimated 24 bushels per acre thi s year. An estimated 1,750,000 acres are expected to be harvested in 1985, a 12 percent decline f r om last year's harvested acres; and the s~llest acreag e since 1978.
GRAIN SORGHUM TO SET RECORD PRODUCTION
Both acres f or harvest and production fo r s orghum grai n are at record levels. Grai n sorghum in 1985 is expected t o produce 6.02 million bushels from 140,000 harvested acres. Yield is forecast at a record-tying 43 bushels per acre , equal to the 1976 yield.
GFR- 85-Vol. 16
TOBACCO CROP DECLINES 3 PERCENT
Geor gia's August 1 tobacco produc tion
forecast, a t 83.25 mi l lion pounds,
r emai n s unchanged from the July 1
forecast but is 3 percent below the 1984
production.
This forecast marks the
lowest production since 1957. The
tobacco yield forecast is a record-tying
2,250 pounds per acre. That record was
set last year. Acres to be harvested at
37,000 are off 3 percent from the
previous year and the smallest s i nce
1932.
COTTON PRODUCTION JUMPS UP
Georgia's cotton growers are e xpected t o harvest the second best yield i n the State ' s h i story. A yield o f 725 pounds per acre is forecast , down 59 pounds per acre from last year ' s record yield. Cotton production i s forecast at 370,000 bales , the largest crop since 1974. Cotton harvest is planRed from 245,000 acres, also the hig h est ~ince 1974 .
HAY PRODUCTION DOWN
A total of 520 t housand acres a re expected to be harvested, a 5 per cent reduc t ion from last year. The yield i s forecast at 2.3 tons per acre compared with 2.4 tons in 1984. The comb ination of r educed har vested ac reage and yield per acr e i s expected to r educe product i on of hay t o 1.20 million tons, a decrease of 9 percent f r om last year's record production of 1.32 million tons.
The Georgi a Farm Re po r~ ( IS SN-{)744- 7280) Is pu b II shod sor:~I - I!"On th I y by ~he Geor gIa Crop /kepo r tl n9 Sorv l c e , Stephe ns federal Bul l dln9, At he ns, Ga. 306 13, Larry E. Sn ipe s, S ~atistl c la n -ln -Cha rge , Second Class postage paid at Athen s , Ga, Sub scri p tio n fee SI O per ye~r exce pt f r ee t o data contr i butc rs . Subscr ipti on Infor mat i o n available fr an:
Georgi a Cr op Repor t ing Service , Stephens
Federa l Sui I ding , Sui te 320 , At hens, GA 30613 Teleohone: (4()4) 546-
2
UNITED STATES IIIGIILIGIITS, AUGUST 1, 1985
All wheat production is forecast at 2.18 billion bushels, 8 percent less than 1984. Winter wheat production is placed at 1.84 billion bushels, down 11 percent from 1984. Other spring wheat production is forecast at 436 million bushels, up 1 percent. nurum wheat is forecast at 97.8 million bushels, down 5 percent from the 1984 crop.
Food ~rain production (wheat, rice, rye) is expected to total 70.8 million metric tons in 1985. down 9 percent from 1984.
Corn for grain production is forecast at a record high 8.27 billion bushels, 8 percent more than last year.
Feed grain production (corn, sorghum, oats, and barley) is expected to total 257 million metric tons, up 9 percent from 1984.
Soybean production is forecast at l. 96
billion bushels, 5 percent above last
year and 20 percent above the drought-
stricken 1983 crop.
The 90 percent
confidence interval for this production
forecast is 1.76 to 2.16 billion bushels.
Hay production is forecast at 148 million tons, down 2 percent from last year. Pasture and range feed condition on August 1 averaged 70 percent, 5 points below a year ago.
All cotton production is forecast at 13.8 million bales, an increase of 6 percent over the 1984 crop.
All tobacco production is forecast at 1.51 billion pounds, 12 percent below 1984 but 6 percent above 1983.
Peanut production is estimated at 4.26 billion pounds, down 3 percent from last year's record crop but 29 percent above 1983.
Croo
Corn for Grain Sorghum for Grain Oats Barley All Wheat Rye Soybeans for Beans Peanuts for Nuts Upland Cotton 1I Cottonseed All Hay Sweet potatoes Tobacco Apples, Com'l Peaches Grapes Walnuts (Calif.) 1/ Yield in pounds.
UNITED STATES ACREAGE AND PRODUCTION.
Area Harvested
Yield
Indi-
cated
Unit
1984
!985
1984
1,000 Acres
Bu.
71 ,816
74,756
106.6
Bu.
15,348
16,156
56.4
Bu.
8,123
8,750
58. 1
Bu.
11 17 1
11,769
53.4
Bu.
66,928
64,608
38.8
Bu.
981
677
.33. 0
Bu.
66,093
62,223
28.2
Lbs. 1,531.0
1,479.0
2,878
Bales 10,299.5
10,277.6
599
Tons
Tons
61,585
61,8 01
2.45
Cwt.
10 3.5
105.9
125
Lbs.
79 1.6
700 .8
2,182
Lbs.
Lbs.
Tons
Tons
1984 AND er Acre
Indicated 1985
110 . 6 64.9 59.3 51.0 36.8 28.5 31.5
2,878 637
2.40 132
2 . 16 1
1985
I
Production
Indicated
I 1984
Aug. 1, 1985
Thousands
7,656,195
8,265,55 4
865,856
1,047,891
471,921
51 9,028
596,546
599' 730
2,595,479
2,376,451
32,392
19,298
1,860,783
1,959,439
4,405,745
4,256,300
12,851.4
13,637.4
5,149
5,474
150,781
148,473
12,986
13,988
1 , 727,306
1,514,440
8,285,500 8,072,000
2,643,800
2,108,500
5,163.9
5,543.4
213.0
215.0
3
GFR-85-Vol. 16
GEORG IA PRICES RECEIVED
U.S . PRICES RECE I VED INDEX DOWN 1 PO I NT
Avera ge pr i c es re c e i ved by G eo r~ ia far mer s at mid-J ul y were down fr om t h e p rev iou!i mon th. lli g her p r ices f o r wheat , co tton , and hogs were mo r e t han offs e t b y lower pr ices fo r corn, soybeans, be et
ca t tle, c a l ves , milk, other c h i c kens, a nd mar ket e ~p,s . The Geor gi a Pr ices Received All Commod it y I ndex for Jul y was 121 perce nt ot the i977 average, 2 point s lower th a n the prev i ous mo nth a nd 12 p o int s l o we r than last y ea r.
The Julv Inde x o f Prices Recei v ed bv
Farmer s for All Farm Pr oduct s d ec rease d i
po i nt ( 0.8 pe rc ent) f r o m J un ~ t o 12 7
perc ent of i ts J a nuary-De cembe r 19 77
ave r a ge .
Lo we r price s f o r c at tle,
o r ange s, wheat, potatoes a nd soy beans
wer e p art ia lly offset hy h i g her p r ic e!'i
f o~ l ettuce, onions, hogs , ap ples an d
grapefruit. The Inde x was 18 poin ts ( 12
percent) below a year ago.
Commodit
PRICES RECEIVED BY FARMERS. JULY 15
Price
Geonzia
per
July
June
Unit
1984
1985
S/Bu.
3.16
2.83
S/Bu.
S/Bu.
3.49
3.06
Ct./Lb.
56.0
Ct./Lb. 158.0
S/Bu.
6.86
5 . 78
S/Cwt.
15.00
2/-
S/Ton
S/Head 885.00
S/Cwt.
51.50
46.10
S/Cwt.
40.90
35 . 70
S/Cwt.
53.00
46.90
S/Cwt.
42.00
44 .40
S/Cwt. S/Cwt.
37.00 49.30
37.00
so. so
S/Cwt.
52. 00
56.80
S/Cwt.
14 .1 0
13.70
Ct./ Lb.
198 5 WITH COMPARISONS United States
July 15,
July
June
July 15
1985
1984
1985
1985
2.84
3.26
2.99
2.90
l. 71
1.59
1.37
2.89
3.30
2.63
2.63
1/58.5 3/-
65.9 155.9
57.5
-
1/56.4 3/-
5.70
6.95
5.62
5.52
14.40 2/ 20.50
18.70
870.00
72 . 60 910.00
71.80
-
68.80 865.00
47.40
52.00
44.60
46.80
36.40
42.90
37. 00
36.90
48 . 40
53.70
45.50
48.00
42 . 70
57.60
53.60
51.20
36.90
37.80
37.40
35.40
49.00
62.30
56 . 60
54.20
55.10
59 . 10
62 .60
60 . 70
3/13 . 50
13 .00
12. 10 3/12 . 10
43 . 7
41.4
44.6
Ct./Lb.
-
-
-
Ct./Lb.
34 .7
31.1
3/30.6
Ct . /Doz
60 . 2
2/53 .2
52.8
Ct./Doz
52 . 9
2/ 45.5
45.2
Ct . /Doz
1/ Fi r st ha l f of month. 2/ Mid-mont h price. 3/ Ent i re month. 4/ Animals sold for da i ry
he r d replac ement only. 5/ Prices estimated quar t erl y. 6/ "Cows" and "st eers and heifers '
combined with allowance where neces sary for slaught e r bulls . 7/ I ncludes dairy cows sold
for slaughter. 8/ Liveweight e q u i valen t pri c e fo r Geo r gia . 9/ Ave rage of al l e gg s sold
by farmers including hatching eggs sol d at r etail.
I tem
FUELS : PR I CF.S PAI O, UNITED STATES, JULY 1985 , WI TH COMP ARISO NS
y ~ - -- -~~ ~~ --- 1 June 1 5
Doll a rs pe r Gallon
Ga sol i ne, Servi c e S tat i on , Unl ead e d 1/
1. 20
1. 23
Gasoline , Rulk Deli v er y, Lead e d Re p,u l n r i/
1 15
i. 18
Diesel Fuel, Bulk Deli very 2/
1.00
. 967
I..P. Gas, Ru1k Deliverv 2/
. 74 7
.7 25
1/ Incl udes federal, state and loc al pe r gal l on t axes . 2/ Excl udes stat e r o a d
hut includes state and ]oc a] per gallon taxes wher e a ppl icab le.
4
u _ _Ju_ly
1 . 24 1. 19
. 94 4 .7 19 t a xes ,
U.S. PRICES PAID INDEX UNCHANGED
The July Index of Prices Paid by Farmers for Commodities and Services, Interest, Taxes, and Farm Wage Rate s was 164 percent of its 1977 average. The Index was unchanged from last month and a year earlier. Offsetting the decreases in the feeder livestock and feed indexes was an increase in the family living component.
CONSUMER PRICE INDEX
The June unadjusted consumer price index for all urban consumers (CPI-U) at 322.3 (1967100) was 0 . 3 percent higher than in
May and 3.7 percent above ~e 1984. On
a seasonally adjusted basis, the CPI-U
was 0.2 percent above May.
Sharply
higher costs for drugs and ,edical
supplies along with increases in m~ical
care servi ces pushed the medical c
index up 0.7 percent. Increases of
percent
were registered for
the
entertainment and other goods and
services indexes. The housing and apparel
and upkeep indexes rose 0.3 percent. The
food and beverages index was 0.1 percent
higher. A decline of 0.1 percent was
recorded for the transportation index as
used car prices dropped.
PRICES PAID BY FARMERS. JULY 15. 1985 WIT!! COMPARISONS
Commoditv
I Price
oer
.!uly 15,
Unit
1984
Georgia June 15,
1985
July 15, : 1985
United States
July 15, June 15,
July 15,
1984
1985
1985
Oairy Feed 16/.
S/Ton
187.00
165.00
156.00
i'92.00
168 .00
168.00
Dairy Feed 18 /.
S/Ton
192.00
167.00
158.00
197.00
170 .00
169.00
Dairy Conc t. 32/.
S/Ton
250.00
172.00
172.00
266.00
220.00
218.00
Hog Feed 147.-187.
S/Cwt.
11 .90
10.20
10.50
11. 10
9.46
9.40
' ?. . Conct. 38/.-42 /.
S/Cwt.
15.00
11. 50
II. 50
14.50
11.60
11.70
Cattle Conct.
--367. : onseed Meal 41 7.
S/Cwt. S/Cwt.
14.00 16.00
11 .00
II. so
11.50 11.50
12.40 15.20
10.20 11 . 50
10.30 11.30
, bean !'feal 447.
S/Cwt.
13.00
10.50
10. 50
13.00
9.82
9.74
an
S/Cwt.
12 .00
10.50
11.00
10.2 0
9.48
9.48
d lings
S/Cw t.
10.50
10.00
10.50
9 .52
8.84
8.80
n Meal
S/Cwt.
10 . 50
9. 10
9.00
8.8 7
7.40
7.39
)iler Grower
$/Ton
255.00
200.00
195.00
233.00
196.00*
196.00
.aying Feed
$ /Ton
215.00
162.00
15 9.00
209.00
182 . 0 0
181 .00
Chick Starter
S/Ton
230.00
185.00
180.00
235.00
202. 00
197 .00
Broiler-Feed Ratio 1/ Lbs.
2.5
3.0
3.0
3.0
3.2
3. 1
Hog-Corn Ratio 2/
Bu.
14.8
15. 1
16.4
15.8
17 .0
17 . 8
Milk-Feed Ratio 3/
Lbs.
1. 51
1. 66
1. 73
1. 35
!. 44
!. 44
Egg-Feed Ratio 4/
Lbs.
6.4
7.5
7.4 .
5.8
5.8
5.8
* Revised. 1/ Pounds of broiler grower equal in value t o 1 lb. broil er live we igh t. 2/ Bushels
of corn equal in value to 100 l b s. of hog live weight. 3/ Pounds o f 167. dairy feed equal in
value to 1 lb. whole mil k . 4/ Pounds of laying feed equal in value to I doz. eggs .
~00
INDEX NUMBERS- - GEO RGIA AND UNITED STATES
June 1984
Julv 198 4
June 1985
Julv 198 )
Georgia
Pri ces Received
/\11 Commodities
134
133
123*
121
Crops
13 7
Livestock & Products
131
131
122*
121
134
12 3*
122
United States
Prices Received
144
145
12R*
127
Prices Pai d 1/
165
164
164
164
Rat 1o 2/
R7
88
78*
77
"'"ltevi s ed. !/Mid-month 1ndex i n c 1ud1 ng 1nterest, taxes and farm wage rates. 2/ Rat1o
of Index of Prices Received t c Ind e x o f Prices Paid, Interest, Taxes and Farm Wage Rates.
5
Prices Received by Farmers, US
OOUAAS P!A IU. 10
" 8 1:" ..
/'....._, ........
'
/ '
.. ,
Sayb . . no
/
...
\ ....______...\....,
.r- )'
6I
. '
,...... , .. ..
,.....,,
\
\ ........
.... .,.- .. .. ._,_,
OOLLAIIS P!R CWT,
80
Sleera end
HeUera
60
-"~<
\.
..
.....,/
tI
l
/
' \.....-._., ;
GFR-85-Vol. 16
4
w.....
- - - ,~ ..--/""""-
'\-.._.-.- -........'-(./ .
2
Corn
40 ' '-...//""''....// -""'--)f'--...""--..J!'-, I Cow
Q" I !,!, ! . ! .. !111"1 " 1
I
I
!
! 11 , , t 11 1 t . 1
1
!
1981
1982
1983
1984
19135
1,000 GEORGIA FARMS DISAPPEAR
20 I.' I I ', I It I ' ' I I I I I I I I I I
I
!. I I I I I. I, I I I I I 1 I
1981
1982
1983
1984
1985
:j .S. FARM NUMBERS & LAND IN FAR~S DECLINE
The downward trend of the number o f
Georgia
tarms continues with the
disappearance of 2 percent, or 1,000 of
its 1984 farms.
With 50,000 farms
operating in 1985, the decline is less
than the 4,000 farms lost i n 1984.
There has been no change in land in farms from last year. The average Georgia farm increased in size from 265 acres in 1984 to 270 acres in 1985.
The number of farms in the United States in 1985 is estimated at 2.28 million, down 2 percent from the 2.33 million in 1984 and down 6 percent from the 2.43 million in 1980. The number of farms declined during the 1970's, showed a sl ight i ncrease in 1980 and 1981, then declined between 1 and 2 percent per year from 1982 to 1985.
Total land in fa rms for 1985 is 1,016 million acres, down fractionally from a year earlier and down 2.2 percent from 1980. Land in farms has declined every year since 1954. The average size of farms increased from 427 acres in 1980 to 445 acres in 1985.
Year
1980 1981 1982 1983 1984 1985
NUMBER OF FARMS. LAND IN FARMS. AND AVERAGE SIZE. 1980-1985
Georgia
United States
Number
Land
Average
I I of Farms
in Farms
Size
Number of Farms
Land
I in Farms
T Average Size
Thousands
Mil. Acres
Acres
Thousands
Mil. Acres
Acres
59
15.0
254
2,433
1,038.9
427
60
14.5
242
2,434
1,034.2
425
57
14.0
246
2,401
1,027.8
428
55
13.7
249
2,370
1,024.2
432
51
13.5
265
2,328
1 ,0 19.4
43 8
50
13.5
270
2 285
1 015.6
445
PERCENT OF FARMS BY ECONOMIC CLASS 1 UNITED STATES 1 1981 -19 85
Economic Class
Percent of Total Farms
Gross Value of Sales
1981
198 2
1983
1984
S1 , 000-S9,000
50 .8
51.3
50.2
50.5
S10,000-S99,999
37.0
35 . 8
36.6
35 .6
5100,000+
i 2. 2
12 .9
13.2
13.9
Tota l
100 .0
100.0
100 . 0
100 . 0
1985 51.2 35.0 13.8 100.0
6
FINANCIAL CHARACTERISTICS OF U.S. FARMS, JANUARY 1985 1/
nur i ng the last few years, farmers have
been affected directly or indirectly by
lower commodity prices, lower farm
exports, and lower farmland values. Most
farmers remain financially sound despite
those adverse conditions. Nevertheless,
about 214,000 farmers (out of 1.7 million
farms covered in a recent USDA survey)
are estimated to be
experiencing
financial stress due to a combination of
a high debt load (technically, a
debt/asset ratio of 40 percent or more)
and an inability to generate enough cash
to pay their bills. More than half of
these farms (129,000) have annual sales
of at least $40,000. An estima ted 38,000
of those farms (2 perc ent of the survey
total) are technically insolvent--their
debts exceed the value of their assets.
Those conclusions are based on USDA's January 1, 1985, Farm Costs and Returns Survey, which provides financial details for about 1.7 million U.S. farms. The !YJrvey' s estimate of the total number of
U.S. farms is less than t~ counted by the 1982 Census of Agriculture ~ rimarily because of differences in de~~iti on. Most of the farms undercounted b:~ the survey are in the smallest sales classes.
" The degree of financial stress is based
on two measures: the farm's debt/asset ratio and its estimated cash flow. The debt/asset ratio, which compares the amount of money invested by the farm operator with the amount owed to creditors, indicates the farm's overall financial soundness. The farm's cash flow position indicates the ability of the farm business and household to generate income (from farm or nonfarm sources) to meet production expenses, repay debt installments on principal and interest, and provide for family livinp, expenses.
The degree of financial difficulty
ident i fied
in the survey
varied
considerably across regions and for
different farm types.
1/ Financial
Characteristics of U.S. Farms, January
1985, USDA/ERS.
Dltlrlbutlon of Flnnellly Strul8d Ftrma by Sl CIIIS, Jnutry 1915
- $250 lo $499 (7%) Over SSOO (3%)
$20 IO $39 (1~%)
Under $10 (15%)
- -- - - - S 1 0 lo S19 (9%)
St i tt CI IUII 1 1 u ; etttd hill l"oVUI'Ifl "' 4011111 ftM#tllll lllle Otr .0, ll'f I'IIQIUI CUI'I flo
, ll'llllt lt llr tl l ltt t 4 111 "'1 ftllf'IIO 11 "' l<rtl'lf
7
t!J~E
'C'l"o"
3
"t:3'~
l~C' "~'
~jl i'"a8 .
.(.g.'.)
..
; ~
:3 OQ
'-'
0a-
!i!
Q.
qa
.~ ....
c.
.z....
<
~
'0'
'-'
' -~ fj
-1
VI
. ' V... ~
(
-1
...... I ..-.,
;..- ....
.r...
...t.
V1
I
l>
\N ~V
0"'""''
.....
(.;
0
......
\ ,L
\n
N
,z: , o
..:>
co
>...,en
1~-i~OF0!l
(/)~~
w 1:>1 I
n
~~~
-ow
oHctnn
>
17'1-i
w
C .S . OSIONS DOWN l) PERCENT
Produ c tion ot summer non-~tora~e onions iY forecast at 2.8) million cwt., down 15 percent from last year. Aren for harvest at
9,900 acres dropped II percent; while the average yield forecast at 288 cwt. per a c re, slipped 5 percent. The Texas crop should drop 40 percent from last year's production.
In the Texas High Plains, harvesting began in
early July and continued throughout the month
with minor delays because of weather
problems. Quality is lower than expected.
In the Trans-Pecos
area,
harvesting
activities were nearing completion by the end
of July. Yields have been average to good.
New Mexico harvest is well over half
completed, with good to excellent quality.
Harvest acreage is up 15 percent from last
year.
In Washington, fall-planted crop
yields are down 25 percent from normal due to
winter kill. The spring-planted crop is
expected to be off due to the hot and
unusually dry conditions this summer. Sizes
are expected to be smaller, but quality is
generally good.
U.S. PROCESSING SNAP BEANS UP 9 PERCENT
Contracted production for processing snap
beans in 1985 is forecast at 679 thousand tons, a gain of 9 percent from last year. The average yield is expected to reach 3.10
tons per acre, up 1 percent from last year.
New York snap beans look good to excellent
Additional moisture is needed in some areas
for normal growth.
New Jerser harvest
continues to progress on schedu e. Heavy
showers in the past two weeks resulted in
adequate topsoil moisture in most areas of
the State. In Delaware, 70 percent of the
snap bean crop had been harvested by August 1
copared with 50 percent last year and an
average of 65 percent. Maryland harvest is
nearly 90 percent done. Timely rains with
irrigation made an excellent crop. North
Carolina had a verr dry spring with the only
significant rainfa 1 coing in late July.
Tiely rains in Michigan have made the soil
moisture conditions favorable. In Wisconsin,
earlr yields were variable depending on
avai able rainfall.
Later fields should
yield near expected levels.
In Texas, war weather depleted soil moisture
but overall conditions reain good.
California harvest is underway. The crop has
. .de good proaress with ideal growing
conditions. Oreaon growers had difficulty
keeping up with irrigation needs during the
hot, dry weather of June and July. Harvest
is about 4-5 days ahead of nor. .l and is
about half ca.plete.
Harvesting
in
Washington continues at a fast pace in order
to ..intain quality. Many fields are dry.
8
Q'rt
AlJOO.c... 7
pr!EORGIA
FF-ARM REPORT
85"/ 1~
September 13, 1985 GFR-85-Volume 18
Re
GEORGIA
~ CROP REPORTING SERVICE
Stephens Federal Bldg. Suite 320 Athens, Georgia 30613 Phone : (404) 546-2236
HIGHLIGHTS: September 1 Crop Forecast Initial 1985 Pecan Forecast Peanut Stocks & Processing Agricultural Prices Cash Receipts & Farm Income
SEP1 6 1985
I..IU'-'Ul'iiL..I-.1 ~
UGA l tROARfES
FAVORABLE YIELD PROSPECTS CONT I~UED
The September 1 crop report shows a continuation of the favorable yield forecast of a month earlier. Yields for most crops are expected to he well above average, with some approaching or equaling record highs for the State.
Harvesting progress on September 1 was
being slowed by the rainy weather before
and during the near-miss of Hurri c ane
Elena.
Since then, skies have been
genera lly clear and harvesting act i vities
have been active.
(Continued on Page 8, Pecans Page 3)
GEORGIA ACREAGE AND PRODUCTION. 1984 AND 1985
Acreage
Yield ~er Acre
Production
Crop 1/
Planted
Unit for all
Har-
For
Indicated
Indicated
Purposes vested Harvest
Sept. 1
Sept. 1
1985
1984 1/ 1985 1/
1984
1985
1984
1985
--Thousand Acres--
--Thousands--
Corn
Bu.
1,080
985
1,000
82.0
80.0
80,770
80,000
Cotton 2/
Bales
250
172
245
784
705
281
360
Soybeans
Bu.
1,800
2,000
1. 750
20.0
26.0
40,000
4S,SOO
Peanuts
Lbs.
610
640
607
3,375 3,300 2,160,000 2,003,100
Sweet potatoes Cwt.
6.5
6.4
6.3
140
120
896
7S6
Tobacco,
Type 14
Lbs.
37
38
37
2,250 2,2SO
85,SOO
83,250
Pecans
Lbs.
120,000
10S,OOO
Appl~, All
Commercial 3/ Lbs.
50,000
3S,OOO
Peaches 3/
Lbs.
150,000
80,000
Grapes 3/
Tons
2.7
2.9
Wheat 3/
Bu.
950
890
825
35.0
30.0
31,150
24,750
Oats 3/
Bu.
115
60
SO
55.0
40.0
3,300
2,000
Rye 3/
Bu.
450
80
100
22.0
21.0
1,760
2,100
Sorghum 3/
Bu.
175
113
140
42.0
43.0
4,746
6,020
Hay, All 3/
Tons
520
550
520
2.40
2.30
1,320
1,196
1/ Harvested for principal use. 2/ Cotton yield in pounds and production in bales.
3/ Estimates brought forward from earlier ~urveys.
Agricu1tural Statisticl.an and Georgia Depart:.ent of Agriculture
U.S. HIGHLIGHTS
~ for grain production is forecast at a record high 8.47 billion bushels, up 11 percent from last year and 3 percent higher than the previous record set in 1982.
Sorghum grain production is forecast at a record high 1.14 billion bushels, up 9 percent from August 1 and 32 percent above last year's crop.
Feed grain production (corn, sorghum, oats, and barley) is expected to total 265 million metric tons, up 12 percent from 1984 .
Soybean produc tion is forecast at billion bushels, 11 percent above year and 26 percent more than 1983.
2.06 last
All wheat pr oduct i on is fo r ecas t at 2 . 40 billion bushels, 8 percent less than 1984. Winter wheat product i on is placed at 1.84 billion bushels, down 11 percent from last year. Other spring wheat is
GFR-8S-Vol. 18
forecast at 461 million bushels, 7 percent more than 1984. Durum wheat is set at 100 million bushels, 3 percent below last year's crop.
Food grain production (wheat, ~ce, rye)
is expected t d total 71.S million metric
dtwn tons in 198S,
8 percent from 1984.
All cotton production is forecast at 13.7 million bales, a decrease of 1 percent from August 1 but 5 percent above the 1984 crop.
All tobacco production is forecast at 1. 53 billion pounds, 12 percent below 1984 but 1 percent above the August 1 forecast.
Peanu~ production is estimated at 4.24 billion pounds, down 4 per cent from last year's record crop but 29 percent above 1983.
UNITED STATES ACREAGE AND PRODUCTION. 1984 i\ND 1985
Area Harvested
Yield per Acre
Produc t i on
lndi-
lndi-
Indi cated
c ated
cated
Sept . 1,
(;1"()12__
Unit
1984
1985
1984
1985
1984
1985
1,000 Ac res
Thousands
Corn for Grain
Bu.
Sorghum for Grain Bu.
71.816 15,348
74,756 16. 181
106.6 56.4
113.3 70.4
7,656,195 865,856
8,468, 504 1,138,841
Oats
Bu.
8,123
8,750
58. 1
61. 4
4 71,921
537,443
Barley
Bu.
11 1 71
11,769
53.4
50.9
596,546
598,840
All Wheat
Bu .
66,928
64,608
38.8
37.2
2,)95,479
2,400,296
Rye 1/
Bu.
981
677
33.0
28.5
32,392
19,298
Soybeans for Beans Bu.
66,093
66,223
28.2
33.2
1,860,783
2,062,889
Peanuts for Nuts Lbs. 1,531.0
1,475.0
2,878
2,877
4 ,405,745
4,243,000
Upland Cotton 2/
Bales 10,299.5
10,277.6
599
631
12,851.4
13,512.4
Cottonseed
Tons
5,149
5,422
Sweet potatoes
Cwt.
103.5
105.9
125
131
12,986
13,897
Tobacco
Lbs.
791.6
700.6
2. 182
2. 182
1,727,306
1,528,597
All Hay 1/
Tons
61.585
61,R01
2 . 45
2.40
150,781
148,473
Grapes
Tons
5,163.9
5,535.4
Apples, Com'l 1/ Lbs.
8,285,500
8,072,000
Pecans
Lbs.
232,400
261,800
Walnuts (Calif.) Tons
213.0
215.0
1/ Estimates carried forward from earlier forecast. 2/ Yield in pounds.
2
GEORGIA PECANS DOWN 12 PERCENT
The first forecast of Georgia's 1985 pecan crop places production at 105 million pounds. This is 12 percent or 15 million pounds below last year's crop . The forec ast consists of 90 mill i on pounds of improved varieties and 15 million pounds of seedlings. Rainfall during August and especially t he last few days of the mon t h as a result of Hurr icane Elena brought soil moisture levels up to a mostly surplus rating. Damage to the Georgia c rop from Hurricane Elena was slight.
U. S. PECANS UP
The season's first forecast for the 1985 U.S. pecan crop is 262 mill i on pounds, in-shell basis, 13 percent more than last year's crop, but 3 percent below 1983.
About 61 percent of the crop is expected to be from improved varieties compared with 73 percent in 1984 and 62 percent in
1983.
This
forecast reflects an
early
assessmen t of production losses in the
southeastern states that resulted from
Hurricane Elena. Most of the damage
losses occurred i n Alabama.
Lesser
amounts of damage were repo rted in groves
in the Florida Panhandle, southern
Georgia, Mississippi and Louisiana.
Generally, most of the primary damage
will result in production losses for this
year's c rop. Secondary damage is tree
injury wi th some broken l i mbs but a few
trees we r e lost due to being up-rooted by
the strong winds. Many growers who had
reported
prior to September 1 and
Hurricane Elena were re-contacted to
assess the losses resulting from Elena.
State
- - - Thousand Pounas - - -
Ala. Ark. Fla. Ga.
La. Miss. N. Mex. N.C.
Okla. S .C . Tex.
17,000 1, 750 1,500
85,000 3,000
5,500 29,000
500
1,000 1 , 000 22,000
9,000 1,100 2,200 100,000 1,500 4,000 24,000 1,830
2 , 000 3,600 20,000
14,000 1,200 2,000
90,000 3,000 5,000
25,000 400
2,000 1,500 15 , 000
7 , 000 750
1,900 15,000 19,000
2,500
1,100 7,000
500 4.'!,000
u.s.
167.250 169.230 159.100 102.750
1/ Budded, grafted or topworked varieties.
4 , 000 400
2,800 20,000
3,500 1,500
1,070 23,000
1,900 5 , 000
63.170
6,000 500
2 , 000 15,000 14 , 000
2,000
200 16,000
1,000 46,000
102,700
24,000 2,5 0 0 3,400
100,000 22,000 8,000 29,000 1,600 8,000 1 ,500 70 , 000
270.000
13,000 1 , 500 5,000
120,000 5,000 5,500
24,000 2,900
25,000 5,500
2 5,000
232,400
20,000 1,700 4,000
105,000 17,000 7,000 25 , 000 600 18,000 2,500 61,000
261.J!QQ__
J ULY PEA ~Ci STOCKS
u.s. VISIBLE SUPPLY OF PEANUTS
AT ~ONTH'S END 1/
Peanut stoc ks in commerc ial storage on
July 31, 1985, totaled 1.42 billion
pounds of equival e nt farmer stock. This
total includes 172 million pounds of
actual farmer stock .
July millings
totaled 157 million pounds. Millings by
type
were 20.8 million pounds of
Vi r ginias, 131 mi llion pounds of Runners,
and 4 .92 million pounds of Spanish.
Commercial processors util i zed 98.9
million pounds of shelled edible grade
peanuts during July. Crushings for oil,
cake, and meal totaled 32.3 million
pounds during the month.
Class
I I I Jul y 198 4
Jan. 1985
July 1985
(Million Pounds)
Farmers
Stock
9
1 ,892
17 2
Shelled
Peanuts 2/
436
743
891
Roasting
Stock
23
92
67
Total 3/
611
2,972
1,424
1/ Excludes stocks on farms. Includes
stocks owned by or held for account of
CCC in commercial storages. 2/ Includes
shelled edible and shelled oil stock.
3/ Actual farmers stock, plus roasting
stock, plus shelled peanuts X 1.33.
3
GEORGIA PRICES RECEIVED
The Georgia Pr ices Received All Commodity Index f or August was 121 percent of the 1977 av e~ age, u n changed from Ju l y but 3 po i nts lowe r than last year. Average prices rece i ved by Georgia f armers at mid-Augus t c ompared with July were mixed. Higher pri ces for beef cattle, calves, other chi ckens, and all eggs were offset by lower prices for wheat, corn, cotton, soybeans, hogs, milk, and broilers.
GFR-85-Vol. 18
U.S. PRICES RECEIVED INDEX DOWN 4 POINTS
The August I ndex of Prices Received by Farmers for All Farm Produc ts decreased 4 poi nts (3. 2 percent) from July to 122 percent o f its January-December 1977 average. Lower prices f or c orn, hogs, potatoes, soybeans, and oranges were partially offset by higher prices for lettuce, eggs, lemons, cattle, and peaches. The index was 21 points (15 percent) below a year ago.
PRICES RECEIVED BY FARMERS. AUGUST 15. 1985 WITH COMPARISONS
Price
GeorRia
United States
per
Aug.
July
Aug. 15,
Aug.
July Aug . 15,
Commoditv
Unit
1984
1985
1985
1984
1985
1985
Winter Wheat
S/Bu.
3.22
2.82
2.63
3.36
2.89
2.77
Oats
S/Bu.
1.67
1. 31
1.13
Corn
S/Bu.
3.09
2.72
2.35
3.13
2.60
2.39
Cotton
Ct./Lb. 59.0
58.5
1/56.5
67.4
58.0
l/54.5
Cottonseed 2/
$/Ton
115.00
69.00
Tobacco
Ct./Lb. 184.1
3/173.0
174.4
3/160.5
Soybeans
S/Bu.
6.55
5.70
5.21
6.50
5. 42
5.05
Peanuts
Ct./Lb.
1/-
27.3
1/-
Sweetpotatoes
S/Cwt.
16.20
2/-
12.70
15.30 2/18.70
13.70
All Hay, baled 2/ $/Ton
71.70
68.80
66 . 90
Milk Cows, 4/5/
$/Head
870.00
865.00
Hogs
S/Cwt.
49.00
47.40
45.80
50.50
45.80
43.40
Sows
S/Cwt.
41.20
35.50
35.40
42 . 70
36.60
36 . 10
Barrows & Gilt s
S/Cwt.
50.10
48.00
46.30
51.90
47.00
44.30
Beef Cattle 6/
S/Cwt.
42.70
40.20
42.50
56.60
50.20
50.50
Cows 7/
S/Cwt .
36.10
34.50
36 . 30
37 . 30
35.40
36.10
Steers & Heifers
S/Cwt.
49.80
48.00
50 . 00
61.30
53.20
53 . 40
Calve's
S/Cwt.
51.50
53 . 70
56.60
59.10
60.00
60 . 20
All Milk
S/Cwt .
14. 30
13.60 3/13.40
13.20
12. 10 3/12.10
Turkeys 2/
Ct . /Lb.
45.4
44 .6
48.3
Ch i ckens, Excluding
Broilers
Ct./Lb. 14.5
2/18.0
26.0
Com'l Broilers 8/ Ct./Lb. 29.0
29.5
3/27 .0
30.6
30.6 3/28.7
Eggs , All 9/
Ct . /Doz 69.4
2/58.7
70.8
59.0 2/52.8
57 . 8
Table
Ct . /Doz 53.8
2/ 41.9
50.7
51 . 5 2/45.2
50.4
Hatching
Ct./Doz. 120.0 2/100 . 0
125.0
1/ First half of month. 2/ Mid-month price. 3/ Entire month. 4/ Animals sold for dairy
herd replacement only. 5/ Prices estimated quarterly . 6/ "Cows" and "steers and heifers"
combined with allowance where necessary for slaughter bulls. 7/ Includes dairy cows sold
for slaughter. 8/ _Liveweight equivalent price for Georgia. 9/ Average of all eggs sold
by farmers including hatching eggs sold at retail.
The Georglo f arm Report ( ISSN- 0744- 7260 ) Is pub li s he d sem i- month l y by t he Georgl o Cr op Report ing Service, Stephe ns Fede ra l Bu l Id i ng, Athe ns , Go, 306 13 , Lorry E. Sn ipes, St ati st ic i on In Cho"9e. Second c lass post age pe ld ot Athens , GA. Su bscripti on t ee S1 0 per year except t ree to dote contr i butors , Su bsc r ip t ion In fo r ma ti on avol lab le trom : Georgi a Crop Reporting Serv ice, St ephens Federa l Bu 11d i nQ , Su ite 320, Athe ns , GA, 30613 Telephone : (404 1 546-2236,
4
U.S. PRICES PAID INDEX UNCHANGED
The August Index of Prices Paid by Farmers for Commodities and Services, Interest, Taxes, and Farm Wage Rates was 163 percent of its 1977 average. The inde x was unchanged from last month but down 1 point (0.6 percent) f r om a year earlier. The feed component continued its decline as prices for nearly all items decreased.
CONSUMER PRICE INDEX
The July Unadjusted Consumer Price Index for All Urban Consumers (CPI-U) at 322.8 (1967100) was 0.2 percent higher than in
June and 3.6 percent above July 1984. On
a seasonally adjusted basis, the CPI-U
was 0.2 percent above June. The other
goods and services index increased 0.8
percent primarily due to an increase in
the
prices of tobacco
products.
Increases of 0.5 percent were registered
for the medical care and entertainment
indexes. The housing i ndex rose 0.3
percent and the food and beverages index
was 0.1 pe rcent higher. A decline of 0.2
percent was registered by the apparel and
upkeep index, reflecting end-of-season
price reductions for clothing, a similar
decrease in the transportation index
reflected a drop in used car prices.
PRICES PAID BY FARMERS. AUGUST 15. 1985 WITH COMPARISONS
Price
GeorR.ia
United States
per
Aug . 15, July 15, Aug. 15, Aug. 15, July 15, Aug. 15,
Commoditv
Unit
1984
1985
1985
1984
1985
1985
Dairy Feed 164
$/Ton 181.00
156.00
156.00
188.00
168.00
165.00
Dairy Feed 184
$/Ton 189 . 00
158.00
162.00
194.00
169.00
167.00
Dairy Conct. 324
S/Ton 240.00
172.00
167.00
260.00
218.00
215.00
Hog Feed 144-18%
S/Cwt.
11.40
10.50
10.00
10.90
9.40
9.16
Hog Conct. 38%-424 S/Cwt.
14.50
11.50
11.50
14.20
11.70
11.70
Beef Cattle Conct.
324-364
S/Cwt.
12.50
11.50
11.00
12.10
10.30
10.20
Cottonseed Meal 41 4 S/Cwt.
16.00
11.50
11.00
15 . 00
11.30
11. 10
Soybean Meal 444
S/Cwt.
13 . 50
10.50
11 . 00
12.60
9.74
9.76
Br an
S/Cwt.
11.50
11.00
11.00
10.20
9.48
9.44
Middlings
S/Cwt.
11 . 00
10.50
10.50
9.56
8.80
8.65
Corn Meal
S/Cwt.
10.50
9.00
8.80
8.70
7.39
7.29
Broiler Grower
S/Ton 245.00
195.00
193.00
225.00
196.00
192.00
Laying Feed
$/Ton 195.00
159.00
158.00
202.00
181.00
178.00
Chick Starter
$/Ton 225.00
180.00
176.00
223.00
197.00
194.00
Broiler-Feed Ratio 1/ Lbs.
2.4
3.0
2.8
2.7
3.1
3.0
Hog-Corn Ratio 2/
Bu.
15.9
17.4
19.5
16.2
17.6
18.2
Milk-Feed Ratio 3/ Lbs.
1. 57
l. 74
1.72
1.40
1.44
1.47
Egg-Feed Ratio 4/
Lbs.
7.1
7.4
9.0
5.8
5.8
6.5
1/ Pounds of broiler grower equal in value to 1 lb. broiler l i ve weight. 2/ Bushels of corn
equal in value to 100 lbs. of hog live weight. 3/ Pounds of 16% dairy f eed equal in va l ue to
1 lb. whole milk. 4/ Pounds of laying feed equal in value to 1 doz. eggs.
1977100
INDEX NUMBERS--GEORGIA AND UNITED STATES
July 1984
August 1984
July 1985
August 1985
Georgia
Prices Received
All Commodities
133
124
121
121
Crops
131
124
12 2 *
118
Livestock & Products
134
125
121*
123
United States
Prices Received
145
143
126*
122
Prices Paid 1/
164
164
163
163
Ratio 2/
88
87
77
75
* Revised. 1/Mid-month index including interest, taxes and farm wage rates. 2/ Ratio
of Index of Prices Received to Index of Prices Paid, Interest, Taxes and Farm Wage Rates.
5
1984 FARM INCOME AND CASH RECEIPTS
Georgia farmers' gross farm income for
1984 soared to a record high $4.09
billion, 10 percent above 1983 and the
first time ever over the S4 billion mark.
Farm production expenses increased 1 percent to S3.01 billion. Realized net
farm income at S1.08 billion was up 47
percent from 1983.
This increase,
although
moderated
by
increased
production expenses, resulted mostly from
record cash receipts for items such as
broilers, eggs, peanuts and soybeans.
Georgia farmers continued to deplete farm
inventories during 1984 showing $21.1
million less value at the end of the
year. The reduction in inventories of
crops and livestock lowers the total net
farm income to 51.06 billion.
Livestock, livestock produc ts and poultry
accounted for 49.1 percent of t he 1984
cash receipts while crops accounted for
46.1 percent.
Farm forest product s
GFR-85-Vol. 18
accounted for 2.7 percent and government payments comprised 2.1 percent of the 1984 total.
Commercial broilers grossed a record S835 million or 22.2 percent of the total to again rank as the leading gross sales farm enterprise in Georgia. Eggs again ranked in fourth place among all commodities in cash receipts with 8.5 percent of the total. Cash receipts for hogs, cattle and calves and dairy products were off 5 percent, 24 percent and 8 percent, respectively.
Peanuts were again the leading cash crop
commodity,
ranking
second behind
broilers. Cash receipts from peanuts
were up 40 percent from last year and
totaled $520 million, or 13.8 percent of
the total. Soybeans receipts were up 27
percent from last year ranking soybeans
as the third most important cash receipt
commodity.
nem
FARM CASH RECF.IPTS AND GOV--E=RN=MEr~:-T-nPAaY:MrF.-N-TS-TFOR--GF.O!RnGIT A, 1982-11984 I7T<J1f7+
Thousand Dollars
CROPS Corn Cotton, Total Cotton, Lint
Cottonseed Peanuts Sovbeans
Tobacco Wheat
Peaches Pecans
Other Fruits and Nuts
Truck Crops
All Other Crops TOTAL CROPS
94,452 78,316 74,668
3,648
351,852 339,060 i ll9, 119 145,410
12 ,7 09 77,236
6,0 18 135,385 137,187 1,566,744
110,540 59,596 53,192
6,404 371 , 665 287,269 164,064
109 , 736 22,565 60,96 4 6,774
138,497 148,222 1,479,892
114,567 71,994 63, 18 7 8,80 7
520,353 364. 140 155,4 50
95,686 19,506 64,724
10 '081 131,454 190,650 1,738,605
LIVESTOCK
Hogs
253,809
Cattle and Cal ves
239, 47 4
Dairy Products
200,880
Commerc ial Broi le rs
610,735
Other Chickens
13,638
Turkeys
25,492
Eggs
299,656
Other
34,106
TOTAL LIVESTOCK AND PRODUCTS
1,677,790
TOTAL CROP AND LIVESTOCK CASH RECEIPTS
3,244 ,534
FARM FOREST PRODUCTS 2/
82,700
GOVERNMENT PAYMENTS
29,342
TOTAL CASH RECEIPTS
3,356,576
1/ Prel1m1nary. 2/ Includes farm sales only.
6
228,787 254,410 200,100 676,675
15,556 24,110 278,734 37,804 1,716,176 3,196,068 94,706 79,479 3,370,253
217,458 193,125 184,690 835,462
20,314 34,578 320,951 42,291 1,848,869 3,587,474 101,000 79,286 3,767,760
t..:
z ~
H
<
0 .....
-; II .....
)
~I
r"1 '-
(,;1
rn
'-
71
~ )
--1
J~3 \ .J
1
o
VI
I
v
....n.
~i >~;:!;'- ~~
~~[ ~....~...
;:r ~
:<-f",8~a ~(..'.)O.
~... -
~ ~
~~
aQ
"0"'
a-
~
CJ'
0:::
~
'-'
;;:,.. '"d CF.
;jg~
tz"l>l-iO z
Vl~O
1'11 (")
"' >C1>'t>lr
...., t...:..ltr.
-o<7->1-i
....,
Continued from Page PEANUTS UNCHANGED
Indications, as of September 1, pointed
to the same 3,300 pound per acre yield
forecast for August 1.
The current
f orecast is onl y 75 pounds below the
record yield set just a year ago.
Production is expected to be off about 7
percent this year to total just slightly
over 2 billion pound
TOBACCO YIELD EQUALS R~CORD
Georgia's tobacco yield is again forecast at a record-tying 2,250 pounds per acre. Even so, production is expected to slip 3 percent to 83.3 million pounds, due to a reduction in acreage from 38,000 last year to 37,000 this year.
CORN FORECAST STEADY
An average of 80 bushels per acre is
again forecast for Georg~a. While not a
record, the current yield is only 5
bushels below the record set in 1982 and
two
bushels below the 1984 crop. A
total production of 80.0 million bushels
is expected to be harvested from 1.0
million acres
COTTON UP 28 PERCENT
Cotton production is forecast at 360,000 bales, a 28 percent jump from last year and the largest crop for Georgia since 1974. A yield of 705 pounds per acre is expected but is 20 pounds per acre less than was forecast last month. The yield is the third best of record
SOYBEAN YIELD RAISED
The soybean yield forecast, a t 26 bushels per acre, is 2 hushels higher than last month and 6 bushels above last year. Production is expected to total 45.5 million bushels, up 14 percent from last year. The more favorable yield prospects were due mainly to the favorable soil moisture levels during August
. &
44oo.c: 7
- . .-~ .
.. .-\. ~ '
.. ~ ~
.
.. .. -~-
' . -..-:- ::- ..
:t EORGIA
~~~RM REPORT
September 26, 1985 GFR-85-Volume 19
. ~
1
~p 1985
us. &JU\..UIVIC.I~ j ~
r1n ,,,fi lES
GEORGIA
~ CROP REPORTING SERVICE
stephens Federal Bldg. SUite 320 Athens, Georgia 30613 Phone: ( 404) 546-2236
HIGHLIGHTS: September 1 Hog & Pig Inventory Monthly Poultry Peanut Stocks Cattle on Feed
Milk Production Livestock Slaughter Cold Storage
IO QUARTERLY STATES INVENTORY DOWN 37.
GA. HOG INVENTORY DOWN 47. FROM A YEAR AGO
Inventory of all hogs and pigs on September 1, 1985, in the 10 states
Inventory of all hogs and pigs on Georgia farms on September 1, 1985, is estimated at 1,200,000 head, 4 percent less than a year earlier . This equals the June 1, 1985 total, but is the smallest September 1 inventory since quarterly estimates began in 1973. Hogs kept for breeding totaled 165,000 head, 8 percent less than the previous year, but the same as last quarter. Market hog inventory, at
conducting quarterly hog surveys is estimated at 41.8 million head, 3 percent below last year . This is the lowest September 1 inventory since 1975. Breeding inventory, at 5.38 million head, is 3 percent less than a year ago, and continues at the lowest level since 1975. Market hog inventory, at 36.4 million head, is 3 percent below September 1, last year.
1,035,000 head, is 3 percent less than a year ago.
The June-August 1985 pig crop was 16.9 million head, 1 percent below the
The June-August 1985 pig crop, at 482,000
head, is down 6 percent from a year
earlier.
Sows farrowing during this
period totaled 66,000 head, 8 percent
less than June-August 1984. Pigs saved
per litter averaged 7.30, compared with
7.10 the previous year.
corresponding period last year. There
were 2.19 million sows that farrowed
during June-August, down 3 percent from a
year earlier. This is the lowest number
of sows farrowed during the June-August
quarter since 1975.
Sows farrowing
during this quarter averaged 7.73 pigs
per litter compared with 7.60 last year
Georgia producers intend to have 62,000 sows farrow during September-November.
and a record high for the June-August quarter.
If these intentions are realized, farrowings will be 9 percent less than
Producers intend to farrow 2.27 million
the same period a year ago. Producers sows during September-November, 2 percent
also expect 60,000 sows to farrow during fewer than the comparable period in 1984.
December 1985-February 1986, the same as Farrowing intentions for December 1985-
the actual farrowing& a year earlier.
February 1986 are 1.93 mill i on head, fractionally below a year earlier.
Agricu.l.taral Statisticlan aod Georgia Depart.ent of ~icul tare
..
GFR-85-Vol. 19
HOGS AND PIGS: NUMBER ON FARMS, SOWS FARROWING AND PIG CROP GEORGIA AND 10 QUARTERLY STATES 1/
Item
September 1 Inventory All Hogs and Pigs Kept for Breeding Market
1,000 Head
43,180 5,550
37,630
41 ,820 5,377
36,443
1985 as 7. of 1984 Percent
1982 -- 1,000 Head--
97
1,400 1,350 1,250 1,200
97
215
200
180
165
97
1,185 1,150 1,070 1,035
1985 as % of 1984 Percent
96
1)2
97
Market Hoss and Piss
by Weisht Groups
Under 60 Pounds
14,957 14,630
98
531
512
471
450
96
60-119 Pounds
9,209 8,820
96
293
305
288
280
97
120-179 Pounds
7,835
7,406
95
221
207
193
190
98
180 Pounds & Over
5,629
5,587
99
140
126
118
115
97
Sows Farrowing
December 2/-February 1, 964
1. 935
99
74
75
66
60
91
March-May
2,481
2,420
98
76
81
77
70
91
December 2/-May
4,445
4 ,355
98
150
156
143
130
91
June-August
2,259
2. 191
97
80
74
72
66
92
September-November
2,316 3/2,268
98
78
72
68 3/62
91
June-November
4,575 4/4,459
97
158
146
140 4/128
91
Pis Crop
December 2/-February 14,288 14,538
102
511
518
462
432
94
March-May
18,814 18,762
100
555
583
554
518
94
December 2/-May
33,102 33,300
101
1,066 1,101 1,016 950
94
June-August
17,158 16,941
99
568
525
51 1
48 2
94
September-November 17,420
554 518 483
June-November
34,578
1 ,122 1,043 994
Piss Per Litter
Number
- - Number - -
December 2/-February 7.27
7. 51
103
6.90 6.90 7.00 7 .20
10]
March-May
7 .58
7.75
102
7.30 7.20 7.20 7 .40
103
December 2/-May
7.45
7.65
103
7.11 7.06 7.10 7.31
103
June-August
7.60
7 . 73
102
7.10 7. 10 7.10 7.30
103
September-November June-November
7.52 7 . 5 6 ,.J'-#
7.10 7.20 7.10
.... ....... 7, .10..,
7, . 14
7 . 1 0 # ...,
-
Farrowins Intentions
1985
1986
1986 as 7. of 1985
1985
1986
1986 as 7. of 1985
December 2/-Februarv
1,935
1,926
100
60
60
100
1/ GA, IL, IN, IA, KS, MN, MO, NE, NC, OH. 2/ December preceding year. 3/ Intentions.
4/ Actual farrowings for June-August plus intentions for September-November.
2
FACTORS AFFECTING LIVESTOCK AND POULTRY 1/
ECONOMY EXPECTED TO REMAIN SLUGGISH
The economy is likely to remain sluggish
for the next year or so, particularly in
the manufacturing sector where the strong
dollar continues to foster large imports
of manufactured items. Large losses of
jobs and pressure on wages continue
throughout this sector.
Recently,
weakness in the "high-tech" sector also
has
added to the woes in the
manufacturing group.
The economy has recovered from the near-
zero GNP growth in the first quarter.
Growth in the second quarter rebounded to
1.7 percent.
Growth may continue
to improve in the second half, but at a
slower pace than occurred in the last
couple of years.
Inflation rates
continue to be subdued and interest rates
declined again in the second quarter as
the Federal Reserve allowed the money
supply to expand.
The decline in
interest rates along with lower inflation
rates should bring about stronger
consumer durable purchases and hous i ng
investment in the second half of 1985
thereby supporting some growth into 1986.
Record large meat supplies since 1983 and
continued adjustments in the domestic and
i nternational economr have made i t
increas i ngly difficu t to
quant ify
supply-pr ice reactions with anr degree of
c e rta i nty. These supplies wil hold down
meat price gains through at least mid-
f all. Although meat supplies are likely
to fall in 1986, they will remain large
by histor ical standards--well above the
1970-84 average of 203 pounds per person.
LARGE GRA I N SUPPLIES TO HELP LOWER FEED COSTS
Lower feed costs remain one of the most
positive aspects of the meat sec tor
outlook.
Large grain stocks and
expectations of another large harvest
this fall will hold down grain pr ices
through much of 1986. Planted acreage in
feed grains reported in the July crop
report was estimated at 127 . 3 mi llion
acres--2 mill i on above the February
estimate and 5 mill i on above a year ago.
Feed grain output in 1985/86 is e xpec ted
to rise more than 5 percent from t h i s
ear. Lower grain exports because of
r arge world supplies and the strong U.S.
dollar are also expected, thus ending
stocks will likely expand.
Further
compounding the weak feed grain price
outlook is another large world wheat crop. Large quantities of wheat are being fed in the United States.
Large feed grain and wheat supplies will
continue to hold down farm prices of corn
at least over the next year. The farm
price of corn is expected to average
$2.65 a bushel in 1984/85, down sharply
from $3.25 last year. Prices are likely
to decline again in 1985/86, averaging
$2.45 to $2.65.
Wheat prices are
expected to average near to slightly
below 1984/85's $3.38 per bushel.
Soybean acreage dropped sharply this year as low prices and poor crops in the south
in recent years encouraged shifts to other crops, particularly grain sorghum.
Planted soybean acreage declined br 4.4 million acres to 63.3 million, the owest since 1977. Nevertheless, production is expected to rise in 1985/86 due to favorable conditions and large acreages
in higher yielding areas. Soybean meal prices at Decatur are likely to continue weak and may average $122 a ton in 1984/85, well below the 1983/84 average of $188.20. Further price declines are likely as export prospects remain poor . Prices nex t year may average only $100 to $130.
FORAGE PROSPF.CTS FAVORABLE; BUT DROUGHT AREAS REMAIN
Produc ers expec t to harvest hay from 62
million acres this year, a r i se of 1 and
4 percent over a c reages i n 1984 and 1983,
respectively. Alfalfa acreage is down I
perce nt from 1984 , bu t up 3 percent from
1983. Acreage f or all o ther hay ros e 2
and 4 percent fr om 1984 and 1983,
respect i vely.
Gi ve n the large hay
harvest l i ke l y this year and further
reductions i n livestock inventor i es, hav
supplieG should be adequate f or fall an~
winter feeding.
Pasture and ranRe feed c ondi ti ons on Ju l y 1 were below a year a g e and the 10-yea r
averaRe Condi ti ons were much improved in the Southern Gr eat Plains, about unchanged in the southeast, but s ha r ply
below a year earlier in the Northern Great Pla i ns and northwest. Dr ought, grasshopper infestations, and f i res have p l agued many western states th i s s ummer.
1/ USDA/ERS-Livestock and Poultry Outlook and Situation Report, AU8UBt 1985.
3
GFR- 85-Vol. 19
GEORGIA BROILER HATCH UP 4 PERCENT
U.S. BROILER HATCH UP 3 PERCENT
The August hatch of broiler type chicks in Georgia, at 60.0 million was 4 percent more than that for August 1984. There were 48.3 million eggs in incubators on September 1, up 5 percent from a year
earlier.
Nationally, the August 1985 hatch of broiler type chicks totaled 406.5 million
up 3 percent from August 1984. There
were 333.4 million eggs i n incubators on September 1, 1985, up 4 percent from a year earlier.
POULTRY HATCHING AND PLACEMENT--AUGUST 1985
7. of
7. of
Item
Aug. 1984
Jul. 1985
Aug. 1985
year aRO
I Jan. thru Aug.
1984
1985
I year aRO
--Thousands--
--Thousands--
Pullet Chicks Placed
Domestic (U.S.) 1/
Broiler Type
3,075
3,400
3,165 103
27,044
27,374
101
Egg Type
283
345
278
98
2,526
2,107
83
Chicks Hatched
Broiler Type
Georgia
57,649
60. 110
60,017
104
452,31 4
477,570
106
United States
394,491 406,912 406,490
103 3,113,132 3,244 , 324
104
Egg Type
Georgia
2,556
2,420
2,454
96
31,844
19,696
62
United States
34 , 824 31,825 32,169
92 336,805 271,801
81
Turke:~::s
Poults Place~
u.s.
13,491
19,430
15,378
114 2/181,512 2/191,163
105
!/Reported by leading breeders, includes expected pullet replacements from eggs sold
during the precedi ng month at the rate of 125 pull e t chi c ks pe r 30 dozen case of eggs .
2/Turkey poults placed Sept. 1984- Aug. 1985 .
I~em
Chickens Egg Type Broiler Type
Turkeys
EGGS IN INCUBATORS, SEPTEMBER 1 , 1985, UNITED STATES
l
1984
I
1985
I 7. o f Year Ago
Thousands --
30,018 319,118
12,/ol8
29,153
97
333,446
104
14 919
120
:-lUMB ER OF LAYERS AND
Georg i a Hatc hing Other
Tot a l Geor g ia Total t.; .S.
1984
198 5
Thousands
5 ,097 13 , 73 5 18 , 832
27 5~0
5 , 213 11,86 7 17 , 080 2 7 2 , 58 6_
I PRODUCTION. AUG UST 1985
Egg s per 100
Total Eggs Produc ed
Lave rs-Au
!
nur i n
198 4
1985
198 4
1985
Numbe r
Mill i ons
1,9 10 2, 068 2 , 023 2 , 088
1, 8n9 2 ,093 2,0 20 2 , 087
97 28 4 38 1 5 , 762 __
97 248 345
------~_,6 8 8
The Georglo Fo r m Report (JSSN - 0744- 72801 Is publis hed semi-monthly by the Georgia Crop Report ing Service , Stephe ns Federal Bu l Id i ng, Athens, Go , 30613 , Lo r ry E. Snipe s , Stat1st1c1 on In Cho r ge . Second class postage pold a t Athens, GA . Subscript ion fe e $10 per yeor except free to da t a contr ibutors. Subscript ion Information avo l la b le fr om : Georglo Crop Report ing Ser vice, Stephe ns Feder o l Bu ll~lnq , Su ite 320, At hens, GA . 3061 3 Tel ephone : (404) ~4 6 - 22 36 ,
4
COMMERCIAL POULTRY SLAUGHTER 1/. AUGUST 198~
% of
Item
Aug. 1984
Jul.
198~
I Aug. 1985
-Thousands- - -
year a20
Jan. thru Aug.
1984
1985
- - -Thousands-
Youns Chickens Georgia United States
50,435 402,868
56,260 391,644
58,265 392,241
116 354,582 97 2,882,496
426,339 2,985,200
Mature Chickens
Light Type U.S.
14,307
Heavy Type U.S.
3,021
Total U.S.
17,328
Total All Types, Ga. 3,710
9,667 3,174 12,841 2,471
9,525 2 ,8'5 12,370 1,924
67
97,950
94
23,356
71
121,306
52
25,043
100,680 24,485
125,16~
23,417
Percent Condemned
Young Chickens
Georgia
1.4
1.5
2/1.5
3/NA
United States
1.4
1.6
2/ 1.4
2/1 . 6
1/ Federally inspected slaughter data as collected by Meat and Poultry Inspection
Program. Current month data estimated by Market News Serv i ce. 2/ January-August
c~ndemnat i ons. 3/ Not available.
% of year a20
120 104
103 105 103
94
AUGUST PEANUT STOCKS
U. S. peanut stocks in commercial storage on August 31, 1985, totaled 1.21 billion pounds of equivalent farmer stock. This total i ncludes 69.3 million pounds of actual farmer stock .
Shelled peanut s on hand tota led 1. 08
b i llion pounds o f equivalent farmer
stock.
Roast i ng stock totaled 56.3
million pounds . There were 1. 27 million
pounds of Commodity Credit Corporat i on uncommitted stock on hand as of August 31, 1985.
Shelled peanut stocks on August 31, 1985, totaled 814 mi llion pounds of which 783 million pounds were edible gr ades and 31.1 million pounds were o i l stocks. Edible grade stocks by type were Virginias, 162 million pounds; Runner s, 566 million pounds; and Spanish, 54 . 9 mill i on pounds .
Period Ending
UNITED STATES STOCKS OF PEANUTS AND SPECIFIED PRODUCTS
AT THE END OF JANUARY 1984-1985 AND JULY 1984. AUGUST 1985 1/
Farmer
Shel l ed
Roast i ng
Farmer Stock Equ i valent
Stock
Peanuts 2/
Stock (In Shell)
Shelled Peanuts
I
Total 3/
1,000 Pounds
January
1984
1 507. 187
562 , 786
48,688
748,505
2,304, 380
1985
1,892,26 5
742, 623
91 , 68 4
987,689
2,971,638
July
1984
8,758
435 ,512
23,322
579,231
611,311
August
1985
69,262
813 8-l
56~ll1
1,082, 742 ___ 1, 207 ,935
1/ Exc l udes stocks on fa rms. Incl udes s to c k s owned by o r hel d for account of CCC in
commercial storages. Farmer stock on net weight basis. 2/ Incl udes s hel l ed edible and
shelled o i l stock . 3/ Ac tu al far mer stoc k , plus roast i ng stock, plu s shelled peanuts
X 1.33 .
5
CA'ITLE ON FEED IN 7 STATES DOWN 9 PERCENT
Cattle and calves on feed September 1 for slaughter market in the 7 states preparing monthly estimates totaled 6.14 million head, down 9 percent from a year ago and 8 percent below September 1, 1983.
Marketings of fed cattle during August totaled 1.70 million, 1 percent above last year and 3 percent more than August two years ago.
GFR-85-Vol. 19
Placements of cattle and calves on feed in the 7 states during August totaled 1.50 million, down 11 percent from last year and 5 percent below August 1983. Net placements of 1.44 million for August are 11 percent below last year and down 4 percent from two years ago.
Other disappearance totaled 62 thousand head, compared with 61 thousand during August 1984 and 88 thousand during August 1983.
CATTLE AND CALVES: NUMBER ON FEED, PLACEMENTS, MARKETED, AND OTHER DISAPPEARANCE,
7 STATES, AUGUST 1 TO SEPTEMBER 1
1985 as :>.:
Ite
1984
1985
of 1984
1,000 Head
On Feed, Auaust 1 1/
6,811
6,394
94
Placed on ~eed during August
1,680
1,502
89
Fed Cattle Marketed during August
1,683
1,697
101
Other Disappearance during August 2/
61
62
102
On Feed September 1 1/
6,747
6,137
91
1/ Cattle and calves on feed are animals for slaughter market being fed a full
ration of grain or other concentrates and are expected to produce a carcass that
will grade good or better. 2/ Includes death losses, movement from feedlots to
pastures and shipments to other feedlots for further feeding.
GEORGIA MILK PRODUCTION UP 8 PERCENT
U.S. MILK PRODUCTION RECORD HIGH
Georgia dairy herds produced 103 million pounds of milk during August 1985, up 8 percent from last year and up 2 percent from last month. The number of milk cows on Georgia's farms during August averaged 117,000 head, unchanged from a year ago and the previous month.
Production per cow averaged 880 pounds, 9 percent above last year and 2 percent above last month.
Milk production totaled a record high 12.3 billion pounds for August, 10 percent above August 1984 and 5 percent above the previous August record set in 1983.
Production per cow averaged 1,107 pounds during August 1985, 70 pounds above August 1984 .
The total number of milk cows averaged 11. 1 million head during August, 3 percent more than a year earlier.
MILK COWS AND MILK PRODUCTION, AUGUST 1984-1985
Georgia
Item
Unit
1984
1985 Percent
Milk Cows 1/
Thous. Head 117
117
100
Milk per Cow 2/
Pounds
810
880 109
Milk Production 2/ Mil. Lbs.
95
103
108
1/ Includes dry cows, excludes heifers not yet fresh.
calves.
United States
: 1984
1985
Percent
10,807 11,103
103
1,037
1,107
107
11,206 12,291
110
2/ Excludes milk sucked by
6
GEORGIA RED MEAT PRODUCTION UF
U.S. RED MEAT PRODUCTION UP
Georgia red meat production totaled 33.1 million pounds during August 1985, an increase of 4 percent from the same period last year. The January-August 1985 red meat production totaled 268 . 2 million pounds, a decrease of 9 percent
Commercial red meat production for the
United States for August 1985 totaled
3.40 billion pounds.
January-August
accumulated red meat production totaled
26.1 billion pounds, up I percent
from last year.
from last year.
The number of cattle slaughtered by commercial plants in Georgi a during August was 20,300 head, a decrease of 400 head from the previous year. Calves slaughtered in August totaled 200 head, down 1 ,600 head from a year ago.
Beef production during August totaled 2.12 billion pounds. Total head killed numbered 3.21 million and live weight averaged 1,102 pounds per head.
Veal production was 41 million pounds. Calf slaughter of 289 thousand head averaged 239 pounds live weight.
There were 143,100 hogs slaughtered in commercial plants across the state during August 1985. This amounted to 6,300 head more than last year.
Pork production totaled 1.21 pounds and total killed was 7.02 head, averaging 242 pounds.
billion million
Species
Georgia Ca t t l e Calves Hogs Sheep & Lambs
GEORGIA AND UNITED STATES LIVF.STOCK SLAUGHTER 1/
Number Slaughtered
Average
1985
Jan.-Aug.
Live We ight
Aug.
as 7. of '85 as 7. of
Aug.
1984
1985
1984
1984
: 1984
1985
1,000 Head
Percent Percent
Pounds
Total
Live Weight
Aug.
1984
1985
1,000 Pounds
20.7
20. 3
98
1.8
2
11
136 .8
143. 1
105
1
1
100
102
901
912
18,618
18 ,4 97
94
342
358
620
84
86
228
230
31. 193
32,917
83
93
90
7
9
United States
Ca t t l e
3,395.7 3,2 14.9
102
97
1,060 1, 102 3,600,798 3,542,72 1
Calves
315.6 289. 3
92
101
235
239
74,283
69,152
!logs
6,845.5 7,017.3
103
100
242
242 1,656 ,899 1,700,860
Sheep & Lambs
583 .1
51 7 .3
89
91
108
112
62,74 4
57,595
1/ Includes slaughter under Fede ral Inspection and other commercial slaughter, excludes
farm slaughter.
COMMERCIAL RED MEAT AND LARD PRODUCTION : UNITED STATES WITH COMPARISONS 1/
Aug.
1985 as /.
Jan.-Aug. 2/
1985 as /.
Kind
198 4
1985
of 1984
1984
1985
of 1984
Million Pounds
Percent
Million Pounds
Percent
Beef
2,112
2 ,1 22
100
15,577 15,789
101
Veal
44
41
93
312
322
103
Pork Lamb & Mutton
1,175 31
1. 210 29
103
9,624
9, 715
I 01
94
249
232
93
Total Red Meat 3,362
3,401
101
25,762 26,059
101
Lard 3/
75
77
103
60 7
612
101
1/ Based on packers dress we ights and excludes farm slaughter. 2/ Accumulated totals
based on unrounded data. 3/ Preliminary lard production includes rendered pork fat.
7
Commodity
Butter Cheese, Natural Eggs, Frozen Fruits, Frozen Fruit Juices, Frozen Meats, Red
Beef, Frozen Pork, Frozen Poultry, Frozen Turkeys, Frozen Vegetables, Frozen Potatoes, Frozen Peanuts, Shelled Peanuts, In Shell Pecans, Shelled Pecans In Shell
COLD
STORAGE STOCKS 1 UNITED STATES 1 AUGUST 31 1
August 31
July 31
August 31
1984
1985
1985
1,000 Pounds
462,716
280,664
263,826
1,147,647
963,513
952,358
16,575
18,034
18,436
715,819
706,975
728,818
1,065,859
1,405,865
1,286,194
627,626
738,801
678,063
290,045
319,651
311,256
269,483
343,715
294,644
476,096
494,099
567,136
331,332
304,727
385,553
1,755,657
1,566,296
1,953,084
516,529
828,240
736,543
124,626
414 t 140
343,992
7,254
38,232
29,040
30,336
27,856
24 t 171
54 473
35 301
23 765
1985
Percent of
Aus,. 1984 Jul.
Percent
57
94
83
99
111
102
102
103
121
91
108
92
107
97
109
86
119
115
116
127
111
125
143
89
276
83
400
76
80
87
44
67
1985
Gfoorg1a Crop Reportmg Service
Stephens Federal Bldg.
Suite 320 Athens, Georgia 30613
SEC OND-CLAS~
POSTAGE PAID AT ATHENS , GA 30613
)4 l M 1
V OF
L! R Y G 3Z
-
...
- --.
REPORT
October 16, 1985 GFR-85-Volume 20
. .
...
..L
1985
uU~UlVJ t:.l~ j ~
~A lto I ,.~IE:
GEORGIA
~ CROP REPORTING SERVICE
stephens Federal Bldg. Suite 320 Athens, Georgia 30013 Phone: ( 404) 546-2236
HIGIILIGIITS SOYBEAN STOCKS OCTOBER 1 CROP FORECAST AGRICULTURAL PRICES PEANUT FORECAST BY STATES PECAN FORECAST BY STATES 198.1+ SWEETPOTATO REVISIONS
HARVEST PROGRESS RAPID
Dry weather during September enabled
farmers to move ahead rapidlv with
harvesting of row crops. 'Earlier
harvesting delays due to rainy weather in
August were mostly overcome. The October
l crop report shows continuing prospects
for generally favorable yields, despite
the
month-long dry spell
during
September. Pastures reflected the lack
of rainfall with a sharp decline in
condition ratings, particularly during
the latter half of September.
(Continued on page 2)
GEORGIA ACREAGE AND PRODUCTION. 1984 AND 1985
AcreaRe
Yield per Acr e
Production
I ndi-
Indi-
Crop
Unit
Har-
For
cated
cated
. vested Harvest 1984 1/ 1985 1/
Oc t. 1 ' 1984 1985
1984
Oct. l 1985
--Thousand Acres--
--Thousands--
Corn
Bu.
985
1,000
82.0 80.0
80,770
80,000
Cotton 2/
Bales
172
260
784
720
281
390
Soybeans
Bu.
2,000
1,750
20.0 26.0
40,000
45,500
Peanuts
Lbs.
640
595
3,375 3,300 2,160,000
1,963,500
Sweet potatoes
Cwt.
6.4
6.3
140
160
896
1,008
Tobacco, Type 14 Lbs.
38
37
2,250 2,210
85,500
81,770
Hay, All
Tons
550
520
2.40 2.50
1. 320
1,300
Pecans
Lbs.
120,000
105,000
Apples, All
Commercial 3/
Lbs.
50,000
35,000
Peaches 3/
Lbs.
150,000
80,000
Grapes 3/
Tons
2.7
2.9
Wheat 3/
Bu.
890
825
35.0 30.0 31,150
24,750
Oats 3/
Bu.
60
50
55.0 40.0
3,300
2,000
Rye 3/
Bu.
80
100
22.0 21.0
1,760
2' 100
Soq~hum 3/
Bu.
113
140
42.0
43.0
4 746
6,020
1/ Harvested for principal use. 2/ Cotton yield in pounds and production in bales.
3/ Estimates brought forward from earlier surveys.
Agricultural Statistician and Georgia Depart.eat of Agriculture
PEANUT FORECAST REDUCED
The October 1 forecast of Georgia's
peanut yield was unchanged at 3,300
pounds per acre, but the acreage for
harvest was lowered 2 percent to 595,000
acres.
This, in turn, lowered the
production forecast to 1.96 billion
pounds, off 2 percent from the September
forecast and down 9 percent from last
year's record-high crop. Dry weather
during September allowed very rapid
digging and threshing. Through October
6, 94 percent of the crop had been dug
and 86 percent had been threshed.
COTTON EXPANDS
GFR-85-Volume 20
Cotton production in Georgia is expected to total 390,000 bales, based on conditions as of October 1, 1985. The current production forecast is 8 percent higher than last month's prediction and
is 39 percent larger than last year's crop. Both acreage and yield forecasts were increased. Acres for harvest are
now expected to be 260,000 acres, up 51 percent from last year. The 1985 yield is now expected to average 720 pounds per acre compared with the record-high 784 pounds per acre obtained last year.
(Continued on Page 8)
U.S. SOYBEAN STOCKS UP 81 PERCENT
The September 1, 1985 carryover of old crop soybeans into the 1985-86 marketing year totaled 318 million bushels , 81 percent above last year but 8 percent below September 1, 1983. Soybeans stored on-farm totaled 144 million bushels, more than double the stocks of September 1 last year. On-farm stocks account for 45 percent of the _soybeans stored in all positions. Off-farm stocks, at 174 million bushels, increased 62 percent from last year and accounted for 55 percent of the September 1, 1985 soybean stocks.
As indicated by year-end stoc ks, disappearance during the marketing year (September 1984-August 1985) totaled 1.72 billion bushels, 5 percent below las t year. Indicated disappearance during June-August 1985 totaled 291 million bushe l s , 2 percent less than during the same period last year. Final revisions of the 1984 soybean crop show production at 1.86 billion bushels, virtually unchanged from the previous estimate.
GEORGIA SOYBEAN STOCKS
Off-farm stocks of soybeans in Georgia are not being published separately to pro tect the confidentially of reports for individual operations. Georgia's off-farm stocks are included in the ~ni ted States totals. On-farm soybean stock s, as of September 1, 1985, are estimated at 1.6 mill i on bushels compared with .4 million bushels on the same date last year.
Date
1983 Jan. 1 Apr. 1 June 1 Sep. 1
UNITED STATES SOYBEAN STOCKS
I
On-Farms
I
Off-Farms 1/
1,000 Bushels
1 ,008,139 643,134 424,658 118,574
754,560 504,529 365,966 226,060
I
Total All Positions
1,762,699 1,147,663
790,624 344,634
1984 J an. 1 Apr. 1 June 1 Se p. I
620,171 374,237 l79,601
67,912
670,384 415,765 292,085 107,784
1,290,555 790,002 471,686 175,696
1985
Jan. 1
767,084
655,655
1,422,739
Apr. I
488,079
408,632
896,711
June i
326,596
281,821
608,417
Sep. 1
143 561
_.
174,335
317,896
j/ Includes stocks at mills, elevators, warehouses, terminals, and processors.
2
UNITED STATES HIGHLIGHTS, OCTOBER 1, 1985
Corn for grain production is forecast at .-ricord high 8.60 billion bushels, up 12 percent from last year and 4 percent more than the previous record high set in 1982. The forecast is up 2 percent from the September 1 forecas~.
Sorghum frain production is forecast at a record h gh 1.13 billion bushels, down 1 percent from September 1 but 30 percent above last year's crop.
Feed grain production (corn, sorghum, oats and barley) is expected to total 268 million metric tons, up 13 percent from 1984 and nearly double 1983.
Sorbean production is forecast 3t 2.11 6i lion bushels, 2 percent larger than the September 1 forecast and 13 percent more than 1984.
All cotton production is forecast at 13.6 illion bales, virtually unchanged from September 1, but 5 percent above the 1984 crop.
Peanut production is forecast at 4.24 billion pounds, down 4 percent from the record high crop in 1984 but 29 percent above 1983.
All say production is forecast at a
recor
high 157 million tons, up
fractionally from 1984.
Area for
harvest, estimated at 61 . 8 million acres
is up slightly from last year.
All tobacco production is forecast at 1.53 billion pounds, virtually the same as the September 1 forecast but down 11 percent from last year's production. Yield is expected to average 2,183 pounds per acre, very close to last year's 2,182
pounds.
Oilseed production (soybeans, cottonseed, peanuts, flaxseed and sunflower) is expected to total 66.0 million metric tons, up 11 percent from last year.
Food grain production (wheat, rice, rye) now totals 72.3 million metric tons for 1985, down 7 percent from 1984.
The U.S. forecast for lecah production, at 263 million pounds ( n-s ell basis), is up fractionally from the September 1 forecast and is 13 percent above last
year's crop.
UNITED STATES ACREAGE AND PRODUCTION. 1984 AND 1985
Area Harvested
Yield oer Acre
Produc tion
Indi-
Indi -
Indicated
Crop
Unit
1984
cated 1985
1984
c ated 1985
198 4
Oct. 1 1985
1,000 Acres
Thousands
Corn for Grain
Bu.
71,816
74,756
106.6
11 5 . 1 7,656 , 195 8,602,994
Sorghum for Grain Bu.
15,348
16,181
56 . 4
69.6
11 65,856
1,127,006
All Wheat
Bu.
66,928
64,588
38.8
37.4
2,595,479
2,418,818
Soybeans for Beans Bu.
66,113
62,223
28.1
33 . 9
1 ,860,861
2,108,379
Peanuts for Nuts Lbs. 1,531.0
1,455.0 2,878
2,917
4, 405,745
4,244,650
Upland Cotton 1/ Bales 10,299.5 10,252.6
599
632
12,851.4
13,492.4
Cottonseed
Tons
5,149
5,415
All !lay
Tons 61,585
61,801
2.4)
2.45
150,781
151,220
Sweet potatoes
Cwt.
103.5
105.9
125
134
12,986
14,230
Tobacco
Lbs.
791.6
700.6
2,182
2. 183
1, 727,306
i ,529,156
Apples, Com'l
Lbs.
8,285,500 8,114,500
Grapes
Tons
),163.9
5,410.4
Pecans
Lbs.
232,400
262,700
Oats
Bu.
8,123
11,750
58.1
61.4
471,921
537,443
Rye
Bu.
981
677
33.0
28.5
32,392
19,298
Almonds (Calif.) Lbs.
587,000
495,000
Walnuts (Calif.) Tons
213.0
215.0
1/ Yield in pounds.
rT- he-G-eo-rg-i - a - Fa- rm-R-ep-o- r t -( - ISS- N-- 07- 4 4- -72-80-) -Is-p- ub- lis- he- d -se- l!l- l-m-on- th- ly -by-t- he-G-eo- rg- ia ~ Cr~ op~R~ep- or- tin~g 1 Ser vice, Stephen s Federa l Buil ding , Athe ns , Ga. 30613, Larry E. Snipes, Stat i stician In Charge. Second c lass pos t ag e paid at Athe ns, GA . Subscription fee SIO per year except free to data cont ri butor s . Su bs cri pti on Informati on availab le fr0111 : Georgia Crop Reporting Service, Stephens Feder al Bui ldi ng , S uite 32(), Athe ns , GA. 30613 Telephone : (404) 546-2236.
3
GEORGIA PRICES RECEIVED
The Georgia Prices Received All Commodity Index for September was 122 percent of the July 1977 average, 2 points higher than last month but 7 points lower than last year. A~erage prices received by Georgia farmers at mid-September, compared with August, were mostly down. Lower prices for wheat, corn, soybeans, sweetpotatoes, hogs, cattle, calves and other chickens were offset by higher prices for ~obacco, peanuts, broilers and all eggs.
GFR-8S-Volume 20 U.S. PRICES RECEIVED INDEX DOWN 1 POINT
The September Index of Prices Received by farmers for all farm products decreased 1 point (0.8 percent) from Auguat to 120 percent of its January-December 1977 average. Lower prices for hogs, cattle, corn, onions, and potatoes were partially offset by higher prices for broilers, eggs, lemons, grapefruit, and oranges. The index was 18 points (13 percEnt) below a year ago.
@@I D
PRICES RECEIVED BY FARMERS SEPTEMBER 15 1 1985 WITH COMPARISONS
Price
Georgia
:
United States
per
Sept.
Aug.
Sept. 15, : sept.
Aug.
Sept. 15.
Commoditv
Un i t
1984
1985
1985
I 1984
1985
1985
Winter Wheat
S/Bu.
3.30
2. 68
2.60
3.38
2.81
2.81
Oats
S/Bu.
1. 67
1. I 5
1.12
Corn
S/Bu.
2.91
2.35
2.32
2 . 90
2.44
2.31
Cotton
Ct./Lb.
58. 5
52.5
1/52.5
64.6
56.0
1/54.3
Cottonseed 2/
S/Ton
8s.oo
131.00
69.00
66.00
Tobacco
Ct./Lb. 189.6
173.0 3/180.0
187.2
160.5 3!178. 5
Soybeans
S/Bu .
6.58
5.17
5. 10
6.09
5.09
4.97
Peanuts
Ct./Lb.
26.0
21.0
1/23.9
26.3
22. 1 1/24.2
Sweet potatoes
S/Cwt.
12.50 2/12.70
10.00
9.77 2/13.70
8.73
All Hay, baled 2/
$/Ton
71.70
66.90
67.10
Hogs
S/Cwt.
44 . 80
43.70
40.50
46.30
42.50
39.00
Sows
S/Cwt.
39.50
34.40
33.60
40.20
35.30
33.90
Barrows & Gilts
S/Cwt.
45 . 80
44.00
40.80
47.10
43.30
39.60
Beef Cattle 4/
S/Cwt.
38.80
42.40
39.30
55.70
49.40
48.00
Cows 5/
5/Cwt.
33.30
34.90
33.60
34.90
35.20
33.60
Steers & Ueifers
S/Cwt.
46.00
49.10
45.70
60.20
51.90
50.60
Calves
S/Cwt.
46.30
54.90
51.00
56.60
61.40
59.00
All Milk
S/Cwt.
14.40
13.50 3/13.50
13.60
12. 10 3/12.20
Turkeys 2/
Ct./Lb.
46.7
48.3
51.8
Chickens, Excluding
Broilers
Ct./Lb.
14.5
2/26.0
24.0
Com'l Broilers 6/ Ct./Lb.
29.5
27.0
3/29.5
31.3
28.7
3/31.6
Eggs, All 7 I
Ct./Doz
69.8
2/70.8
73.4
58.4 2/57.8
62.2
Table
Ct./Doz
55.2
2/50.7
55.3
51.2
2/50.4
55.5
Hatching
Ct./Doz. 120.0 2/125.0
125.0
1/ First half of month. 2/ Mid-month price. 3/ Entire month. 4/ "Cows" and "steers and
heifers" combined with allowance where necessary for slaughter bulls. 5/ Includes dairy
cows sold for slaughter. 6/ Liveweight equivalent price for Georgia. 7/ Average of all
eggs sold by farmers .including hatching eggs so4 ld at retail.
CONSUMER PRICE INDEX
The August unadjusted consumer price
index for all urban consumers (CPI-U) at
323.5 (1967100) was 0.2 percent higher
~han in July and 3.4 percent above August
1984. On a seasonally adjusted basis,
the CP! Housing,
-U was medical
0c.2ar~nearncde
nt abo other
vgeoodJs ualv~~.
services index~s all rose 0.5 oercent.
Increases in homeowners' and renters'
costs, drug and medical supplies prices,
physicians' fees, hospital room costs and
cigarette prices contributed to the
increases in the indexes. More moderate
index increases were reRistered for
apparel and upkeep, up 0.3 percent and
food
and bevera~es, up 0.1
perr~nt.
Partial~y offsetting these increases was
a
O.i
nercent decline in
the
entertainment index and a sharp 0.4
percent drop in the transportation ind~x.
This fourth consecutive monthlv decline in the transpor~ation index was caused mostly by declines in used car prices.
U.S. PRICES PAID INDEX DOWN 1 POINT
The Index of Prices Paid bv farmers for commodities and service~, interest, taxes, and farm wage rates was 162 percent of its 1977 average. The index was down 1 point (0.6 percent) from last month and was 2 points (1.2 percent) lower than September 1984. The feeder livestock component was the major contributor to the decrease from last month.
PRICES PAID BY FARMERS. SF.PTEMBER 15. 1985 WITH COMPARISONS
Price
Geor ia
:
United States
per
Sept. 1 5, Aug. 15, Sept. 15, : Se_pt. 15 , Aug. 15, Sept. 15,
Commodit
Unit
1984
1985
1985
: 1984
1985
1985
Dairy Feed 167.
$/Ton 184.00
156.00
160.00
184.00
165.00
163.00
Dairy Feed 187.
S/Ton 185.00
162.00
162.00
190.00
167.00
163.00
Dairy Gonet. 327.
$/Ton 230.00
167.00
167.00
253.00
215.00
220.00
Hog Feed 14 7. -187.
$/Cwt.
11.00
10.00
10.00
10.70
9.16
9. 13
Hog Gonet. 387.-427.
S/Cwt .
14.00
11.50
12.00
13.80
11 . 70
12. 10
Beef Cattle Gonet.
327.-367.
S/Cwt.
12.50
11 .00
11.00
12.00
10.20
10.10
Cottonseed Meal 417. S/Cwt.
15.50
11.00
11.00
14.90
11. 10
10.80
Soybean Meal 447.
S/Cwt.
13 . 50
11.00
11.50
12.30
9.76
10.00
Bran
$/Cwt .
11.00
11.00
11.00
10.20
9.44
9.35
Middl.ings
S/O.::wt.
10.50
10.50
10.50
9.50
8.65
8.53
Corn Meal
S/Cwt.
9.80
8.80
8.30
8.50
7.29
7.13
Broiler Grower
$/Ton 255.00
193.00
187.00
221.00
192.00
189.00
Laying Feed
$/Ton 192.00
158.00
156.00
198.00
178.00
177.00
Chick Starter
S/Ton 245.00
176.00
178.00
224.00
194.00
191.00
Broiler-Feed Ratio 1/ Lbs.
2.3
2.8
3.2
2.8
3.0
3.3
Hog-Corn Ratio 2/
Bu.
15.4
18.6
17.5
16.0
17.4
16.9
Milk-Feed Ratio 3/ Lbs.
1.57
1.73
1.69
1.45
1.47
1.50
Egg-Feed Ratio 4/
Lbs.
7.J
9.0
9.4
5.9
6.5
7.0
1/ Pounds of broiler grower equal in value to 1 lb. broiler live weight. 2/ Bushels of corn
equal in value to 100 lbs. of hog live weight. 3/ Pounds of 167. dairy feed equal in value to
1 lb. whole milk. 4/ Pounds of laying feed equal in value to 1 doz. eggs.
PJT70i.uu------
INDEX NUMBERS--GEORGIA AND UNITED STATES 1\ug. I 9 8 l t ----~pr;-T98<t---~ug:--IY!f5
Sept. 1985
Georgia
Prices Received
All Commodities
124
129
120*
122
Crops
124
Livestock & Products
125
132
116*
120
127
122*
124
United States
Prices Received
.143
138
121*
120
Prices Paid 1/
164
164
163
162
Ratio 2/
87
84
74*
74
.-Revised. 1/Mld-month index -inCludinginterest~Tiixes ana-filt'm wage rates. 2/ Ratio
of Index of Prices Received to Index of Prices Paid, Interest, Taxes and Farm Wa Re Rates.
5
1984 UNITED STATES SWEETPOTATO CROP LARGER
Sweetpotato production totaled 13.0 million cwt. in 1984, up 7 percent from 1983, but
12 percent below 1982. Area harvested, at 104 thousand acres, gained 1 percent fron
1983, but was 10 percent short of 1982. The average yield of 125 cwt. per acre wat
up 7 cwt. from 1983, hut fell 4 cwt. short of the recorci high established in 1982.
Sweetpotatoes were valued at $182 million in 1984, up 10 percent from a year earlier
and 53 percent above 1982. The season average price was $14.00 per cwt. in 1984, UI
40 cents from 1983 and nearly $6.00 above 1982.
~-
SWEETPOTATOES:
YIELD A~D PRODUCTION BY STATES 1983 1\ND 1984
liar-
State I Planted
vested
1 ,000 Acres
Cwt.
?roduction 1,000 Cwt.
Har-
Planted
vested
1,000 Acres
Cwt.
Production ! ,000 Cwt.
Ala. Calif. Ga. La. Md. lofiss. N .J. N.C. S.C. Tenn. rex. IJa.
c.s.
State
5.0 8.8 6.0 25.0 1.1 4.8 2.5 38.0 4.0 i.4 7.4 L3 105.3
4.9 8.8 5.8 24.0 1. 1 4.7 2 .4 37.0 4.0 I. 4 7. 1 1.2 102.4
105
515
195
1,716
125
725
95
2,280
165
182
95
447
90
216
120
4,440
1 15
460
80
112
120
852
: 15
138
118
12 083
6.0 8.0 6.6 24.0 1.1 5.0 2.4 39.0 5.0 1.0 7.6
.7 106.4
5.9 8.0 6.4 23.0 1.! 4.8 2.4 38.0 5.0 1.0 7.3
.6
103~-.-
11 5
679
180
1,440
140
896
105
2,415
160
176
105
504
110
264
135
5 ,130
100
500
95
95
110
803
140
84
125
12,986
SWEETPOTATOES: PRODUCTION, FAR~ DISPOSITION, SF.ASON AVERAGE PRICE RECEIV~D
. BY FAR-MER- ~. AND VALCE. BY STATES. 1984 CR0
Farm Disoosition
To::al Used on Farm Where Grown
Value of
Prod-
Used
For Seed,
Shrinkage
Sold
Price
?rod-
Sales
uction
for
Feed an<!
and
per
uction
Seed
Household
~ oss
Cwt.
Use
1,()00 Cwt. -- - - - - - -
Dollars
1,000 Dollars
Ala. Calif. Ga. La .
lo!G.
:-!iss.
~ .J.
x.c.
S.C. :"enn. Tex. Va.
u.s.
679 1,440
896 2,413
176 504 264 5, 130 500
95 803
84 12.986
26 18 46 184
7 66 19 533
.:. c
9 76
6 ! 1050
35 43 120 :93
9 65 14 6j6 60 21 75
5
~.256
41
599
15.50
10,525
9,285
~') I-
1,325
15. l 0
21,744
20,008
26
750
14.10
12,634
10,575
8)
2,!17
7.90
19,079
16,882
7
160
11.30
1. 989
1, 808
26
4i3
9.25
4,662
3,820
11
239
16. 10
4,250
3,848
205
4,309
15.00
76,950
64,635
20
420
17.]0
8,630
7,266
5
69
13.90
1,321
959
24
704
24.30
19,513
17,107
4
75
10 .40
874
780
530
1 ~ I 200
14.00
182.191 156.973
6
U.S. PEANUTS OFF 4 PERCENT
U.S. PECANS UP 13 PERCENT
U.S. peanut production is expected to total 4.24 billion pounds, down 4 percent from last year's record-high crop but 29
percent above 1983. Harvested area is estimated at 1.46 million acres, down 5 percent from 1984 but 6 percent above 1983's acreage. This year's anticipated
yield of 2,917 pounds per acre is record high, averaging 39 pounds above the previous record yield set last year.
-?~ -~ANUTS FOR NUTS
Har-
vested Yield
Production
Ind.
Ind.
Ind. 1'83 as/.
State 1985
1985
1985 of '84
1,000
Pounds 1,000
Acres
Pounds
Ala.
204.0 3,050
622,200 96
Fla.
74.0 3,000
222 , 000 90
Ga.
595.0 3,300 1,963,500 91
New
Mex. . 1/ 13.0 2,300
29,900 93
~.c.
153.0 2,930
457,250 102
Okla .
86.0 2,300
197,800 105
S.C.
12.0 2,800
33,600 86
Tex.
220.0 2,000
440,000 119
Va.
96.0 2,900
278,400 103
u.s. 11455.0 21917 412441650 96
1/ Estimates for current year carried
forward from earlier forecast.
Southeastern growers (Alabama, Florida, Georgia, and South Carolina) expect their production to total 2.84 billion pounds, down 8 percent from 1984. Growers expect to harvest 385,000 acres this year, 7 percent less than a year ago. Yield for the 4-state area is expected to average 3,211 pounds per acre, 44 pounds below 1984.
The Virginia-North Carolina crop is forecast at 736 million pounds, 2 percent above last year. A yield increase of 77 pounds per acre is expected for the twostate area over last year's yield.
The Southwest (New Mexico, Oklahoma, and Texas) crop is expected to total 668 million pounds, 13 percent above 1984. Acreage for harvest is down 3 percent but yield per acre, at 2,093 pounds , is up 289 pounds from last year's yield. Oklahoma is expecting a record high yield of 2,300 pounds per acre, while Texas is expecting 2,000 pounds per acre, also record high.
The October 1 forecast for the 1985 U.S. pecan crop is 263 million pounds (inshell basis), up fractionally from the September 1 forecast, and up 13 percent from last year's crop. Approximately 61 percent of this year's crop is expected to be production from improved varieties compared with 73 percent improved last year and 62 percent in 1983.
Georgia's crop, which will contribute
about 40 percent of the National total,
is now forecast at 105 million pounds.
That is unchanged from the previous
month's forecast but is 12 percent less
than last year's crop.
Alabama's
forecast remained at the 20 million pound
forecast of a month ago.
Hurricane
damage was already assessed and reflected
in the September 1 forecast. The current
Alabama crop is expected to be 54 percent
larger than last year's.
OECAN PROD UCTION
Im-
proved
Seed-
Total
State
1/
~ nd.
1985
ling Ind. 1985
I' :nd. 8 3 as i~
1985 of '84
Thousand Pounds
Ala.
15 ,000
3, 000 20,000
154
Ark.
1,500
600
2,100
140
Fla.' 2,000
2 , 000
4,000
80
Ga.
90,000 15 , 000 105,000
88
La .
3,000 14 ,000 17,000
340
:"fis s.
4,500
2,000
6,500
118
N. Mex. 26,000
26,000
108
N.C. 2/ 400
200
600
21
Okla.
2,000 16,000 18,000
72
S.C.
1,500
1 ,000
2,500
45
Tex.
15,000 46,000 61,000
244
u.s. 160~Q 101,800 262,700
113
1/ Budded, grafted or topwor~ed varie-
t i es. 2/ Estimates for current year
carried forward from earlier forecast.
7
-I
.......
......
-1
~~; ~~ ~,.-g.
~
:r:0 . . .....~....a,.
C!!:
~
0
:~!.
<~ 0 i''i"Q'O
... ail aiG
iii "
1~9 19 !:!
Cll
"' "" 0 0:
.~ ....,
:;:..."'d tn
;l~~ !Z:"1>>-ZiO
Ul ::10
t-.:1 ..I..,
.>C..,"l>o.'.<..lv>t"":'' .ao.....-,. '>"'l
TOBACCO OFF 4 PERCENT
Sale s re co rd s indi c ate that Ge orgia's 198 5 tobac co c rop totaled 81.8 million pounds, down 4 perc ent from the 1984 crop. The c urrent estimate is 2 percent b e l ow t h e prev i ous f ore c ast. ~verage vi e l d f or 1985 is 2,210 pounds per acre, ~0 pounds l e ss t han the 1984 yield. Ac res harvested, at 37, 0 00 a c res, is off 1 p~r c enl f rom last year
SOYBEAN FORECAST STEADY
Georgia's soybean crop is again forecast
at 45.5 million bushels, 14 percent more
than was produced in 1984. Acres for
harvest are off 12 percent to 1.75
million acres, but yield per acre is
expected to average 6 bushels per acre
more than last year.
The current yield
forecast is 26 bushels per acre,
unchanged from the September 1 forecast
despite the unfavorable weather during
the month. There have been so many dry
Septembers in recent years that the
September 1 forecast model now assumes
adverse weather. Thus, there was no
change in the yield forecast despite the
deteriorating condition since
that
deterioration was present in the previous
forecast. Rains that fell shortly after
the first of October came too late to
help a portion of the double-cropped
soybeans, but part of the full-season
soybeans wil l have favorable yields.
IIAY YIELD UP, PRODUCTION DOWN
Haying was very active during the dry September weather. The open weather was near ideal for harvest of the new growth that was stimulated by those rainy conditions during August. The combination of both a good spring hay crop and a good fall crop has pushed the 1985 yield forecast to 2.5 tons per acre, .2 tons per acre above the previous forecast and .1 tons above last year's yield Total production should reach 1.3 million tons, off 2 percent. Harvested acres,at 520,000 acres, is off 5 percent from last year
1\
V'l
P11Gf0RG/A
F~~ARM REPORT
GFR-85-Volume 21
._::-_,.
13
LJU\iU lVI c.l~ &~
nA UB.. nRIE:
GEORGIA
~ CROP REPORTING SERVICE
Stephens Federal Bldg. Suite 320
Athens, Georgia 30613
Phone: (404) 546-2236
HIGHLIGHTS
Livestock Slaughter Cold Storage Milk Production
GEORGIA RED MEAT PRODUCTION
Monthly Poultry Cattle on Feed Peanut Stocks
U. S. RED MEAT PRODUCTION
Georgia red meat production totaled 32.0 million pounds during September 1985, up 1S pErcent from Septembe r 1984. The January-September red meat production totaled 300.2 million pounds, 7 percent less than the comparable period of 1984.
Commerci al red meat production for the United States in September 1985 totaled 3.25 billion pounds, up 5 percent from
September 1984. January-September red meat production, at 29.3 billion pounds was up 2 percent from last year.
Species
Geor,ia Caft e Calve& Hogs Sheep 6. Lambs
States
GEORGIA AND UNITED STATES LIVESTOCK SLAUGHTER 1/
Number Slaughtered --------:--Average
1985
Jan.-Sept. : Live Weight
Sept.
as % of '85 as % of : Sept.
1984
1985 1984
1984
:1984 1985
r~1JUlJ11eaa ----percent
Percent
Pounds
18.3
18.9
103
1.5
1
7
119.6 139.8
117
1
1
100
102
890
907
84
340
333
88
232
232
100
108
94
Total
Live Weight
Sept.
1984
1985
1,000 Pounds
16,317 513
27,735 10
17,178 44
32,448 8
3,324,142 70,975
1,676,982 55.839
Kind
COMMERCIAL RED MEAT AND LARD PRODUCTION: UNITED STATES WITH COMPARISONS 1/
~ept.
1~85 as 7. : Jan.-Sept. 2/
1~8) as 7.
1984
1985
of 1984
: 1984
1985
of 1984
MilliotCPoundil
Percent
Million Pounds
Percent
1, 904
1, 985
104
17,774
102
39
42
108
364
104
1,139 1 ,196
105
10,912
101
29
28
97
260
94
Red Meat 3,111
3,251
105
29,310
102
73
76
104
688
101
weights and ex-Cludes farm slaughter. 2TAcc-umu1ated totals
3/ Preliminary lard production includes rendered pork fat.
Agrico.l.tara1 Statistician and Georgia Depart:.ent of Agriculture
GFR- 85-Volume 21
GEORGIA MI LK PRODUCTION UP 3 PERCENT
Georgia dairy herds produced 106 mill i on pounds of milk dur i ng September 1985, up 3 percen t from both last year and l a s t aonth. The number of milk cows on Georgia's farms during September averaged 118,000 head, the same avera ge as a rear ago but 1 percent more than the prev ous month's count.
Production per cow averaged 900 pounds for September, 25 pound s more than last year and 20 pounds more than last mont h.
U. S . MILK PRODUCTI ON UP 11 PERCENT
Milk production during Se ptember 1985 t ot a led 12.0 billion pounds, a recor d high fo r September and 11 percent more t han September 1984.
Product i on per cow averaged 1,072 pounds dur i ng September, 76 pounds a bove Sept ember 1984.
The total n umber o f milR cows in herds aver aged 11.2 mi ll ion head during September, 3 percent above September a yea ~ ago.
MILK COWS AND MILK PRODUCTION. SEPTEMBER 1984- 1985
Ge o r gi a
Un i ted Stat e s
Item
I
Milk Cows 1/
Milk per Cow 2/
Milk Product ion 2/
Un i t
I
Thous . Head
Pounds
Mil. Lbs.
1984 118 87 5 103
198 5 118 900 106
Per c ent 100 103 103
: 1984 10, 825 996 10, 777
1985 11 , 154
1, 072 11, 960
Perc ent 103 108
Il l
1/ Incl udes dry cows , e x c lude s heife r s no t ye t fr e s h . 2 / Exc lude s mil k s ucked b y
calves.
. CATTLE ON FEED : NUMBER, PLACEMENTS, MARKETED AND OTHER DISAPPEARANCE . JU L. 1 TO OCT
I t em
- - - -- - - - - -- - - - - - - -
Total 13 States 1/
Number
I 198 5 a s r.
_l~~A __ I 1985 J of 1984
1 , 000 Head
Pe r c e n t
To tal 7 Stat es 2 /
Num b e r
J 198 5 as r.
1984 J 1985 I o f 1984
1 , 000 Head
Per cent
On Feed Jul. 1
8 ,700
8 ,660
100
Placed on Feed J u l. 1-
Sept. 30 3/
6 , 252
5 ,465
87
Fed Cattl e Mar keted
7 ,1 25
7 , 052
99
5 , 268
4,563
87
Jul. 1-Sept . 30 3/
5 ,684
5, 967
105
4 , 725
4,9 70
105
Other Di sappear ance
Jul. 1- Sept . 30 4/
268
24 4
91
On Feed Oct. 1
9~00 0
7,914
88
226
202
89
7. 442
6, 443
87
1/ AZ . ,CA . ,CO. , IL. ,I D.,LA. ,KS. , MN. ,NB., OK.,S.D . , TX. , WA. 2/ AZ ., CA . , CO.,I A. ,KS.,
NB.,TX. 3/ Inc lude s cattl e placed o n fee d a f ter be g i n ni ng o f q ua r t er a nd market e d
be fore e nd o f quarter. 4/ I nclude s dea t h lo s se s, moveme nt f rom feedlots t o pa stu r es
and shipments t o other feedlots for fur t her f eedi ng .
u. s.
Class
ept. 1985
u.. ~::: EGGS IN INCUBATORS, OCT. 1, 1985, U.S .
1
1 1984
1985 [
Farmers
Stock
172
Shelled
Peanuts 2/ 891
Roasting
70
2,256
813
663
Chickens Egg Type
Thousands 28,083 29,545 105
Stock
Broiler Type 308,356 320,469
104
Total 3 xc1uaes stocks on tarms. Includes
Turkeys
13,976 15,158 108
stocks owned br or held for account o f CCC in commercia storages. 2/ Includes shelled edible and shel led oil stock. 3/ Actual farmers stock, plus roasting stock, plus shelled peanuts X 1.33.
2
-
POULTRY HATCHING AND PLACEMENT--SEPTEMBER 198S
% of
/. of
Item
Sept. 1984
Aug.
Sept.
198S
1985
---------
- - T h o u s a n d. - -
year aRO
..!an_. _ thru Seot.
year
1984 I
198S - - --
- _11&0
--Thousands--
Pullet Chick Placed
Doaaeatic (U.S.) 1/
Broiler Type
3,078
3,16S
3,2S3
106
30,122
30,627
102
Egg Type
323
278
2S4
79
2,849
2,361
83
Chick Hatched
Broiler Type
Georgia
53,0~2
60,017
S5,867
105
505,376
533,437
106
United States
361,887 406,490 380,189
105 3,475,019 3,624,Sl3
104
Egg Type
Georgia
1,887
2,454
3,116 165
33,731
22,812
68
United States
33,113
32,169
33,458
101
369,918
305,259
83
Turkeys
Poult Placed
u. s.
8,732
15,378
10,759
123_ 2L_ ~ .]_]1_ ___U__IQ_.759
12 3
!/Reported by lea d ing bre ede rs, includes expected pullet r e placements f rom eggs so ld
during the preceding mon th at the rate of 125 pu llet c h icks p er 30 doz e n case of e g gs.
2/Turkey poul t s placed Sept. 1985.
NUMBER OF LAYERS AND EGG PRODUCTION. SEPTEMBER 198 5
No. Layer on
Total Eggs Produced
Hand-Sept.
Du r i n
1984
1985
198S
1984
1985
Thousands
Nu m b e r
Milli ons
Georaia
Hatchina
5,0S8
5,247
1,782
1 ,806
90
95
Other
13,831
12,327 2,052
2,022
28 4
249
Total Georgia
18,889
17,574 1,980
1,9S7
374
344
Total U.S.
279,050
275,042
2~014
2,018
5,6 19
5,549
COMMERCIAL POULTRY SLAUGHTER 1/. SEPTEMBER 198S
Ite Young Chickens
Sept. 1984
Aug.
Sept.
1985
198S _
-Thousands- - -
/. of year
-~o
Jan. t hru Sept.
1984 l
1985
- - -Thousands- - -
7. of year ago
Georgia United States Mature Chickens
43,586
60,022
53,110 122 398, 168
479,449 120
338,237
403,210
3S7,922
106 3,220,733 3,36 1, 875
104
Light Type U.S. Heavy Type U.S.
Total U.S. Total All Types, Ga. Percent Condemned
11,986 2,903
14,889 3,041
10. 106 2,875
12,981 2,029
9,382 2,748 12. 130 2,973
78 109,936
95
26,25 9
81
136,195
98
28,084
110,757
101
27,263
104
138,020 101
26,390
94
Young Chickens
Georgia
1.4
1. 6
2/1.4
3/NA
United States
1.4
1.6
2/1. ~
2/1.6
1/ Federally inspected slaugh.t~r data as collected by Meat and Poultry Inspect ion
Program. Current month data estimated by Market News Service. 2/ January-Sept.
condemnations. 3/ Not available. 3
Commod i t:t
COLD STORAGE STOCKS 1 Sept . 30,
1984
Butter Cheese , Natural Eggs, Frozen Fruits, Frozen Fruit Juices, Frozen Meats, Red
Beef, Frozen Pork, Frozen Poultry, Frozen Turkeys, Frozen Vegetables, Frozen
Potatoes, Frozen Pea nuts, Shelled Peanuts, In Shell
Pecans, Shelled Pecans In Shell
426,315 1,115,000
16,723 704,801 913,205 646,193 319,581 256,625 526,672 390,B8 2,030,721
635,332 113,053
6,513
26,790 40 316
UNITED STATES 1 Aug. 3 1 , 1985
1,000 Pounds 264,608 962,870 18,401 733,826
1,286,155 678,575 310,588 296,227 568,914 387,798
1,954, 127
735,4 19 344, 0 28
29,040
2 4,171 23 76 5
SEPTEMBER 30, Sep t. 30, 1985
246, 777 940,242
17,898 761,112 1,214,839 658 , 7 56 310, 186 279,340 627,359 445 , 684 2,237 ,537 864, 4 19 296, 929
20,388
20,535 13 297
1985
Perc ent of
Se2t . 1984 Aus.
Percent
58
93
84
98
107
97
108
104
133
94
102
97
97
100
109
94
119
110
114
115
110
1n
136
118
263
86
313
70
77
85
33
56
1985
t ~ e ~: ~~ ei~
-- u - o..._ 0 '- .C
0
.::~-<II~ ... - 0. ..
~ ~ ~~R!~ !~
";" P' -; . "' c ;: ! ~,., l
- o~w""o ... .o ... ~~ ~ ~-;:S! e<
9 '8 >-u a. v- v
z ! u... t ~ L: -o ~> O
~ ... Jt ~3 ~ ~ 0~ ~.
:: ,....; -g ~c"' ...
... &J ~..; V"' V\;! 0 ~ ~
,, . Hii..l '&-:;.:.~II~- ~"'. ~~;: ;: ~- ~
e
~
ii
..!..
'v
):
c 3
u 1 C
I
.~ -~1'e1:~~
/'Q- - c
~~ ~; b ! ~c:~=
<e oltVl c C ... CIQt...:J(!
-E'2;[
~-<
~~ ...
~-~u
~ -
~"";:~~~ ~ -;: .~;
.. Hi- I
- L.
-
> v ':J'I t...
[:-:~.;~_.~..:i- :V1
~
a.
8.\l"t
l'
"""'""
CA>orgta
Crop
Reportmg Service
Stephens Federal Bldg.
Suite 320 Athens, Georgia J061 3
SECOND- CLAS S POSTAGE PAID AT ATHENS, GA 306 13
- F .. 1 1 ...C'J
I
)
~- R..,
, :> - 25 7_ 0 )
)
Q
-O~U1E'H .;;:: r L
HE
G
A y
3 6
1.) 'II
ci~fORGJA
'Fl.>.<Sf. .::<~
FARM REPORT
November 14, 1985 GFR-85- Volume 22
R~
NOV 1 81985
DOCUMENTS UGA ' I
GEORGIA
~ CROP REPORTING SERVICE
stephens Federal Bldg. Suite 320 Athens, Georgia 30613 Phone : ( 404) 546-2236
HIGHLIGHTS: November 1 Crop Forecast Agricultural Prices Peanuts by States U.S. Upland Cotton Supply & Use C:rain Stocks Release Dates for 1986 Survey Announcement
YIELD FORECASTS UNCHANGED
Surveys conducted about November indicated no c hange in yield forecasts for corn, cotton, peanuts, soybeans, and tobacco. Harvesting progress advanced rapidly during the second and third weeks of October but was delayed during the first and last weeks by rain. The level of progress was near normal on November 1 except for soybean harvest and small grain plantings which ~ere well below normal.
(Continued on page 2)
GEORGIA ACREAGE AN D PROO UCTION. 1984 AND 1985
Acrea~ e
Yield per Acre
Production
Tnd i -
Indi-
Crop
Unit
Har -
For
cat ed
c ated
vested Harves t
:-lov. 1,
Nov. l,
--- -
- -- - -- - -
-- - -
1984 11 1985 1/ --Thousand Ac res--
1984 1985
1984
1985
--Thousands--
Corn
Bu.
98 5
1,000
82.0 80 .0
80,770
80,000
Cotton 2/
Bales
172
260
784
720
281
390
Soybeans
Bu.
2,000
1,750
20. 0
26. 0
40 , 000
45 ,500
Peanuts
Lbs.
640
595
3 , 37 5 3, 300 2,160,000
1,963,500
Tobacco, Type 14 Lbs.
38
37
2,250 2,210
85,500
81,770
Sweet potatoes 3/ Cwt.
6.4
6.3
Hay, All 3/
Tons
S5o
520
140 2.40
160 2.50
896 1,320
1,008 1,300
Pecans 3/
Lbs.
120,000
105,000
Apples, All
Commercial 3/
Lbs.
50,000
35,000
Peaches 3/
Lbs.
150,000
80,000
Grapes 3/
Tons
2 .7
2.9
Wheat 3/
Bu.
890
825
35.0
30.0
31,150
24,750
Oats 3/
Bu.
60
50
55.0
40.0
3,300
2,000
Rye 3/
Bu.
80
100
22.0
21.0
1,760
2,100
Sorghum 3/
Bu.
113
140
42.0
43 .0
4,746
6_.020
1/ Harvested for principal use. 2/ Cotton yield in pounds and production in bales.
3/ Estimates brought forward from earlier surveys.
Agrleu1tural Sbltisticiaa and Georgia Depa.rt.enl: of qriculture
COTTON UP 19 PERCE:-JT
Georgia's 1985 cotton production is forecast at 390,000 bales, up 39 percent from last year. All of the increase is due to an increase in harvested acres which is up 51 percent to a total of 260,000 acres. The November 1 yield forecast, at a very respectable 720 pounds per acre, is off 64 ~ounds per acre from last year's record yield. Approximately two-thirds of the crop was picked by November 1.
CORN YIELD DOWN 2 BUSHELS
The State's corn yield forecast at 80 bushels per acre was unchanged from last month's estimate. Current yield forecast is 2 bushels per acre below last year and 5 bushels below the State record. Total production at 80. 0 million bushels is down 1 percent from last yea r. Only 2 percent of the crop remained to be harvested on November 1.
TOBACCO OFF 4 PERCENT
The 1985 tobacco crop at 81.8 million _pounds is down 4 percent from last year. Yield, at 2,210 pounds per acre, was 40 pounds per acre lighter than the 1984 yie ld. Acres ha rvested~ at 37,000, were
GFR-85-Vol. 22
1,000 acres, or 3 percent, lower than last year. Quality of the 1985 crop was generally favorable.
SOYBEAN FORECAST UNCHANGED
...
Georgia's soybean pre.ucWion .~as . aga~n forecast at 45.5 million bushels~ up 14
percent from last year despite a 12
percent reduction in acres for harvest:
An average yield of 26 bushels per acre
is forecast from this year's harvest.
The yield forecast is unchanged from last
month's forecast, but is 6 bushels per
acre above last year's yield. Harvesting
progress on November 1 was about 29
percent complete, well below the 44
percent average completion for that date.
PEANUT CROP DOWN
Georgia's 1985 peanut production forecast
at 1.96 billion pounds,
remained
unchanged from the October e sti ma te but
is expected to be down 9 percent from
last year 's output. The yield forecast
remained at 3 , 300 pounds per acre. That
yield is 75 pounds per acre l ess than the
record yield set just last year but is
st ill the second best o f record.
Harvesting progr ess on November 1 was
approximate ly 98 percent complete.
State
1 ,uuu Acres
ounrls
---- - -r,lJOO- Pounds
Ala.
219.0
204.0
2,960
3,050
6 48,550
622,200
Fla.
7 7.0
74.0
3,200
1,100
246,400
229,400
Ga.
640.0
595.0
3,37 5
3,300
2, 160 ,000
1,963,500
N . ~ex. 2/
i4.5
13.0
2,220
2,300
32,190
29,900
N.C.
155.0
155.0
2,900
2,950
449,500
457,250
Okla.
s. c.
91.0 14.5
86.0 12.0
2,077 2,700
2,200 2,850
189,000 39,150
189,200 34,200
Tex.
223.0
220.0
1,665
1,900
371,295
41 8,000
Va.
u.s.
97.0 1,531.0
96.0 i,455.0
2,780 2,878
2,900 2, 902
269,660 4,405,745
278,400 4 ,222,050
1/ Estimates comprised of quota and non-quota peanuts. 2/ Estimates for current year
carried forward from earlier forecast.
The Georglo Form Report ( ISSN-0744-7280) Is published sem i-month ly by the Georgi" Crop Reporti ng Serv ice, Stephens Federo l Bul Iding, Athens, Ga. 30613, Larry E. Snipes, St,tlstlclon In Charge. Second class postl!ge paid at Athens, GA. Subscription tee S10 per ye"r except free to d"t" contributors. Subscription Information l!Vallable from: Georgia Crop Reporting Service, Stephens Federol Bul l1i ng, Suite 320, Athens, GA. 30613 Telephone: (404 ) 546-2 236.
2
U.S. HIGHLIGHTS, NOVEMBER 1, 1985
Corn for grain production is forecast at a record hi~h 8.72 billion bushels, up 14 percent from last year and 6 percent more than the previous record set in 1982. The forecast is up over 1 percent from the October 1 forecast.
Sorghum grain production is forecast at a record high 1.13 billion bushels, down slightly from the October 1 forecast but 30 percent above last year's crop.
Feed grain production (corn, sorghum, oats and barley) is expected to total 271 million metric tons, up 15 pe rcent from 1984 and nearly double the 1983 output.
Soybean production is forecast at 2.13 billion bushels, 1 percent more than the October 1 forecast and 14 percent above 1984.
All cotton production is forecast at 13.9 million bales, 2 percent above October 1 and 7 percent above the 1984 crop.
Peanut production is expected to total 4.22 billion pounds, 1 percent below the October 1 forecast and down 4 percent from the record high crop set in 1984.
All tobacco production is expected to total 1.53 billion pounds, virtually the same as the October 1 forecast but down 12 percent from last year's production.
UNITED STATES ACREAGE AND PRODUCTION. 1984 AND 1985
Crop_ -
Unit
Area Harvested
Indi-
1984
I cated 1985 --
1,000 Ac res
I
I
I Yield per Acre Indicated
1984
1985
Produc t i on
Indicated
Nov. 1 ,
1984
1985
Thousands
Corn for Grain
Bu.
71,816
74,756
106.6
116.6
7 , 656,195
8,716,53 4
Sorghum for Grain Bu.
15,348
16, Ill!
56.4
69.6
865,856
1,126,856
All Wheat 11
Bu.
66.928
64,588
38.8
37.4
2,59 5 ,479
2,418,818
Soybeans for Beans Bu.
66. 113
62,223
28. I
34.2
1,860 , 8 63
2,129,0 3 4
Peanuts for Nuts
Lbs. 1,531.0
1,455.0
2,878
2,902
4 ,40 5,745
4,222,050
Upland Cotton 1121 Bales 10,299.5
10,257.6
599
642
12 ,851.4
13,727.4
Cottonseed
Tons
5. 149
5,509
All Hay 11
Tons
61,585
61,801
2.45
2.45
150,781
151,220
Sweet potatoes 1I
Cwt.
10 3.5
105.9
125
134
12,986
14,230
Tobac c o
Lbs.
7 91.6
697.6
2, 182
2,188
1,727,306
1,526,345
Apples, Com'l 11 Lbs.
8,285,500
8,11 4 ,500
Peaches 11
Lbs.
2,643,800
2,108,500
Grapes 11
Tons
5 ,163. 9
5,410.4
Pe cans I I
Lhs.
232,400
262,700
Oats 11
Bu.
8. 123
8,7 50
58 .I
61.4
471.921
537,443
Rye 11
Bu.
981
67 7
33.0
28.5
32 , 392
19,298
Almonds (Cal if.) 1I Lbs.
587,000
495,000
Walnuts (Cali f.) 1I Tons
213.0
215.0
11 Estimates carried forward f rom earlier forecast. 21 Yield in pounds.
3
GEORGIA PRICES RECEIVED
The Georgia Prices Received All Commod i t y Index for October was 115 percent of t he 1977 average, 6 points be l ow September 1985 and October 1984. Average prices received by Georgia farmers at midOctober coapared with September were mostly down. Lower prices for wheat, corn, cottonseed, tobacco, soybeans, peanuts, sweetpotatoes, cows, broilers, and eggs were partially offset by higher prices for cotton, hogs, steers and heifers, calves, other chickens, and milk.
GFR-8S-Vol. 22
U.S. PRICES RECE I VED INDEX UP 2 POI NTS
The Octobe r Index of Prices Recei ved by Farmer s for All Far m Produc ts i ncreased 2 poin ts from Sept ember to 123 percent of its January-December 1977 average. Higher prices for cattle, hogs, milk, turkeys, and cotton were partially offset by lower prices for broilers, corn, grapefruit, and soybeans. The index was 15 points below a year ago.
PRICES RECEIVED BY FARMERS. OCTOBER 15. 1985 WI TH COMPARI SONS
Commo dity_
Pr i ce per Un it
Oc t . 1984
Geo r g ia
T Sept . T 1985
Oc t . 15 , 1985
I I Un i ted States
Oct.
Sept. Oct. 15,
198 4
1985
1985
Winter Wheat
$/Bu.
3 .11
2.67
2.64
3.38
2. 89
2.90
Oats
$/Bu.
1. 74
1. 10
1.08
Cor n
S/Bu .
2.8 3
2.26
2. 17
2. 65
2.28
2. 16
Cotton
Ct. /Lb .
6 4.5
55.0
1/56 .0
64.4
55 .0
1/5 6 .6
Cottonseed 2/
$/ Ton
98 . 50
85. 00
54 .00
106 .00
66 .00
52.00
Tobacc o
Ct./Lb. 17 8.1
180.0 3/1 68 . 0
184 .2
178.5 3/1 79 . 5
Soybeans
S/Bu.
6. 16
5. 09
4.86
6 .07
4. 99
4. 83
Peanuts
Ct./L b.
22 .5
22 .3
1/ 20.5
24.5
22.3
22. 4
Sweetpot a t oes
S/Cwt.
13 . 00 2 /10.00
9 .20
10 . 70
2 /8 .73
7 .5 1
All Ha y, bal ed 2/
$/Ton
71.90
67. 10
66.00
Milk Cows, 4/ 5 /
$/ He a d
895 . 00
840.00
890.00
8 15.00
Hog s
$/Cwt.
41.50
40 . 80
42 . 70
43 .60
39. 70
43 . 20
Sows
S/ Cwt.
37 .40
34. 10
35 .40
38.60
34 .10
35.70
Barrows & Gil t s
S/Cwt.
42.40
4 1 . 20
43. 30
44 .30
40 .30
44 . 00
Beef Cattle 6 /
S/Cwt .
39. 40
39 .30
39 .30
54.10
49.10
52 .80
Cows 7/
S/Cwt .
3 4.5 0
34 .60
33. 00
35. 10
34. 10
33.40
Steers & Hei f ers S/Cwt .
47 . 40
45.30
47 . 60
59.20
52.20
56.90
Cal ves
S/Cwt.
47.90
51. 50
~2. 10
58 . 20
58.30
59.70
All Mi lk
S / Cwt .
14. 90
13. 10
3/13.20
14 .00
12.30 3/12.50
Turkeys 2/
Ct./ Lb.
51.3
51.8
57 .0
Chickens, Excluding
Broi lers
Ct./Lb.
18 . 0 2/24.0
25.0
Com'l Broi lers 8/ Ct. /Lb.
27. 0
29 . 5
3/26 .0
28.7
31.6
3/27.7
Eggs, All 9/
Ct./Doz
67.5
2/73.4
73.1
55.6 2/62.2
63.5
Table
Ct./Doz
49.2
2/55.3
54.9
47.9 2/5 5 . 5
57 . 1
Hatching
Ct./Doz. 130 . 0 2/125. 0
125.0
1/ First half of month. 2/ Mid- month pr ice. 3/ Entire month. 4/ An i mals sold f or d ai ry
herd replacement only. 5/ Pri c es est i mated quarterly. 6/ "Cows" and "steers and heifers"
combined with allowance where necessary for slaughter bulls. 7/ I ncludes dairy cows sol d
for slaughter. 8/ Liveweight equivalent price for Georg i a. 9/ Av erage of all eggs sold
by farmers including hatching eggs sold at retail.
4
U.S. PRICES PAID INDEX UNCHANG ED
The Index of Prices Paid by Farmers f or Commodities and Services, Interest, Taxes, and Farm Wage Rates for October was 162 percent of its 1977 average. This was unchanged from a month earl ier but 1 point lower than in October 1984. A decrease in the feed component from a month ago and the normal seasonal decline in the fertilizer component were offset by increases in the feeder livestock and family living components.
CONSUMER PRICE INDEX
The September unadjusted consumer price index for all urban consumers (CPI-U) increased 0.3 percent from August to 324.5 (1967 100). The index was 3.2
percent above September 1984.
On a
seasonally adjusted basis the CPI-U was
0.2 percent above Augus t . The i ndex at
the end of the third quarter confirmed a
declining trend of price i ncreases with
first quarter increasing at a 4.1 percent
annual rate,
the second
quarter
increasing at a 3.3 percent annual rate
and the third quarter increasing at a 2.3
percent annual rate. The transportation
index declined 0.2 percent from August.
Increases of 0.5 percent were registered
for the apparel and upkeep index, medical
care index, and entertainment index. The
food and beverages index was up 0.3
percent. The housing index and the other
goods and services index were 0.2 percent
higher.
PRICES PAID BY FARMERS. OCTOBER 15. 1985 WITH COMPARISONS
Commodity
Price per Un it
Geor11.ia
I Oct. 15, Sept. 15,, Oct. 15,
1984
1985
1985
IUnited States
Oct. 15, Sept. 15,, Oct. 15,
1984
1985
1985
Dairy Feed 16%
S/Ton 175.00
160 .00
166.00
179.00
163 .00
162.00
Dairy Feed 18%
S/Ton 178.00
162.00
168.00
185.00
163.00
165.00
Dairy Conct. 324
$/Ton 210.00
16 7.00
172.00
246.00
220.00
226 .00
Hog Feed 14%-187.
S/Cwt.
10 .80
10 .00
9.80
10 : 20
9.13
9. 12
Hog Conct. 387.-427.
S/Cwt.
14.00
12.00
13.00
13.50
12 . 10
12.40
Beef Cattle Conct. 327.- 3 6%
S/Cwt.
13 .00
11.00
11.00
11. so
10.10
10.10
Cottonseed Meal 417. S/Cwt.
13.50
11. 00
11 . 00
14.20
10. 80
10.70
Soybean Meal 44%
S/Cwt.
12.50
11.50
12.00
11. 80
10. 00
10 . 30
Bran
S/Cwt.
11.00
11 .00
11.00
10.00
9 .35
9. 24
Middlings
S/Cwt .
11.00
10.50
9.90
9.46
8 . 53
8.45
Corn Meal
S/Cwt.
9.60
8.30
8.30
8. 15
7. 13
6.94
Broile r Grower
$/Ton 250.00
187.00
182.00
221.00
189.00
181.00
Laying Feed
$/Ton 185.00
156.00
156.00
194.00
177.00
175.00
Chick Starter
S/Ton 225.00
178. 00
177.00
22 0. 00
191 . 00
187.00
Broiler-Feed Ratio 1/ Lbs.
2.2
3.2
2.9
2.6
3.3
3. 1
Hog-Corn Ratio 2/
Bu .
14.7
18.1
19.7
16. 5*
17.4*
20.0
Milk-Feed Ratio 3/ Lbs.
1. 70
1. 64
1. 59
1. 56
1. 51
1. 54
Egg-Feed Ratio 4/
Lbs.
7.3
9.4
9.4
5 .7*
7.0*
7 .3
1/ Pounds of broiler grower equal in value to 1 lb. broiler live weig ~ t . 2/ Bushels o f corn
equal in value to 100 lbs. of hog live weight. 3/ Pounds of 16% dairy feed equal in value t o
1 lb. whole milk. 4/ Pounds of laying feed equal in value to 1 doz. eggs. * Revised.
l977roo
-rn n
--n
INDEX NUMBERS--GEORGIA AND UNITED STATES
Sept. 1984
I Oct. 1984 I Sept. 1985
I
Oct. 1985
Georgia
Prices Received
All Commodities
129
121
121*
115
Crops
132
123
117*
110
Livestock & Products United States
127
119
124*
1 19
Prices Received
138
138
121*
123
Prices Paid 1/
164
163
162
162
Ratio 2/
84
85
75*
76
R~v1sed. l/M1d-month index 1ncluding 1nterest, taxes and farm wage rates. 2/ Rat1o
of Index of Prices Received to Index of Prices Paid, Interest, Taxes and Farm Wage
Rates.
5
GEORGIA ~!EAT STOCKS UP 57 PERCENT
Stocks of wheat stored in all positions on October 1, 1985, in Georgia totaled 11,011,000 bushels, 57 percent more than a year ago. Wheat stored on farms totaled 4,950,000 bushels, up 22 percent while off-farm stocks amounted to 6,061,000 bushels, 103 percent more than last year.
GFR-8s...:vol. 22
Old crop corn stored in all positions totaled 4,646,000 bushels, 62 percent more than a year ago. Old corn stored on farms totaled 4,039,000 bushels, up 47 percent and off-farm stocks, at 607,000 bushels were 452 percent above last year. Old crop sorghum in all positions totaled 190,000 bushels, up 37 percent. Oats in all positions at 1,175,000 bushels were down .45 percent.
GEORGIA GRAIN
1985 WITH COMPARISONS
On Farms
Farms 1/
All Positions
Grain
1984
1985
1984
1985
1984
1985
-1,000 Bushels -
Corn, Old Crop
2,756
4,039
110
607
2,866
4,646
Oats
1 815
880
309
295
2,124
1. 17 5
Barley Wheat
*
4,050
*
4,950
60 2,983
148 6 , 061
60 7,033
148 11,011
Sorghum, Old Crop 139
190
*
*
139
190
1/ Includes stocks at mills, elevators, warehouses, terminals and processors.
* Included in unallocated to avoid disclosing individual operations.
U.S. FEED GRAINS AND WHEAT ABOVE LAST YEAR
Old crop corn in all positions on October 1, 1985 totaled 1.38 billion bushels, 91 percent more than on October 1 a year ago but 56 percent below the record high stocks on October 1,1983.
Old crop sorghum i n all positions totaled 271 million bushels, up 8 percent from October 1 a year earlier.
Barley stored in all positions t otaled 654 million bushels, 14 percent more than on October 1 a year earlier and 27 percent more than on October 1, 1983.
All wheat stored in all positions on October 1, 1985 totaled 2.93 billion bushels, 7 percent more than the 2.74 billion bushels on hand October 1, 1984, but 1 percent less than the October 1, 1983 stocks.
Oats stored in all positions totaled 532 million bushels, up 12 percent from October 1, 1984.
U.S. GRAIN STOCKS--OCTOBER
1985 WITH COMPARISONS
On Farms
Off Farms 1/
All Positions
Grain
1984
1985
1984
1985
1984
1985
- Million Bushels
Corn, Old Crop
347.9
677.4
375.4
701.9
723.2 1,379. 3
Oats
397.4
438. 1
76.5
94.2
473.9
532. 3
Barley
402.1
463.4
171.5
190.7
373.6
634. 1
Wheat
1,217.3 1,212.5
1,522.7 1,722.3
2,740 .0 2,934.8
~orghum, Old Crop
37.9
45.9
212 .8
225.1
250.8
271.0
1/ Includes stocks at mills, elevators, warehouses, terminals and processors.
6
USDA ANNOUNCES RELEASE DATES FOR 1986 CROP REPORTING BOARD REPORTS
The u.s. Depart.ent of Agriculture's Statisticial Reporting Service will issue its ..jor
Crop Reporting Board reports on the following dates i~ 1986, according to Agency Adinistrator, Willia E. Kibler.
Crop Production (Monthly)
.Jan. 10, Feb. 10, Mar. 10, Apr. 10, May 9, .June 10, .July 11, Aug. 12, Sept. 11, Oct 10, Nov. 10, Dec. 10
s-11 Grains (Annual Su. . .ry)
.Jan. 10
Crop Production (Annual Su..ary)
Feb. 10
Grain Stocks
Feb. 10, Apr. 29, .June 27, Sept. 29, Oct. 30
Cattle Inventory
Feb. 10, .July 25
Prospective Plantings
Feb. 18
Hogs and Pigs
Mar. 21, .June 23, Sept. 22, Dec. 22
Cattle on Feed
.Jan 24, Feb. 14, Mar 15, Apr. 25, May 15, .June 16, .July 25, Aug. 15, Sept. 15, Oct. 24, Nov. 14, Dec. 15
The Crop Reporting Board calendar and a catalog covering al l releases scheduled for 1986 will be available free in early December. For copies, write Crop Reporting Board Publications, Roo 5829 South, USDA , Washington, D.C. 20250, o r telephone (202)447-4021. A free copy can also be obtained from the Georgia Crop Reporting Service, Stephens Federal Building, Suite 320, Athens, Ga. 30613. Telephone (404)546-2236.
-
Year Beginning
Au~ust i
UNITED STATES llPLAND COTTON SUPPLY AND CSE. 1970/71 - 85/86
Sup~'lv
Disappearance
3egin-
Produc-
:-fill
Cnac -
nin~
tion
Imports Total lise
Ex ports To t al co unted Ending
Stocks
2/
3/
4/
Stoc ks
1 I
~
- .. .. ?,~ht Ba es - - - - -
1970
5,727
10,135
11
15,873 8,105 3,885 11,990
251
4, 134
1971
4,134
10,379
42
14,555 8,163 3,376 11, 539
166
3,182
1972
3,182
13,608
23
16,813 7,670 5,306 12 , 976
316
4,153
1973
4,153
12,896
27
17,076 7,384 6,111 13, 495
172
3,753
1974
3,753
11,450
24
15,227 5,797 3,914 9,711
133
5,649
1975
1,649
8,247
36
13,932 7,160 3 , 300 10, 460
143
3,615
1976
3,615
10,51 7
19
14,151 6,595 4,779 11,374
102
2,879
i 977
2,879
14,277
1
17,157 6,416 5,459 11,875
(4)
5,278
1978
5,278
10,762
2
16,042 6,286 6,150 12,436
299
3,905
1979
3,905
14,531
4
1A,438 6,440 9,177 15,617
141
2,962
1980
2,962
11,018
26
14,006 5,828 5,893 11,721
329
2,614
\ 981
2,614
15,566
18
18,198 5,216 6,555 11,771
140
6,567
t982
6,56 7
11,864
12
18,443 5,458 5,194 10,652
53
7,844
i 983
7,844
7,677
8
15,529 5 ,859 6,750 12,609 (209)
2,711
1984 5/
2,711
12,851
21
15,583 5,317 6,160 11,477
44
4,150
1985 6/
4,152
13,637
10
17,797 5,150 3,910
9,060
63
8,800
1/ Compiled from Bureau of the Census data and adjusted to an August 1, 480-Ib. net weight
basis. Excludes preseason ginnings. 2/ Inc ludes preseason ginnings. 3/ Adjusted to
August 1-July 31 market1ng year. 4/ Difference between ending stocks based on Census data
and precedinp, season's supply less disappearance. Numbers in parenthesis are negative.
5/ Estimated. 6/ Forecas~ .
7
9>'-!~;;"l~" {;'~00~
-"'..~., a;
g ~Q0-
~"TI
II
:<f~:
0
0
00!1!
;:;0 "0
II
. - ~ ~
CJQ
......
.a0.....-.,.
a:CJ:I
<!"
.......
GFR-85-Vol. 22
~
_..
...._
:>-o '"OCil
~g~
!:'l>-10
~~~
t>1 I
;n:C"l
~
..., "H'cCr/.l
o>
.a......-,.>-!
I SURVEY ANNOUNCEMENT
The Georgia Crop Reporting Service will contact thousands of Georgia farmers during November through mid-January to obta in end-of-year data on crops and livestock. Several major surveys will be conducted to obtain individual farm information on acreage and production for 1985 crops, 1986 wheat and rye seedings, hog and cattle inventory numbers, the size of the current pig and calf crops and the number of milk cows and milk production.
Farmers wil l be contacted either by mail, telephone or personal interview. If you are asked to participate in one of these surveys, your cooperation in completing the questionnaire will be greatly appreciated. As with all of our surveys, individual data will be held in confidence and only used in developing county, State and National estimates.
The estimates obtained from these surveys will provide unbiased information to farmers to aid in making their 1986 production plans. State and National estimates will be included in future issues of the "Georgia Farm Report".
8
&rA
1~~27RGIA
FARM REPORT
PI
~~~.e~c 3, 1983 GFR-85-Volume 23
ReNe<i
c 0 51985
DOCIJ ~~ J:" ?3
'
-~
GEORGIA - -~CROREPPORTING
SERVICE
Stephens Federal Bldg. Suite 320 Athens, Georgia 30613 Phone: (404) 546-2236
HIGHLIGHTS: Poultry Summary Cold Storage Cattle on Fe e d Milk Product ion
Fa r m Labor Fer ti lizer Co ns umption Livestock Slaughte r Peanut Stocks
FARM LABOR PAY RATE UP; NUMBER OF WORKERS DOWN
During the survey week of Octobe r 6-t2, 1985, h i red farm wo rke rs in the s outhe ast reg i on (Ala., Ga., S .C.) we r e paid an average hourly wage of $3.68. Thi s r a te is u p 20 cents f rom the c or responding week i n July 1985, when t he Geor g ia Crop Report i ng Servi ce l a s t c onduc t e d the Farm Labor Survey.
The numbe r o f a ll f a rm workers em ploy e d in the southea s t r e g i o n d r o pped 30 pe r cent, from 184,00 0 wo r kers du r ing the Jul y s urvey to 129, 000 worker s f or October. Of a ll f a rm workers, h ire d
workers expected to work 149 davs or less duri ng the year accounted for most of the dec l ine. There were 59,000 par t t ime workers i n July, compa r e d with 22,000 par t time workers dur ing the October survey.
Hire d wo rkers ave r age d 33 . 6 hours worked d u r ing the su r vey week , down 2 percen t f r o m the 3 4.2 hours worked i n July . Sel f - em p loyed fa r m oper ato rs worked a n ave r age 38 . 0 hour s for t he week, down 8 perc ent f r om J u l y. Un pa i d wo r k er s put in an a verage 3 1 . 9 hours, also down 8 pe r cent from the previous survey.
FARM WAGE
State and
: Fi eld
Li ve-
supe r-
Reg i on 2/
:
Stoc k
visory
- - - - Dollar s per Hour - - - -
Southeast
3 .37
3 . 86
5.33
3.72
3 .54
Florida
4. 27
4.56
8.22
5. 79
4. 57
Appalachi an I
4.17
4 . 15
7.80
4 .16
4 .06
Appalachian II
3.99
3. 88
3/
4 .00
3. 92
Delta
3.76
4 . 46
5.7 1
3.60
3.86
Northeast I
4 .15
3.76
6.32
4. 22
4. 13
Northeas t I I
4.37
3.8 1
6 . 78
4.65
4. 40
Lake
3.99
3.84
6.03
4.7 7
4.2 4
Cornbelt I
4.24
4.6 1
6 . 69
4.16
4.61
Corn belt II
4.58
3.9 5
3/
4.23
4.40
Northern Plains
4.63
4.60
3/
4.43
4.62
Southern Plains
4.20
4.43
6.84
4.74
4.48
Mountain I
3.88
3.56
5.55
4.28
4.09
Mountain II
4.32
4.40
6.26
3/
4.61
Mountain II I
4.90
4.44
6.53
4.57
4,59
Pacific
4 .88
5.49
6.56
5. 18
4.83
California
5. 16
5.60
7.94
5.82
4.86
Hu.asw.ai(i49 States)
6.68 4.47
3/ 4.24
11.22 7.07
3/ 4.51
7.01 4.41
1/ 2/ 3/ See footnotes on page 2.
3/ 4.73
3/ 5 .51
3/ 5.29 4 .25 4.64
4.48 3/ 3/ 3/ 3/ 3/ 3/
5.37 6.66
3/ 5. 51
Agricultural Statistician and Georgh Depart:.ent of Agric;:ulture
3.77 6.87 4 . 96 4.04
3 . 88 3.98 4.30 4.08 4.13 4.16 4.50 5.03 3.94 4.65 5.09 5.34
7. 10 3/
4.62
GFR-83-Vol . 23
WORKERS ON FARMS BY STATE. REGION AND UNITED
State and
Re2ion 2/
All
I I Farm Workers
p y
I
I~ 6
----- thousands ---
Southeast
129
~5
Florida
54
10
Appalachian I
158
76
Appalachian II
163
87
Delta
166
72
Northeast I
137
51
Northeast II
120
48
Lake
415
198
Cornbelt I
313
160
Cornbelt II
235
147
Northern Plains
266
154
Southern Plains
243
142
Mountain I
71
34
Mountain II
66
30
Mountain III
47
12
Pacific
102
36
California
257
48
Hawaii
14
2
19 - ~...
3 ~ 1-'
18
.:.;$.
37
30
25
29
118
75
48
69
39
10
16
17
12
13
1
~5
41 64 39 64 61 43 99 78 40
43 62 27 20 18 54
196
11
33
3.t
38 14
39 38 35 53 44 24
28 44
15 17 14 21 116 10
22
7
;,j
26
25
25
23
8
46
34
16
15
18
12
3
4
33
80
1
U.S. (49 States)
2,95~
1,362
579
1,015
617
398
tate and Re2ion 2/
HOURS WORKED PER WEEK AND WAGE RATES FOR ALL HIRED WORKERS, BY STATES AND REGIONS. OCTOBER 6-12. 1985 1/
Wage Rates for Hired Workers ars per Hour
So utheast F! orida Appalachi an I Appalachian II Delta Northeast I Northeast II
Lake Cornbelt I Cornbelt II
Northern Plains Southern Plains Mountain I Mountain II Mountain III Pacifi c California Hawaii
38.0 43.8 32.5 36.2 37.3 58.3
55.7 54.6 50.9 44.5
48.4
33.3 49.9 45.1 37.7
38.8 36.3 27.5
31.9 33.7 28.6 31 . 3 29.4 41.2 39.7 34.5 36.4 39.4
38.4 30.0 48.4 41.4
30.0 39.4 31.2 27.5
33.6 36.8 31. 5 28.8 49.0 40.1
45.5
35.9 41.3 34.8
36.8
38.0 49 . 0 43 . 8 40.3 42.3
40 . 9 38.9
3.68 5.05
4.35 4.04 3.86 4. 16
4.35 4 .22 4.44 4.35
4.58 4.71 4 .03 4.59 4.78
5.06 5.51 7.46
U.S. (49 States)
47.9
38.6
38.6
4.56
1/ Excludes agricultural service workers. 2/ Regions consist of the following:
Southeast, AL,GA,SC; Appalachian I-NC,VA; Appalachian II-KY,TN,WV; Delta-AR,LA,MS;
Northeast I-CT,ME,MA,NH,NY,RI,VT; Northeast II-DE,MD,NJ,PA; Lake-MI,MN,WI; Cornbelt I-
IL,IN,OH; Cornbelt II-IA,MO ; Northern Plains-KS,NE,ND,SD; Southern Plains-OK, TX;
Mountain I-ID,MT,WY; Mountain II-CO,NV,UT; Mountain III-AZ,NM; Pacific-OR , WA.
3/ Insufficient data for this category. Data included in all hired farm workers and
in region and U.S. wage rates.
The Georgia Farm Report ( ISSN-0744-7280) Is published semi-monthly by the Georgia Crop Reporting 5er ice, Stephens Federal Building, Athe ns, Ga. 30613, Larry E. Snipes, Stat isti c ian In Charge. ~ond class post8ge pa id at Athens, GA. Subsc r iption tee SIO per year except tree to data CDntrlbutors. Subscription Inf ormation available from: Geor~la Crop Repor ting Service, Stephens Federa l Build i ng, Suite 320 , Athe ns, GA. 30613 Telephone : (404) 546-2236 .
2
CATTLE ON FEED IN 7 STATES DOWN 8 PERCENT Placements o f c a t t l e and c alve s on fe ed
in the 7 s t ates duri ng October t otaled
Ca t t l e and ,c a lves o n f eed November 1 f o r
2.78 million , up 9 perc ent f r om l ast yea r
t he slaughter ma rke t i n the 7 states and 13 percent a bove Oc t o be r 1983. This
pr epa r ing mo n th l y es t i mates t otaled 7.56
is the highest Oc t ober plac emen t t ota l
mi ll i on head , down 8 perc ent from a year
since 1978.
Ne t pl ac emen t s of 2 . 6 9
ago a nd 2 percen t below November 1, 1983 .
mi ll ion for Oc t ober were 11 p e r c ent a bove
last year and 14 perc ent above October
Ma rketings of fed c a ttle during October
1983 .
totaled 1.57 million, 5 percent below
last year and 3 percent less than October Other disappearance totaled 85 thousand
two years ago.
head, compared with 110 thousand during
October 1984.
CATTLE AND CALVES : NUMBER ON FEED, PLACEMENTS, MARKETED, AND OTHER DISAPPEARANCE,
7 STATES, OCTOBER 1 TO NOVEMBER 1
1985 as /.
Item
1984
1985
of 1984
1,000 Head
On Feed, October 1 1/
7,442
6,443
87
Placed on Feed during October
2,546
2,779
109
Fed Cattle Marketed during Oc tober
1 , 657
1,573
95
Other Disappearance during October 2/
110
85
On Feed November 1 1/
8,221
7,564
92
1/ Cattle and calves on feed are animals for slaughter market being fed a full
ration of grain or other concentrates and are expected to produce a carcass that
will grade good or better. 2/ Includes death losses, movement from feedlots to
pastures and shipments to other feedlots for further feeding.
GEORGIA MILK PRODUCTION UP 6 PERCENT
Geo'rgia dairy herds produced 106 mi llion pounds of milk during Oc t ober 1985, up 6 percent from last year but t he same as l as t month. The number of milk cows ~n Georgia's farms during October averaged 118,000 head, unchanged from a year ago and the previous month.
Production per cow a veraged 900 pounds, 50 pounds above last year and the same as last month.
U.S. OCTOBER MILK PRODUCTION UP 10 PERCENT
Milk produc ti on dur i ng October 1985 totaled 12.0 billion pounds, a record high for October and 10 percent above October 1984.
Production per cow a veraged 1,079 pounds during October 1985, 70 pounds above October 1984 .
The total number o f milk cows in herds averaged 11.2 million head during October, 3 percent above October 1984 .
MI LK COWS AND MI LK PRODUCTION, OCTOBER 1984-1985
Georg i a
United States
I tem
Un it
198 4
1985
Percent
1984
1985 Perc ent
Mi lk Cows 1/
Tho us. He ad
1 18
lr8
100
10 , 807 11,103
10 3
Milk pe r Cow 2/
Pounds
850
900
106
1,037
1,107
107
Mil k Production 2/ Mi l. Lbs.
100
106
106
11,206 12,291
11 0
1/ Includes dry cows, excl ud e s he ifer s n ot yet fr esh. 2/ Exclud e s mil k sucked by
calves.
3
GFR-8 5-Vol. 23
GEbRGIA BROILER HATCH UP 5 PERCENT
U.S. BROILER HATCH UP 4 PERCENT
The October hatch of broiler-type chicks in Georgia, at 56 million was 5 perc~nt more than the 54 million hatched in October 1984. The 590 million broilertype chicks hatched January-October was 5 percent more than the same period last year.
Nationally, the October 1985 hatch of broiler-type chicks, at 383 million, was 4 percent more than October 1984. The 4,007 million hatched during JanuaryOctober was 4 percent above the same period last year.
POULTRY HATCHING AND PLACEMENT--OCTOBER 1985
7. of
7. of
Item
Oct.
Sept.
Oct. year
Jan. thru Oct.
year
--
1984
1985
1985 ago
1984 I 1985
aRO
--Thousands--
--Thousands--
Pullet Chicks Placed
Domestic (U.S.~ 1/
Broiler Type
3,063
3,253
3,182 104
33,185
33,809 102
Egg Type
243
254
238
98
3,092
2,599
84
Chicks Hatched
Broiler Type
Georgia
53,701
55,867
56,373 105
559,077
589,810
105
United States
367,438 380,189 382,630
104 3,842,457 4,007,143
104
Egg Type
Georgia
1. 421
3,116
2,934 206
35,1 52
25,746
73
United States
31,372 33,458
33. 166 106
401,290
338,425
84
!_urkeys
Poults Place-t
u.s.
10,741
10,759
12,240
114
2/19,473
2/22,999
118
1/ Reported by leadi ng breeders, includes expect ed pullet replacemen ts fr om eggs
sold during the preceding month at the rate of 125 pullet chicks per 30 dozen case
of eggs. 2/Turkey poults placed Sept. 1985-0ct. 1985.
I t em
Chickens Egg Type Broiler Type
Turkeys
EGGS IN INCUBATORS, NOVEMBER 1985, UNITED STATES
I
1984
J 198_5__ --- --_:_
-- ---~=-ci( Y~~-r--jzo
--Thousands--
27,165
29,889
110
298,943
319,206
107
____ ____ _ 15 ,17!
__j~ 97 6
112
Georgia Hatching Other
Total Georgia Total U.S.
NUMBER OF LAYERS AND
No. Layers on
Hand-Oct.
1984
198')
Thousands
4,982 13,643 18,625 281,335
5,189 12,861 18,050
2]~~4~8
PRODUCTION
198') Number
1,829 2,161 2,072 2,080
4
1,897 2,071 2,017 2,069
Total Eggs Produced
Durin Oct.
1984
1985
Millions
91 295 386 5,852
98 266 364 5,761
COMMERCIAL POULTRY SLAUGHTER 1/. OCTOBER 1985
?. of
?. of
Item
Oct.
Sept.
Oct.
year
Jan. thr u Oct.
year
1984
1985
1985
ago
1984
1985
ago
-Thousands- - -
- - -Thousands-
Young Chickens Georgia
48,721
so, 195
57,085
117
444,334
536,534 121
United States
393,852
351,009
394,045
100 3,614,585 3,749,008 104
Mature Chickens
Light Type u.s.
16,277
9,239
8,841
54
126,213
119,553
95
Heavy Type U.S.
3,198
2,900
3,350
105
29,457
30,765 104
Total U.S.
19,475
12. 139
12,191
63
155,670
150,318
97
Total All Types, Ga. 3,863
2,238
2,115
55
31 , 947
28,505
89
Percent Condemned
Young Chickens
Georgia
1. 4
2/1.6
2/ I. 4
3/NA
United States
1.4
1.7
2/1.5
2/1.6
1/ Federally inspected slaughter data as collected by Meat and Poultry Inspection
Program. Current month data estimated by Market News Service. 2/ January-Sept.
condemnations. 3/ Not available.
OCTOBER PEANUT STOCKS
Peanut stocks in commercial storage on October 31, 1985, totaled 5.48 billion pounds of equivalent farmer stock. This total includes 4.52 billion pounds of actual farmer stock. Shelled peanuts on hand tota led 892 million pounds o f equi valent farmer stock. Roasting stock totaled 65.6 million pounds. There were 486 million pounds of Commodity Credit Corporat i on uncommitted stock on hand as of October 31, 1985. Shelled peanut stocks on October 31, 1985, totaled 671 million pounds of which 652 mil lion pounds were edible grades and 18.7 million pounds were o i l stoc ks . Edible grade stocks, by type, were Virginias, 164 million pounds; Runners, 418 million pounds; and Spanish, 70.0 million pounds.
u.s.
Class
Farmer Stock
She lled
Peanuts 3/
43 6
743
671
Roasting Stock
23
92
66
Total 4/
611 2,972
5,480
1/ Excludes stocks on farms. Includes
stocks owned by or held f or account of
CCC i n commerc i al sto r a ges. Farmer stock
on net we ight b a sis . 2 / Preliminary. 3/
Includes s he l l ed edib le and shelled o il
stock. 4/ Actual f armer stock, pl us
roasting stock, plu s shelled peanuts X
1.33.
Commodit
Butter Cheese, Natural Eggs, Frozen Fruits, Frozen Frui t Juices, Frozen Meats, Red
Beef, Frozen Pork, Frozen Poultry, Frozen Turkeys, Frozen Vegetables, Frozen Potatoes, Frozen Peanuts, Shelled Peanuts, In Shell Pecans, Shelled
Pecans._l!l_!i~l_l_
374,276 1,078,411
17,921 771,430 873,454 677,187 328,218 275,589 554,895 415,431 2,070,681 821,344 214,347
15,292 20,124 27,446
Pounas 247,023 940 , 987
16,384 760,113 1,199,597 655,992 308,362 278,791 625,703 444,460 2, 238 ,029 861,447 296,907
20,380 20,325 13,295
5
230,407 893 , 833
15,298 821,139 1,089,121 643,514 295,091 275,643 662,381 480,948 2,313,945 1,005,012 302,322
27,343 17,727 10,54 6
1983
62
93
83
95
85
93
106
108
125
91
95
98
90
96
100
99
119
106
116
108
112
103
122
11 7
141
102
179
134
88
87
38
79
GEORG I A FERTILIZER CONSUMPTIO N DOWN PERCENT
Georgia fe r tilizer cons umption for the
year end i ng June 30, 1985, totaled
1,893,004 tons, a decrease of 1 percent
from last year's 1,914,583
tons.
Fertilizer mixtures amounted to 989,592
tons, down 7 percent from 1984. Direct
application materials totaled 711,571
tons of primary nutrients and 191,841
tons of secondary and micronutrients.
U.S. TOTAL FERTILIZER CONSUMPTION DOWN 2 PERCENT
Fertilizer consumption in the U.S.
Puerto Rico during the year ended
30, 1985, ~otaled 49.0 million tons, 2 pe rcent from the 50.1 million consumed during the 1983-84 year.
and June down tons
GFR- 8 5-Vol. 23
Pr ima ry nutrient c ontent (n i trogen , N; phosphate, P 2 0 5; and potash , K 2 0) was 21 . 7 million tons, a decline of 1 pe rcent f rom a year earlier. Ni t r ogen c o n sumption totaled 11.5 mi llion tons, 4 per cent more than for the year ended J une 30, 1984. The usage of phosphate r eached 4.64 million tons of avai lable P 2 0 5,
be low last year by 5 percent. Potash consumption, at 5.51 million tons, was also down 5 percent.
The five leading states in order of total
consumption for the year ended June 30, 1985 were: Illinois, 4.13 million tons,
down 6 pP.rcent; Iowa, 3.73 million tons, off 2 percent; California, 3.66 million tons, 7 percent below last year; Texas with 3.08 million tons, up fractionally; and Indiana, 2.66 million tons, increased
1 percent from a year earlier.
Fertilizer consumption represents all
commercial fertilizer tonnage sold o r
shipped for farm and non-farm use as
fertilizer.
Materials u sed in the
manufacture of registered mixes or for
use in other fertilizers are excluded.
NITIIIIN
00
I I
_:]
~TE
q>tJri
F///1
PllTASf
f1.if1J
r'l'XVi
PLANT NUTRIENT CONSUMPTION
MIL lOIS IF lli!RIOO Z5
21
n I I
15
u
II
nn I I I
5
1m
1!177
1978
11179
19111
191!1
l!li!Z
um
li84
191!5
ltiR OOIMO Jll :. 6
GEORGIA RED MEAT PRODUCTION
UNITED STATES RED MEAT PRODUCTION
Georgia red meat production totaled 30,860 million pounds during October 1985, down 13 percent from October 1984. The January-October red meat production totaled 331,082 million pounds, 7 percent less than the comparable period of 1984.
- ~tle slaughtered by commercial plants An Georgia during October totaled 23,000 head a decrease of 200 head from the previous year. Calves slaughtered in October totaled 200 head down 1,300 head from a year ago.
There were 120,400 hogs slaughtered in commercial plants across the State during October 1985. This was 31,200 head less than last year.
Commercial red meat production for the U.S. in October 1985 totaled 3.55 billion pounds, down 3 percent from last year.
Beef production at 2.11 billion pounds, was down 3 percent. Head kill was 3.24 million, down 7 percent, and average live weight increaed 32 pounds to 1,104.
Veal production, at 46 million pounds was the same as last year. Calf slaughter of 319 thousand head was up 4 percent and average live weight was down 4 pounds to 244.
Pork production totaled 1.36 billion pounds , down 4 percent and head kill was 7.79 million, also down 4 percent.
Sji!ecies
Georgia Cattle Calves Hogs Sheep & Lambs
GEORGIA AND UNITED STATES LIVESTOCK SLAUGHTER 1/
Number Slaughtered
: Average
1985
Jan.-Oct. : Live Weight
Oct.
as 7. of '85 as 7. of : Oct.
1984
1985
1984
1984
:1984 1985
1 ,000 Head
Percent Percent
Po u nds
Total
Live Weight
Oct.
1984
1985
1, 000 Pounds
23.2
23.0
99
1.5
.2
133
151.6 120.4
79
.1
1
100
102
883
901
20,506
20,742
76
351
404
539
94
88
234
235
35,520
28,355
114
111
80
10
10
United States
Cattle
3,477.9 3,241.8
93
97
1,072 1,104 3 , 727,965 3,577 ,644
Calves
307.6 318.9
104
102
248
244
76,253
77,682
Hogs
8,151.7 7,788.6
96
100
244
246 1,989,278 1,914 , 624
Sheep & Lambs 608.0 571 . 3
94
91
110
115
67,037
65,449
1/ Includes slaughter under Federal Inspection and other commercial slaughter, excludes
farm slaughter.
COMMERCIAL RED MEAT AND LARD PRODUCTION: UNITED STATES WITH COMPARISONS 1/
Oct.
1985 as /. : Jan.-Oct. 2/
1985 as /.
Kind
1984
1985
of 1984
: 1984
1985
of 1984
Million Pounds
Percent
Million Pounds
Percent
Beef
2,182
2,1 09
97
19,662 19,883
101
Veal
46
46
100
397
410
103
Pork
1,411
1,358
96
12,174 12,269
101
Lamb & Mutton
33
33
100
311
293
94
Total Red Meat 3,672
3 , 545
97
32,544 32,855
101
Lard 3/
89
85
96
769
774
101
1/ Based on packers dress weights and excludes farm slaughter. 2/ Accumulated totals
based on unrounded data. 3/ Preliminary lard production includes rendered pork fat.
7
Georga
rccrop
... ~Reporting Servce
St~phens Federal Bid
SUite 320
g.
Athens Ceorg1.a 30613
c:
...... ......
) Q)
..,0
~
..~...
c:
~
t1l
c:
...c.c...:..
t1l 1.4
c~. Uc:l
C)()
~
t1l :
c:
Q)
3
>.
-co:
t1l
sQ)
t1l
~
Q)
c:
.., 0
Ul
Q)
.c:
t1l
Q) Ul
.c:
>.
00 ::J
t1l
0
-o
~
......
..c1..,:4
.c0:
Ul
.
1.4 t1l
Q)
>.
.., .0.,
..~
....
...... ......
o.
~
.U.,l
1.4 t1l
Ul
3
Q)
.c:
...Q.c,)
-o
0 0 00
1.4
~
0
C)()
t1l 1.4 ::J
..cQ.:,:)
0
.()
c:
0
~
Ul
~
::J
Q)
-o
~
::J 00
.0.,
) Q)
c:
>
00
SECOND -CLASS
POSTAGE PAID ATHENS ' GA 3A0T613
L 1 v
.... I
~I l I
G~EORGIA
:,rARM REPORT
.. ..... F~
935) 0<1-
., . - -' .:....::. : '
... .
-.
December 11,
-
.. <'
-
GFR-85-Volume 24
Re~o~veo
DEC1 3 1985
oc:u ' !~~ rs
UG\. - -- ; s
GEORGIA .
~ CROP REPORTING SERVICE
Stephens Federal Bldg. Suite 320 Athens, Georgia 30613 Phone: ( 404) 546-2236
HIGHLIGHTS:
STORM HURTS COTTON CROP
Cotton and Pecan Forecasts Agricultural Prices
Georgia's cotton crop is currently forecast at 360,000 bales, 8 percent or
PECAN FORECAST LOWERED
30,000
bales below the predicted
production a month earlier. Most of the
The December 1 forecast of Georgia's 1985
pecan production was lowered 10 million
pounds from the October 1 forecast to 95
million pounds.
At this level, the
current crop is 10 percent lower than the
decline was attributed to Hurricane Kate.
Kate
caught part of the
crop,
particularily in extreme south Georgia,
in a very vulnerable condition, b~owing
the lint cotton that was ready for
previous forecast, and is 21 percent less than last year's . 120 million pounds.
harvest onto the ground. That cotton which remained on the stalks was, in many
Hurricane Kate did considerable damage to groves in South Georgia but the main loss to the 1985 crop was in terms of lowered
cases,
matted and tangled.
Full
assessment of the damage will not be
known until the success or failure of
shelling percentages and quality. The
further harvesting is known. The curren t
combination of continued wet conditions
forecast is based primarily upon a census
and record high temperatures duri ng
bureau survey of ginners ginning& to
November caused rapid quality loss, in sharp contrast to the high quality of
December 1 and expected ginnings for the
remainder of the season.
Georgia's
early harvested pecans. Nuts that were
on the ground just prior to and
immediately after Hurricane
Kate's
passage were especially affected.
expected average yield was lowered from 720 pounds per acre a month ago to 678 pounds per acre. Acres for harvest were reduced from 260,000 acres to 255,000.
- , ---- GEORGIA
ACREAGE AND Ac reage
PRODUCT!
..
'h
e
I1o-9-8-4
...._ 9
er Acre
l:'roduct on
Plante~
Indi
Indi-
Crop 1/
Unit
for all
Har-
For
cated
cated
Purposes vested Harvest
Dec. 1
Dec. 1,
198~
-
1984 2/ 198~ 2/
ntt~Anrt ArrPA -
1984
1985
1984
198~
--Thn~;~ntiQ -
Pecans
Lbs.
120,000
9~,000
Cotton 3/
Bales
2~0
172
H~
784
678
281
360
Corn
Bu.
1,080
98~
1,000
82.0 80 .0
80,770
80,000
Soybeans
Bu.
1,800
2,000
1. 7~0
20.0 26.0
40,000
4,500
Peanuts
Lbs.
610
640
~95
3,37~
3,300
2,160,000
1,963,~00
Tobacco,
Type 14
Lbs.
NA
38
37
2,250 2,210
85,500
81,770
Sweetpotatoe& Cwt.
6.5
6.4
6.3
140
160
896
1,008
Hay, All
Tons
NA
550
520
2.40 2.50
1,320
1,300
Apples, All
Commercial
Lbs.
50,000
35,000
Peaches
Lbs.
1~0,000
80,000
Grapes
Tons
2.7
2. 9
Wheat
Bu.
950
890
825
35.0 30.0
31,150
24,7~0
Oats
Bu.
115
60
50
55.0 40.0
3,300
2,000
Rye
Bu.
4~0
80
100
22.0 21.0
1,760
2,100
Sor2hum
Bu.
17~
113
140
42.0 43.0
4,746
6,020
cotton
er crop est1mates brought
3/ Cotton yield in pounds
,Agrieol.tara1 Statistician and Georgia Depart.ent of Agrl.eult:ure
U.S. PRICES PAID INDEX UP 1 POINT
CONSUMER PRICE INDEX
GFR-85-Volume 24
The Index of Prices Paid by Farmers for Commodities and Services, Interest, Taxes, and Farm Wage Rates for November was 163 percent of its 1977 average. The
index was 1 point higher than October but 1 point lower than November 1984. Contributing most to the increase from
last month were the feed and feeder
livestock components.
The October Unadjusted Consumer Price
Index for all urban consumers (CPI-U)
increased 0.3 percent from September to
325.5 (1967100). The index was 3.2
percent above October 1984.
On a
seasonally adjusted basis, the CPI-U was
0.3
perc~nt
above
S~ptember.
All
components in-creased. _ The transportation
index was up 0.2 ~percant r the first
increase since April. Increases of 0.6
percent were recorded for apparel and
upkeep and entertainment indexes. The
medical care index rose 0.5 percent. The
food and beverages and other goods and
services indexes increased 0.4 percent.
The housing index was 0.3 percent higher.
PRICES PAID BY FARMERS. NOVEMBER 15, 1985 WITH COMPARISONS
I
Price
Georgia
United States
per
Nov. 15, Oct. 15, Nov. 15,
Nov. 15, Oct. 15, Nov. 15,
Commodity
Unit
1984
1985
1985
1984
1985
1985
Dairy Feed 16 7.
$ /Ton
175.00
166.00
166.00
177.00
162.00
163.00
Dairy Feed 18 7.
S/Ton 176.00
168.00
168.00
182.00
165.00
168.00
Dairy Conct. 327.
S/Ton 21 5 . 0 0
172.00
172.00
245.00
226.00
232.00
Hog Feed 14 7. -18 7.
S/Cwt.
10.50
9.80
9.60
9.93
9. 12
9.23
Hog Conct. 387.-427.
S/Cwt.
13.50
13.00
12.50
13.30
12.40
12.70
Beef Cattle Conct.
327.-36 7.
S/ Cw t.
12.50
11 .00
12.00
11.30
10.10
10.50
Co ttonseed Meal 417. S /Cwt.
13.00
11.00
11.50
13.50
10.70
11.00
Soybean Meal 447.
S/ Cwt.
12.00
12 . 00
11.50
11.60
10.30
10.60
Br an
S/Cwt.
11 .50
11.00
10.50
9 . 98
9.24
9.31
Middlings
S/Cwt.
10.50
9.90
10.50
9.51
8.45
8.42
Corn Meal
S/Cwt.
9.20
8.30
8.10
7.88
6.94
6.80
Broiler Grower
$/Ton 250.00
182.00
180.00
219.00
181.00
182.00
Laying Feed
S/Ton 183.00
156.00
156.00
190.00
175.00
178.00
Chick Starter
S/Ton 225.00
177.00
175.00
216.00
187.00
191.00
Broiler-Feed Ratio 1/ Lbs.
2.3
2.9
3.4
2.8
3.1
3.5
Hog-Corn Ratio 2/
Bu.
15.5
19.0
17.8
18.4
20.3*
19.1
Milk-Feed Ratio 3/ Lbs.
1.75
1.61
1.64
1.62
1.56*
1.56
Egg-Feed Ratio 4/
Lbs.
7.9
9.4
9.0
6.5
7.3
7.4
*Revised. 1/ Pounds of broiler grower equal in value to 1 lb. broiler live weight. 2/ Bushels
of corn equal in value to 100 lhs. of hog live weight. 3/ Pounds of 16/. dairy feed equal
in value to 1 lb. whole milk. 4/ Pounds of laying feed equal in value to 1 doz. eggs.
1977100
INDEX NUMBERS--GEORGIA AND UNITED STATES
--Oct. 1984
Nov. 1984
Oct. 1985
Nov. 1985
Georgia
Prices Received
All Commodities
121
Crops
123
Livestock & Products
119
United States
Prices Received
138
Prices Paid 1/
163
122
116*
119
120
I 11 *
111
12 4
120*
126
136
123
126
164
162
163
Ratio 2/
85
83
76
77
Revis~/Mid month index including interest, taxes and farm wage rates. 2/ Ratio
of Index of Prices Received to Index of Prices Paid, Interest, Taxes and Farm Wage
Rates.
2
GEORGIA PRICES RECEIVED
The November Index of Prices Received by
Georgia farmers for All Commodities
increased 3 percent from October to 119
percent of its January-December 1977
average. Higher prices for wheat, corn,
cottonseed,
soybeans, sweetpotatoes,
barrows and gilts, beef cattle, calves,
milk, other chickens, broilers and market
eggs were partially offset by lower prices for cotton, peanuts, sows and
hatching eggs. The index was 3 percent
below a year ago.
U.S. PRICES RECEIVED INDEX UP 3 POINTS
The November Index of Price s Received by Farmers for All Farm Products increased 3 points from October to 126 percent of its January-December 1977 average. Higher .Prices for cattle, broilers, corn, strawberries, and oranges were partially offset by lower prices for lemons, hogs, and grapefruit. The index was 10 points below a year ago.
PRICES RECEIVED BY FARMER~~OVEMBER 15, 1985 WITH COMPARISONS
Price
Geor~ia
I
United States
per
:-<ov.
Oct.
Nov. IS,
Nov.
Oct.
Nov. IS,
Commoditv
Un i t
1984
1985
1985
1984
1985
1985
Winter Wheat
S/Bu.
2.98
2.74
3.03
3.38
2.99
3.03
Oats
$/Bu.
1.68
1.08
1. 10
Corn
S/Bu.
2 . 97
2.24
2.40
2.55
2. 12
2.22
Cotton
Ct. /Lb. 61.5
56.0
1/54. 0
62.0
56.7
1/56.7
Cottonseed 2/
S/Ton
87.00
54.00
58.00
98.00
52.00
67.00
Tobacco
Ct./Lb.
168.0
3/
187.3
179.5 3/165.5
Soybeans
S/Bu.
6.04
4.84
5.01
6.01
4.85
4.92
Peanuts
Ct. /Lb. 20. 1
20.9
1/19.5
25.6
23. 1
1/22.5
Sweet potatoes
S/Cwt.
15 . 40
2/9.20
9.60
12.70
2/7. ';I
8.32
All Hay, baled 2/
$/Ton
72.30
66.00
66.00
Milk Cows, 4/5/
S/Head
840.00
815 . 00
Hogs
S/Cwt.
46.10
42.60
42.70
47 . 00
43.10
42.40
Sows
S/Cwt.
38.30
34.60
34.50
40 .60
36.00
37.00
Barrows & Gilts
S/Cwt.
47.50
43.10
43.50
48 . 00
43.90
43 .00
Beef Cattle 6/
S/Cwt.
37.50
39.40
40.00
54.80
52.10
55 . 00
Cows 7/
S/Cwt.
32.90
32.80
33.20
33.90
33.00
32.80
Steers & Heifers
S/Cwt.
46.60
49.00
50.70
61 .10
56.60
60.30
Calves
S/Cwt.
47.30
53.10
54.20
59.40
60 .20
61. 10
All Milk
S/Cwt .
15.30
13.40
3/13.60
14 . 30
12.60 3/12.70
Turkeys 2/
Ct./Lb.
56.3
57.0
58.4
Chickens, Excluding
' Broilers
Ct. /Lb. 23.5
2/25.0
30.5
Com'l Broilers 8/ Ct./Lb. 29.0
26.0
3/30.5
30.9
27.7
3/31.8
Eggs, All 9/
Ct./Doz 72.4
2/73.1
69.9
61.9
2/63.5
66.2
Table
Ct./Doz 58. 6"
2/54.9
56.5
55.4
2/57.1
60.3
Hatching
Ct./Doz. 120.0
2/125.0
110.0
1/ First half of month. 2/ Mid-month price. 3/ Entire month. 4/ Animals sold for dairy
herd replacement only. 5/ Prices estimated quarterly. 6/ "Cows" and "steers and heifers''
combined with allowance where necessary for slaughter bulls. 7/ Includes dairy cows sold
for slaughter. 8/ Liveweight equivalent price for Georgia. 9/ Average of all eggs sold by
farmers including hatching eggs sold at retail.
3
UNITED STATES ACREAGE AND PRODUCTION 1984 AND 1985
Area ttarvescea
1e1 er Acre
l:'ro uct1on
I lndl
lndl-
cated
cated
I e i i S; " C.::r.o.:p..=.~<'---------"'--":.:..:..::.U..:n:.i.t.__.__ _.1::.9..;;81.T4-,' nn~rri-n--;A.-:;c::1-:9:r:8-:5e~s;;-=-=----1---=1..9:.8..:4'-'-----'--=-.:1..9.::8.;5o..._ , ---
ln(llcatect
Dec. 1, ~------.....-.
_.__--':...:.1..9;~8..4r~-=-:::-::l'-":...:...1;:9:;.8::5.._ _ ,_"o.
Tnousanas
_ u
.g,>o:;
o.+-
"'< .. .c
Upland Cotton 2/
Bales 10,299.5
10,252.6
599
640
12,851.4
13,662.4 o - "., .0. ~ o..
Cottonseed
Tons
5,149
5,484 ~~ .li&.!~ ~~
Pecans
Lbs.
Corn for Grain I I Bu.
Sorghum for
Grain 1/
Bu.
All Wheat 1/
Bu.
Soybeans for
Beans 1/
Bu.
Peanuts for Nuts 1/ Lbs.
All Hay 1/
Tons
Sweetpotatoes 1/
Cwt.
Apples, Com'l 1/
Lbs.
Peaches 1/
Lbs.
71,816
15,348 66,928
66,113 1,531.0
61,585 103.5
7 4, 7 5 6
16,181 64,588
62,223 1,455.0
61,801 105.9
106.6
56.4 38.8
28.1 2,878
2.45 125
116.6
69.6 37.4
34.2 2,902
2.45 134
232,400 7,656,195
865,856 2,595,479
1,860,863 4,405,745
150,781 12,986
8,285,500 2,643,80 0
236,300 8,716,534
1,126,856 2,418.818
2,129,034 4,222,050
151,220 14,230
8,114,500 2,1 0 8, 500
'"it"-.; ."'ci:.!"'!
cu ;<!li.1~0~&...w~";"o:-+8-~D.;+<- .
9~!"-'"~-g o;.:u l!-~~~~::.:~:
"' ;:
.~. ~"'-'-~0~~-.o,
c
'""
"' ..
'~'
t,..i"~ ."'e~g>~-
&.:;:Zi~~-1:+=.i:~
~'C. ~~.:::;8, .~
e11~.iY ... -:=:!!';;
:0 -~> .!:~~- -.;g
U.... ~E ~L~l.,iI je:=U~geo-.-;~~
Grapes 1/
Tons
5,163.9
5,410.4 ;:;...,"'!u< ;:umc;
Oats 1/
Bu.
8,123
8,750
58.1
61.4
471,921
537,443 . l;_!.!:+-:;:+-:0~.,_,..
Rye 1/
Bu.
981
677
33.0
28.5
32,392
19,298 ~~t<~"~t;;;.~...,
Almonds (Calif.)!/ Lbs. Walnuts (Calif.)!/ Tons
587,000 213.0
495,000 215.0
~1-~o!~..". i..,~~,..,_!.,~_
I/ Estimates carried forward from earlier forecast. 2/ Yield in pounds.
Georgia Crop Reporting Service
Stephens Federal Bldg. Suite 320 Athens, Georgia J 061 3
SECOND-CLAS S
POSTAGE PAID AT
ATHENS, GA 30613
0 42P01 1 3 1 oo o~ o 9 5-2S7~g9s ~ R os
UNIV OF GEOR GIA
DOCUMENTS SECT LIBRARY
ATHENS
GA 30602
GA
A4oo .C.7
Pt CEORGIA
F:Z.
98f!ARM REPORT
December 27, 1985 GFR-85-Volume 25
Received
JA N0 2 1986
DO CUM1\JTS UGA LIBRARIES
GEORGIA
~ CROP REPORTING SERVICE
stephens Federal Bldg. Suite 320 Athens, Georgia 30613 Phone: ( 404) 546-2236
HIGHLIGHTS December 1 Pi g Crop ~onthly Pou l try Livestock Slaughter Cattl e on Feed Milk Production Cold Storage
GEORG IA HOG INVENTOR Y DOWN 4 PERCENT
The inventory o f all hogs and pigs on Georgia farms on De cember i , 1985, totaled 1,150,000 head, 4 percent less than Decemuer 1, 1984. This total equals the previous record low set in March 1985 and is 4 percent less than Sept ember 1985. Breeding hogs, however, are up i percent from a vear earlier to 165,000 head. the same as the prev i ous qua r t e t. Market hogs, at 985,000 h e ad, are "> percent below both last year and last quarter.
U.S. INVENTORY DOWN 3 PERCENT
IJ .S. inventory of all hop,s i'lnd pigs is
estimated at 52 .3 mill ion heao on
De c ember 1 , 1985. Thi s is 3 per c ent
below a year ago and 8 pe r cent less tha n
De c ember 1, 1983. Breeding hog inv e ntory
at 6.78 million, is 2 percent below l a st
year.
~arket hog inv e ntory a t 45 .5
million, is 3 percent below a year a go .
The De cember 1984-Mav 1985 pig c r op,
estimated at 42.5 million head, is up
slightly from a year earlier. The .June-
November 1985 pig c rop, estimated at 41. 5
million hf>ad, is 2 percen t bel ow l ast
vear . A total o f 5 .67 million sows
farrowed during J une-November 1985, 3
percen t below a year earlier. The litter
size during this period avera~ed a re c ord
high 7.67, up from the previous re c ord of
7.5 4 se t a year earlier.
U.S. hog
produce rs intend to have 5.59 million
sows farrow during th e De cemb e r 1985-May
1986 period, up fractionally from a year
a go.
(See Paf~e 7)
The September-November !98'> pig crop tot a led 460,000 head, down 5 pe r c ent from the same period a vear earlier. Sows farrowing during this period amounted to 63,000 head, 7 perc ent less than September-November 1984. Pigs saved per litter averaged 7.30, compared with 7.10 for the comparable period last year.
Georgia producers intend to have 60,000 sows farrow during December 1985-February 1986. If these intentions are realized, farrowings will be the same as the a c tual farrowings during December 1984-Fehruary 1985. Producers are expecting 72,000 sows to farrow during March-May 1986, 1 percent more th~n the comparable period a year earlier.
10 QUARTERLY STATES DOWN 1 PERCENT
The 10 quart e rly states with 41 . I mi Ilion
head on December 1, 1985, are down 3
nercent from a vear earlier. The .lunP-
August 1985 pig-crop totaled 16.9 million
head, 1 per cent below the same quar ter a
vear earlier. For the September-November
period, the pig crop of 17.3 million head
is 1 percent below the same period in
! 984. Intentions in the 10 quarterly
states totaled 1.96 million sows to
tnrrow during December 198 5-Fehrunry
J9R6. This is up slightly from actual
tarrowings during the same period a ye ar
earlier. The March-May 1986 intentions,
at 2.42 million, are fractionallv below
the March-May 1985 quarter.
(See Pages 4 & 5)
(See Pa RP.S 4 & ~)
Agrf.eult:aral St:at:iat:ici.all aDd Georgia Deparblent: of qrf.cult:ure
GFR-85-Vol. 25
CATTLE 0~ FEED I~ 7 STATES DOWN 8 PERCE~T
Cattle and calves on feed Dec~mber 1 for the slaughter market in the 7 states pre9aring monthly estimates totaled 7.88 million head, down 8 percent from a year ago out I percent above December I, 1983.
Marketings ot fed cattle during November totaled 1.38 million, a decrease of 8 percent trom last year and 5 percent less than November 1983.
Placements of cattle and calv~s on feed in the 7 states were 1.78 million, down 9
percent from November 1984 but up 4 percent from two vears ago. Net placements of 1.70 million were down 7 percent from 1984 but 7 percent above 1983.
Other disappearance totaled 76 thousand compared with 121 thousand during November of
i984 and 1983.
CA~LF. AND CALVES: Item
~L~BER ON FEED, PLACE~ENTS, ~ARKF.TED, ANn OTHER 7 STATES, NOVEMBER 1 TO DECE~BER I
1984
198')
OTSAPPEARA~CE,
I'f85- as 7. of 1984
On Feed, November 1 1/
8, 221
7, 564
92
rlar.ed on Ff!f!d during November
I, qo45
1, 775
q1
Fed Cattle Marketf!d during November
1,501
1,380
92
Other Oisappearance durinP, !llovemlu~r 2/
121
76
63
On Feed December I 1/
8,544
7,881
q2
II Cattle anrl calv~s on fe~l are animals for slauRhter market being fed a full
ration of grain or other concentrates and are expected to produce a carcass that
will Rrade good or better. 2/ Includes death losses, movement from ff'!ectlots to
pastures an~ shipments to other feedlots for further feeding.
GEORGIA MILK PRODUCTION UP 6 PERCENT
Georgia dairy herds produced 106 million pounds of milk during November 1985, up 6 percent from last year but unchanged from last month.
The number of milk cows on Georgia farms
during November averaged 118,000 head,
the same as the previous month and
previous year.
Production per cow
averaged 900 pounds, 50 pounds more than
last year but unchanged from last month.
u.s. ~OVE~BER MILK PRODUCTION UP 10
PERCENT
Mil k production during November 1985 totaled 11.6 billion pounds, a record high for November and up 10 percent from November 1984.
Production per cow averaged 1,035 pounds during November 1985, 62 pounds above November 1984.
The total number of milk cows averaged 11.2 million head during November, 3 percent above November 1984.
MILK COWS AND MILK PRODUCTION. NOVEMBER 1984-1985
Georgia
United States
Item
Unit
1984
1985
Percent
1984
1985 Percent
Milk Cows 1/
Thous. Head
118
118
100
10,823 11,186
103
Milk per Cow 2/
Pounds
850
900
106
973
1,035
106
Milk Production 2/ Mil. Lbs.
100
106
106
10,529 11,572
110
1/ Includes dry cows, excludes heifers not yet fresh. 2/ Excludes milk sucked by
calves.
The Geor~la Farm Report (I SSN-0744-7280> Is published semi-monthly by the Georgia Crop Report i ng Service, Stephens Federel Building, Athens, Ga. 30613, Larry E, Snipes, Statist ician In Charge, Second class postage pa ld at Athens, GA, SubscrIpt Ion tee S10 per yeer except tree to deta contributors, Subscription Information avelleble trom: Georgia Crop Reporting Service, Stephens Federa l Build ing , Suite 320, Athens, GA, 30613 Telephone: (404) 546-2236,
2
GEORGIA RED MEAT PRODUCTION
UNITED STATES RED MEAT PRODUCTION
Georgia red meat production totaled 23.2
million pounds during November 1985, down
27 percent from November 1984.
The
January-November red meat production
totaled 354 million pounds, 9 percent
less than the comparable 1984 period.
Cattle slaughtered by commercial plants in Georgia during No vember totaled 19,400 head a decrease of 2,300 head from the previous year. Calves slaughtered in November totaled 200 head, down 1,300 head from a year ago.
There were 84,600 hogs slaughtered in commercial plants across the state during November 1985. This was 49,100 head less than last year.
Commercial red meat production for the U.S. in November 1985 totaled 3.12 billion pounds, down 6 percent from last year.
Beef production at 1.81 billion pounds was down 6 percent. Head kill was 2.81 million, down 9 percent, and average live weight increased 30 pounds to 1,102.
Veal production, at 42 million pounds was down 2 percent. Calf slaughter of 288 thousand head was down 4 percent and average live weight was up 7 pounds to 249 pounds.
Pork production totaled 1.24 billion pounds, down 7 percent and head kill was 7.01 million, also down 8 percent. Average live weight increased 2 pounds to 248 pounds.
s2eci es
Georg i a Cattle Calves Hogs Sheep & Lambs
GEORGIA AND UNITED STATES LIVESTOCK SLAUGHTER 1/
Number Slaughtered
: Average
1985
Jan. - Nov. : Live Weight
November as /. of '85 a s /. of : November
1984
1985 1984
1984
: 1984 1985
1,000 Head
Pe rcent Perc ent
Pounds
21.7
19.4
89
101
873
901
1.5
.2
13
70
356
413
133.7
84.6
63
86
235
236
. 1
. 1
100
100
114
100
Total
Live Weight
November
1984
1985
1,000 Pounds
18 ,98 4 528
31,386 8
17,474 75
19, 922 8
United States
Cattle
3,086.3 2,812.3
91
96
1,072 1,102 3,307,402 3,099 , 917
Calves
298.5 288.0
96
101
242
249
72,169
71,721
Hogs
7,597.2 7,012.4
92
99
246
248 1, 867, 934 1,737,073
Shee2 & Lambs 540 .6 475.5
88
91
113
116
6 1,030
55,3 38
1/ Includes slaughter unde r Federal Inspect i on and o t her commercial slaughter , excludes
farm s l aughter .
COMMERCIAL
RED
MEAT AND LARD Wovemb e r
PRODUCTI ON: 1985 as
UxN I-T-E:D
STATES WI TH COMPARISONS 1/
Jan.-Nov . 2/
- r~~~
Ki nd
1984
1985
of 1984 : 1984
1985
of 1984
Million Pounds
Percent
Million Pounds
Pe rc ent
Beef
1, 924
1,812
94
21, 587
21,695
101
Veal
43
42
98
440
452
103
Pork
1,326
1,237
93
13,500
13 ,507
100
Lamb & Mutton
30
28
93
342
321
94
Total Red Mea t
3,324
3 ,1 19
94
35 ,868
35,974
100
Lard 3/
83
78
94
85 2
851
100
1/ Based on packers dress weights and e xcludes fa rm slaughter. 2~ccumuiated tota l s
baaed on unrounded data . 3/ Preli mi na ry lard production includes rendered pork fat .
3
HOGS
GFR-85-Vol. 25 AND
10 OUARTF.RLY STATES
Item
MARCH 1 INVENTORY
All liOP,S ~s
2. 150
Kept for Breeding
327
~arket
i. 823
Market !logs & Pigs
hv tlei~ht Groups
Cnder 0 Pounds
767
60-119 Pounds
510
120-179 Pounds
356
180 Pounds & Over
190
.TUNE l INVENTORY
Afi!iOgs Sc Pigs
2. 180
Kept for Breeding
32 7
~arket
1. 853
Market Hogs & Pi~
hv Wei$ht Groups
Under t>O Pounds
826
60-119 Pounds
519
120-179 Pounds
343
180 Pounds & Over
165
SEPTEMBER 1 INVENTORY
All Hogs S. Pigs
2,100
Kept for Breeding
305
Market
1,795
Market Hogs & Pigs
by Wei6ht Grouns
Under 0 Pounds
781
60-119 Pounds
449
120-179 Pounds
359
180 Pounds & Over
206
DECEMBER 1 INVENTORY
All Hogs & Pigs
2,250
Kept for Breeding
350
Market
1. 900
Market Hogs & Pigs
~v Wei~ht Groups
Under 0 Pounds
783
60-119 Pounds
498
120-179 Pounds
395
180 Pounds & Over
224
SOWS FARROWING
December 2/-Februarv
115
March-Mav
'
120
December 2/-Mav
235
June-August
'
115
September-November
120
June-November
235
PIG CROP
necember 2/-Februarv
817
March-Mav
'
864
DecPmber 2/-Mav
1,681
June-August
794
September-November
798
June-November 1/ Ga., Ill., Ind.,
Iowa, 1~a5n9s2.,
1 '900 300
1,600
688 440 301 i 71
1 '650 231
1,419
603 396 253 167
1,700 250
1,450
638 338 287 187
1,520 204
1,316
526 375 250 165
100 88
188 88 78
166
725 634 1,359 638 554 11192 Minn.,
1 '350 190
1, 160
1, 3 50 200
1 , 1so
l. 250 180
1 ,070
464 325 226 145
J, 390 215
1 , 17 5
466 317 235 132
1,400 215
1 '18S
433 289 221 127
1 '320 200
1. 120
502 315 218 140
1 ,400 215
1' 185
S29 320 213 123
1,3SO 200
1 '1 so
493 302 202 123
1,250 180
1 ,070
531 293 221 140
1,450 220
1,230
512 30S 207 126
1,3SO 195
1 '1 s 5
471 288 193 118
1,200 163
1 ,037
529
491
442
351
312
285
221
219
193
129
133
117
74
75
66
76
81
77
150
1S6
143
80
74
72
78
72
68
158
146
140
511
S18
462
555
583
554
1,066 1,101 1 '016
568
525
5 11
S54
518
483
1,122_ 1,043
994
Mo., Neor., N. C., Ohio.
1 , 150 160
990
85 85 92 48,935 84 80 89 7,148
85 86 93 41,787
401 271 204 114
1,200 165
1,035
86 86 93 16,009 83 85 94 9,898 90 87 92 9,358 79 86 90 6,522
8fi 86 91 49,060 77 77 83 6,961 88 87 92 42,099
450 285 190 110
1,200 165
1. 035
90 85 91 18,732 90 89 94 10,219 87 89 94 7,508 79 89 89 5,640
86 89 96 49,250 77 83 92 6,551 87 90 97 42,699
450 280 190 115
1,1SO 165 985
85 88 96 16,597 96 92 97 11,096 86 92 98 8,803 82 91 97 6,203
79 85 96 49,040 75 85 101 6,810 80 85 95 42,230
420
79 86 95 16,755
265
75 85 93 10,656
190
86 87 98 8,541
110
85 83 94 6,278
60
81 80 91 2,428
70
92 86 91 2,988
130
87 83 91 5,416
66
83 89 92 2,517
63
81 88 93 2,620
129
82 88 92 5,137
432
85 83 94 17,420
518
93 89 94 21,889
950
89 86 94 39,309
482
85 92 94 18,077
460
83 89 95 19,022
942
84 90 95 371099
2/ Decemoer preceding year.
4
45,275 6,485
18,790
14,446 9,457 8,641 6,246
46,200 6,355
39,845
17,820 9,518 7,040 5,467
47,170 6,357
40,813
16,473 10,268
8,183 5,889
45,970 6,020
39,949
15,379 10,124
8,234 6,212
2,192 2,750 4,942 2,461 2,427 4,888
15,863 20,746 36,609 18,134 17,917 361051
40,670 5,194
35,076
12,773 8,777 7,823 5,703
41,240 5,684
35,556
14,986 8,779 6,585 5,206
41,840 5,578
36,262
14,665 9,004 7,298 5,295
42,890 5,708
37,182
14,899 9,362 7,523 5,398
2,027 2. 411 4,438 2,227 2,397 4,624
14,438 18,096 32,534 16,460 17,803 341263
42,250 6. 011
36,239
13,822 9,048 7,759 5,610
45,645 6,263
39,382
17,509 9,481 6,929 5,463
46,030 5,839
40,191
15,877 10 ' 195
8,305 5,814
44,150 5 ,638
38,512
14,808 9,892 7,899 5,913
2,154 2,782 4,936 2,422 2,377 4,799
16,040 21, 194 37,234 17,836 17,663 351499
5
40,070 5,446
34,624
12,437 8,561 7,769 5,857
41,915 5,771
36,144
15,437 9, 187 6,361 5,159
43,180 5,550
37,630
14,957 9,209 7,835 5,629
42,420 5,348
37,072
14,231 9,502 7,606 5,733
1, 964 2,481 4,445 2,259 2,316 4,575
14,288 18,814 33,102 17, 158 17,420 341578
39,680 5,220
34,460
12,701 8,427 7,580 5,752
41.650 s;397
36,253
15,168 9' 100 6, 545 5 ,4 40
41 ' 820 5 ,37 7
36,443
14,630 8, 820 7,406 5,587
41,100 5,258
35,842
13' 641 9,240 7,367 5,59 4
1,955 2,420 4,375 2,191 2,265 4,456
14,690 18,762 33,452 16,941 17,255 341196
9~ 94 99 93 87 96 98 95 100
99 92 102 96 93 98 97 98 98 101 103 98
101 91 99 95 86 94
102 92 100
101 87 98 104 96 99
99 94 103 104 100 lOS
100 91 97 96 92 97
101 9 1 97
100 92 98 98 87 96
101 89 95 106 96 99
96 93 97 92 93 98 96 93 97
92 92 96 99 93 97 98 93 97 104 95 98
96 91 100 100 87 98
99 89 98 98 90 97 94 95 98 96 93 97
102 92 103 104 89 100 103 C)Q 101 103 95 99
97 98 99 100 96 99
GEORGIA BROILER HATCH UP 5 PERCENT
GFR-85-Vol. 25 U.S. BROILER HATCH UP 6 PERCENT
The November hatch of broiler-type chicks in Georgia, at 53.5 million was 5 percent more than the 50.9 million hatched in November 1984. The 643 million hroilertype chicks hatched January-November was 5 percent more than the same period last year.
Nationally the November 1985 hatch of broiler-type chicks, at 379 million was 6 percent more than November 1984. The 4,386 million hatched during JanuaryNovember was 4 percent above the same period last year.
Item
POULTRY IIATCIIING AND PLACEMENT--NOVEMBER 1985
7. of
Nov.
Oct.
Nov.
year
Jan. thru Nov.
1984
1985
1985
a so
1984
1985
--Thousands--
--Thousands--
/. of year aBo
Pullet Chicks Placed
Domestic (U.S.) 1/
Broiler Type
2,943
3,182
3,284
112
36,128
37,093
103
Egg Type
203
238
166
82
3,295
2,765
84
Chicks Hatched
Broiler Type
Georgia
50,916
56,373
53,472
105
609,993
643,282
105
United States
356 ,782 382,630 379,121
106 4,199,239 4,386,264
104
Egg Type
Georgia
1. 655
2,934
2,891
175
36,807
28,637
78
United States
30 ,1 42
33,166
33,228
110
431,432
371,653
86
~1r kevs
Poults Placed
u.s.
11,919
12,240
12,727
107 2/31,392 2/35,726
114
1/ Reported by leading breeders, includes expec ted pu llet replacemen ts from eggs sold
during the preceding month at the rate of 125 pullet chicks per 30 dozen case of eggs.
2/ Turkey poults placed Nov. 1985.
I tem
Chickens Egg Type Broiler Type
Turkeys
EGGS IN INC UBATORS, DECEMBER I, 1985 ~NITED STATES
1984
1985
7. of Year Ago
Thousands --
25,616 332,067
15,371
31,416
123
349,623
105
17,909
117
Georgia Hatching Other
Total Georgia Total U.S.
~UMBER OF LAYERS AND F.GG PRODUCTI ON, NOVEMBER
No . Layers on
Eggs per 100
!land-Nov.
Layer s-Nov.___
1984
1985
1984
1985
Thousands
Num b e r
1985
Total Eggs Produced
During Nov .
1984
1985
Millions
5,178 13 ,72 7 18,905
283~4l
5,281 12,840 18,121
2~0~296
I ,800 2, 103 2,021 2,022
b
1,836 2,076 2,009 2,020
93 289 382 5,742
97 267 364 5,662
U.S. EGG PRODUCTION
Eg~ production for November totaled 5.66 billion and included 5.07 billion table type eggs and 589 million hatching eggs. All layers on December 1, 1985 totaled 280 million, 2 percent less than the 286
million a year ago. Layers on December 1 consisted of 247 million for table eggs and 33 million layers for hatching type eggs. Rate of lay on December 1 for all layers averaged 2,020 eggs per 100 layers, compared with 2,022 a year earlier.
COMMERCIAL POULTRY SLAUGHTER 1/. NOVEMBER 1985
4 of
Nov.
Oct.
Nov.
year
Jan. thru Nov.
Item
1984
1985
1985
ago
1984 _1 __ 1985
- - -Thousands- - -
- - -Thousands-
Young Chickens
Georgia
42,274
57,085
51,949
123
489,136
588,483
United States
332,157
383,016
342,768
103 3,946,742 4,076,363
Mature Chickens
Light Type U.S.
12,110
8,936
9,350
77
138,323
128,923
Heavy Type U.S.
2,458
3,248
2, 187
89
31,915
32,850
Total U.S.
14,568
12,184
11,537
79
170,238
161,773
Total All Types, Ga. 3,054
2,115
2. 149
70
35,001
30,654
Percent Condemned
Young Chickens
Georgia
1.2
3/NA
2/1.4
3/NA
United States
1.5
1.6
2/1.5
2/1.6
1/ Federally inspected slaughter data as collected by Meat a nd Poul t ry Ins pect i on
Program. Current month data estimated b y Market News Servi ce . 2/ January-Oct.
condemnations. 3/ Not available.
4 of year a2o
120 103
93 103
95 88
HOGS AND PIGS : INVENTORY NUMBER , DECEMBER 1, SOWS FARROWING AND PIG CROP
UNITED STATES. 1984-1985
1985
Item
I 1984
1985
as ;~ of 1984
Item
198 4
1985
1,000 Head
1, 000 Head
Dec. 1 Inventorv
Sows Farrowing
All Hogs & Pigs 54,073 52,298
97
June-Aug.
2,955 2,848
Kept for Breedi ng 6,933 6,780
98
Sept.-Nov.
2,902 2,819
Market
47. 140 45,518
97
June-Nov.
5, 8 57
5,667
1985 as /. of
1984
96 97 97
Market Hogs & Pigs b~ Weight Grou~s Under 60 Pounds 60-119 Pounds 120-179 Pounds 180 Pounds & Over
18,071 12,013
9,610 7,446
17,295 11,698
9,319 7,207
Sows Farrowing
Dec. 1/-Feb.
2,563
March-May
3,131
Dec. 1/-Mav
5 694
1/ December preceding year.
2,542 3,026 ') 569
Pig Crop
Dec. 1/-Feb.
96
March-May
97
Dec. 1/-May
97
97
June-Aug.
Sept.-Nov.
June-Nov.
99
97
Year
98
7
18,757 19,095
102
23,646 23,435
99
42,403 42,530
100
22,346 22,005
98
21.83 7 21,471
98
44,183 43,476
98
86,586 86,006
99
COLD STORAGE STOCKS, UNITED ST!\TES I ::-<OVEMBER 30, 1985
Nov. 30, _ r.ommodit~v ____________________ 1984
Oct. 31 1 !985
No v. 30, 1985
Perc ent o f Nov. 19 84 Oct. 19 85
1 ,000 Pounds
Percent
3utter
135,896
2'31,598
207,'312
62
90
Cheese, Natural
1,044,222
891,829
874,985
84
98
F.ggs, Fro zen
: 6,187
15,134
13, 8 12
85
91
Fruits, Frozen
732,490
8 19,923
78 9 , 471
108
96
?ruit Juic.es, Frozen
891.560
1,075,899
978,941
110
91
Meats, Red
687,385
645,822
6 31,218
92
98
aeef, Frozen
346,061
294,905
301,2 8 9
87
102
._, Pork, Frozen
269,444
278,131
264,147
98
9)
- ~' Poultry, Frozen
Turkeys , Frozen
"w ' ~ .M JI ~ -c
V e ~etaoles,
Frozen
329,505 195,650 1,986,389
665,508 484,050 2,299,599
378,894 208,238 2,192 , 329
115
57
106
43
110
95
a--- Ul a:
" ::' :J~ ~ [""'-
Potatoes,
Frozen
Peanuts, Shelled
884,232 268,923
1,014,193 302,316
1,023,248 302,208
116
101
112
100
a:
ITI
@ - LI'J
Peanuts,
In
Shell
22,569
27,343
26 , 902
119
98
~C!l
0 1Pecans, Shelled
~-I:(] Pecans In Shell
18,578 36 6 59
17,685 10 546
14,025 39 345
75
79
107
373
~
0
~- r-=1
~ ru !!!!!!!!!!!!!!! -------------------------------------------------------------------------------------------------------------ITI
n
Geo rgia Crop Reporting Service
SECOND -C LA SS POSTAGE PAlD AT ATHENS, GA 30613
Stephens Fede ral Bldg.
Suite 320 Athens. Georgia J 0 61 3
0 ' M_ 1 : I
f
TS
J '" "-' '
,.. :. a. ,