- Collection:
- Georgia Government Publications
- Serial:
- Georgia crop reporting service.
- Title:
- Georgia crop reporting service [1959]
- Creator:
- Georgia. Department of Agriculture. Crop Reporting Service
- Contributor to Resource:
- Georgia. Department of Agriculture. Crop Reporting Service
- Publisher:
- Athens, GA : Georgia. Department of Agriculture. Crop Reporting Service
- Date of Original:
- 1959-12-30
- Subject:
- Georgia
- Location:
- United States, Georgia, 32.75042, -83.50018
- Medium:
- publications (documents)
- Type:
- Text
- Format:
- application/pdf
- Description:
- 1940/1941-1974.
Issued in various sections.
U.S. Dept. of Agriculture Agricultural Marketing Service, University of Georgia College of Agriculture, Georgia Agricultural Extension Service, cooperating.
Split into: Weekly hatchery; Georgia farm report; Farm labor; Monthly poultry summary; and: Livestock report, weekly hatchery. - External Identifiers:
- Call Number GA A400.C7 P1 C7 1959
- Metadata URL:
- https://dlg.galileo.usg.edu/id:dlg_ggpd_i-ga-ba400-pc7-bp1-bc7-b1959-bfolio
- Digital Object URL:
- https://dlg.galileo.usg.edu/do:dlg_ggpd_i-ga-ba400-pc7-bp1-bc7-b1959-bfolio
- Language:
- eng
- Holding Institution:
- University of Georgia. Map and Government Information Library
- Rights:
-

'l.5
~
GAG~RIQ~U~LT<URGA~.EfXATEdNSCIO~N SREtRV.IC1E i-J-;!iP- 1-p]~1rllU,NS'. OGEP:ARST~ME1~TRO{F VA~IRICl'J<LTdURIE
",
,:
.UNIV~RSITY oP. GEORGIA A.Ni). THE . ;
. AGRII,;ULTl'~AL MARKET(NG ~ER\(ICE
, ,STAT!; OE~ARTME~TOF.~~~lc;UhT.Uft~:: i .:. ~,~ " . . ' .
319 E><TEN.C;ION ~LDG A;rHIi,NS, ~A.
BROILER CHICK REPO:R'r' tOR. 'dE;ORG~,A" , . I"
"
Jah uary i1-: ~)9~9
..
f,'"
i"
~. .
"
... f
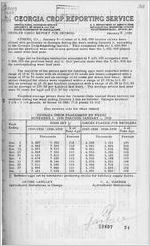
, A THENS . GA., January 7 - - AI total of 5, 862, 000 broiler c~icks ~ere i
placed \y-ith prqducers 'in Ge()r.gia .dqrillg -the week ending January 3. aq:ordi/:1g to the G~orgi.a pr6p/R&partihg,.d.ervlce ::. :this c.ompar.e,s with .the J 5. 40~.:OOO ~
p~aced tl;le p~evious week an'd '~.s: nine ,per~.ent mor.e than the 5. 401, 000 ;pl~~e<l1
the same wtfek .last y e a r , :.
;
,
.i
i
I
;
.'
I
! ... "
..... \
...
N'
....
".
....~,
..: E~~s ~et ,bY-.~,e,o'~~:~~I:h~t~h.~~~.~ ~: a:l?;?~1'l~ed.,to
..-.'
I'
;
~ 19, OQO; .compare4 ,w.ith:
7,844.000 the prevl'ous ,week an,d'ls; i'ou:-'percent more than the 'J. 361. 00,0 f9r
,I,, ...
i '.~
tqe correspqhding week 1asty-ear. :'" ,
.
.~. T~e n~ajdrity .?f ~h~ .'pr;~~~~P~lf!l f,?:r _h~tch..ing .egg~. we:re' re~orted .withi~ a
". rang-e of 50 to 10 cents with.an aver{Clge"o 6l.:~ents per. dozen.. compared with a
range of.57 'to 70 cents flond ap.,average 0(.64 :ce.nt.$ per dozen laDt weel<~ ~o~t
price s charged; for chicks were rep~rted within a range of $7. OO~ to $11.00
. w~tb, .an ~ver.age oCf.9. 5~ per. 4un.ch~d,. c.9mp~x:e~.Wi~h a range. of $9.00 to $11. 25
and ':an ~yer~ge: ofJ ~01>50 .p'e~ t~:~!l~~e.4. 1a~t .wee~: ~'. ,!,h,~ average pric.es Jas~ year
were
76:>,c
e
nts ~:~
for
~
eggs
~a..n
1
:i
$13 .. 50 "~....,..
f~o...r. ch,l.cka,
~_
._
. , ... ". . :
I
~ ;'
:
Weigh~ed:- average price s from the ?ederal-State Market News' 3ervice., for '.
....
,I
bro~~ers-during ttle wee.l5 E::~ding. fa.Quar,y} "a~~ ;asf.ollows.; G~orgia. broilers,
2. 3/4 -'3 3/4 Pounds . at {arms ,14~08f; ..1"'0.8 plants 15 ..01,
I r ':
.. :j."
,Ii ' . I, .
(See reverse side for other states)
t.
: ..
o
Week ~ncUng "
j
~ ..
,
I'iov~ I
Nov: 8' Nov. l~'i Nov. 22 lI1ov. 29 Dec. 6 Dec. 13 Dec. 20 Dec. 27 Jan. 3.
l."
"
.... ; "; . . . . . ' ..... : . , ' . '
.,'
,"
r"
.
I' :GEO~GJJ\ OI{lQ:K '~bNc:;E~NT .B.y. WEEKS : - :., .:
.,
NOVEMBER 1,' 1958: "rHROUdH: JANUARY 3. 195'9
: ... '
EGGS'SET 1/
II . CHICK3 PLACED: FOR :BROI:~,..ERS;;
:; '.'19'57 ~:1-9 58 {-1~9 ~~Jl(>'59'T-; t?o::of.: ~:.: i 9-57 -195B::19-S8-!19 59 - -7o-~r:
1
: ,
'
-, 0' , ... -
..
'" : Year Ago
.
~
..
.
Ye:ar ~Ago ".
I
Thousand'~
Pe;~ent
Thousands
1 P~rc~nt t.
:6,5'.81'.;:: "'7~ 3'94 ": ~. :lli.: ::" .~ A; 882 'I ;6, 5'42 ;.~- ., 7.'. $49 ~ .. 'qs' ~. .' 5; 091'
{6,871 .... 1';3''11'0 . 106 - "4.923
,6.868 '6.653
I 7 524
110
7,832' 118
. 4.955 4,993
.6.478
7,420
115
5,036
:7.000
8. 146
116
5,076
"7.033 ~6, 890
I 8,092, 115
7. 844
111
5,094 5. 172
i7.J61 ..... :.7...6.l9 .. ,)q4,., . .. 5,401
5.1:21
'oo .~05
\
5.0.95
)oq
!!
5.0.16
f04
5. 1196
105
5. ::3'20 1 lOt
5,3:88. 10~
!
t :"
5.2:55' 104
5,1.34
III
\
5, 404.~
104
5,8J62:.:~ J 109
.. I' .
:' ' "
!! 'Inc1udes'.'eggs 'set
'by
hat~h~~ie's 'pro:du:cing ~hicks'for 'hci:tcher;y
.
.
supply flo~ks.
_. \ r ...-:.
.:~. ARCHIE 'LANG~EY >' .
-.
. .'
... \~. A .. W~G!"{ER ;
I'
!
~gZ:i.cu1~ural S~ati~tician in .~harge : . "
Ac,riG:.ultura1 Statist~ci~n I
,,~. t .,... ::.,' ~,
"I
~ ~~I '.
; -
;.:- :.~ ~ i
_~ ", .
.~
~
I
f ~:;
t ':
"
..'
. . ',.. ..\ ~..
'-', .,' :r' .':
;,
~
... .,'
:
-- ;',.
.-.:,',J
..
,.
:"",
':$':B807 94
.1
EGGS SET' AND CHICKS' PLACED 'IN COMMERCIAL AREAS, BY W'EEK~ - 19-5-8 & 1959
0
1-'age 2.
STATE
~"aine
Connecticut Fennsylvania Indiana Illinois ~~i s sou-ri Lelaware Maryland Virginia West Virginia North Carolina South Carolina GEORGIA
l'~lorida
Alabama Mis.sissippi Arkansas Louisiana Texas Washington Oregon California
Dec. 20
Dec. 27'
I
,:1I
Jan. , . - .'-. ,.- , ';,1I "Nov.
,,< :,3
ii 1
!1
EGGS SET - '-THOUSANDS
I,1'
. W ~ek E:nding
i~ '
,
I~'
I i-F Nov. : f Nov.
8
15
I
"
1, 373 1. 101 1.426 I, 547
346 1, 787 2,068 2, 505 2,115
278
3. 169 624
8,092
I, 33~, 1,075 1,204 1, 56~
31'1 1,706 I, 978 2,237
1,969 263
2,928 561
7. 844
.;
I, 4~8 1, {)~9
~I
I
Ii
i
1: 033 416
1, 094 470
1, 099 382
1, 477
I: 768 .' 814
8-25
' l I, 618 "2$0' ; ... 1,: 649' " '-,
1,:997 " ". ,"
. 'l
Ii.
IJ ' .
..,7la077
'j 535
1, 813
2.-..:'430
.I! 1,570
79~ 797
180
6~5
-...
173 ,:,6,54
1,293 " 1,. ~93
1, ,927 ' , r;' 871
2,O~4
285
Ij
I
I
894 ., . 796 ' . 878
571
61i :'574
2...946 '522
,i ::2,3-07
' I~ -
.
'.-' fl 297
Z;416 ;321
2'-~94 :
: ;' 364
7,'"619
!I 5, 121 5,095 5,oi6
458 3. 375 2,:653 3,.703
674 2: 868
396 430 1.522
368 3, 322 2,664
3, 590 64-5
2.689 342 445
"
1,643
356 3.47.8 2,'451' ..' 3,'534
'644'
2,7?2 ' -400
431
.-
1,5?7
"
'. .
l:1
213 .2,496
" ~ ;. - J.. II :-'"'"} , :6-68
,i1 -,~'...
1-,2 465 r ' !"3-S7
2.143
I
::
298
;i
I';
..
140
!i 8"19
185 . , :. it)}
2,654 2._~8
i. 0-54 1, 727
2.3'08 2,'463
367
3..94
2, 158 2, 269
236 - 2'73
f61
'1:64
8.36
,812
,,' Nov. '1
22,"
Dec,.
13
..
CHICKS
FLAC'ED
,~
"
THOUSANDS
,
"
.
~
1,07'5 _
560., ' 818 4
797 17~ ... 616", 1,:580 1, 746,
""'941 468 2,359' .36-.9 5.)9'6 ..
192 2,685 1,79'6 2,550:
38'3 -
2, ,321' 289 )68
861*,
1, 015 1.042
5,..84
:522
857
'856
86l-'
81.'0
127'
143
7.36. . :65-6
1,605. 1, :.64..5
1, 551 . i,.6~3
1,0'08. ' -l, 00.6
481
506
21444 2,439
381
347
5,,: 3-20.
<,
..
5, '3~-8
,-
2.45' '; 24-9
2,650 2,628
L . 8'30- .; 1, ,903
2;-.723.: 2 '9.i'l 4:46 " 457
2,302 i, 165
270'
308
138 -= :? f9
779 - ~ 95,-5
1,,125
567 .. 953
"9,~13
' 163
6-96
C' 598
1,7'43
' 9.~8 .490 2.475
342
5, 2'55
237 '2,'773 1,972 .2. 999
~ 506 ' 2~ 211
Z59 "
'254 " . '8'78
"
Dec. .} 20 j
1, '142 : 560 '
911 .. 819 .IS,S :,
:.. ,'122 .1,:62-4.' .1,998 '1,076,
51.1, 2. ,480 ,. 361 ' 5,734 :
: :215 2,863 ' 2~ 000 ",:
~,04b
449 2, 126 :.
298,
~42
789
l' Dec. ,27 .
"
1, 147 601 714 743' 142 665
1,692 1,852 1.090
562 2 . 081
,331 5;404
211 2, 366
. 1','9~6
3, 12l '.. .. 398'
2; 105
2~8
238 ' 861 ..
Jan. .3
1,,211 669 873 772 1:49 6'85
2~O46
1, 840 1, .Q 14
_6:01 2, 578
"324 5,.862
298 2,871 1',999 3, ~51 ( 470
i-; 277
,269
- 236
1,052
TOTAL 1958-59 ~ 42, 510
I TOTAL 1957-58 i 36, 814
I
0/0 of Year Ago I 115
!
: ~ReVised.
,
40, 684. 41,047
36,170 11~
38,,14, 4 108
II1126,758 -27.032 27, 171
, ' 1,23,644* 24,205 2~,456
:,.I,I' .,' 113
1~?
III
I
28, OO,4~ 28,353. 28,878
.. 24,601 24',462 :-24, 828
:
)l~
116
i16
, "
29,427 '3-0, 121 28. -5i9 t. 31:. ~4 7
~5,320 .. 25,968 : 25,293 26,741
116
il7
'113:
117
3.
tGIE(Q)~CGllA CI~(Q)r JErr;:rCC))JRtIrllW(G ~JE~VllCE
AGRICULTURAL EXTENSION SERVICE UNIVERSITY OF GEORGIA AND THE STATE DEPARTMENT OF AGRICULTURE
.
1I. ~. DEPARTMENT OF I-\GRICULTURE AGr!ICULTURAL MARKETING SERVICE 319 EXTENSIOllII3LOu., ATIIEN~. GA.
January 9, 1959
FARi"! PRICE REPORT AS OF DECEr1BER 15, 1958
GEORGIA~ The All Commodity Index of Prices Received by Geo~gia farmers dropped 3 points (about one percent) compared with its 1910-14 average during the
month ended December 15, 1958. The index at 257 is 11 points or 4.5 percent above the level for the corresponding date a year earliero
,The All Crops Index, at 275 of its 1910-14 average, dropped 2 points (or
about one percent) during the montho Small declines for cotton, pecans, and
peanuts were responsible fnr this decline. Compared with a year earlier the
index is up 16 points or 6 percento
'
The All Li'i7estock and Livestock Products index dropped h points to 219 per'"
cent of its 1910...14 average. Lower prices for hogs, chickens, aggs and \'lholesale milk all contributed to this drop. The index is up 2 points or 1 percent compared with a year earlier.
UNITED STATES: The Index of Prices Received by Farmers dropped 2 percent (5 points) to 246 percent of :.ts 1910~14 average during the month ended
December 15. Primarily responsible for the decrea.se were lower prj.ces for cotton,
citrus fruit, tomatoes, hogs, eggs, and milk~ Host liaportant increases were for corn and tobacco. The mid,December 'index \'las slightly more '~ha'1 1 percent above
a year earlier. The 1958 annual a.-.rerage was 255 compared with 242 for 1957
The Index of Prices Paid for Commodities and Services; including Interest, T~~es, and Farm Wage Rates (the Pa~ity IndeY) for December 15 held at its a1~time high of 308. Major changes during the month were lower prices for food, clothing, and feeder livestock, and higher prices for feed, tracto....s, and farm supplies. At
the year 1s end the Index t'laS 3 percent above a year earlier. The annual average of 305 compares ~dth 295 for 1957~
As a result of the dec1ire in the prices received index during the month the Parity Ratio dropped 1 point in December to 80, the lowest since February 1957.
_ _ _ _ _ _ _ _ _S~a!y_T~ble_f~r_t!!e_UEi~eE.~t~t~s
Index 1910 -14 ~ 100
:December 15, : November l.~,: December 15, =
: 1957
: 1958
:
1958 . ~
.
_
~e.9.0.!:d_h~g.!:! _ Index ~ Date
Prices Received
243
251
246
313 Feb. 1951
Parity Index 1/
299
308
308
308 ~/Nov. 1958
Parity Ratio
81
81
80
123 Oct. 1946
~rhi~e~ "Paid: Inte;e;t: Ta~e~,-a~d-W;'g;Rate~ ba~ed ~n-d~t~ fo; th; indi~ated - -
dates ..
g/ Also December 1958
--------------~---------------------------
ARCHIE LANGLEY AgricultUl'~l Statistioian In Charge
vlILLIAM Eo KIBLER Agricultural Statistician
PRIc;S IiECE~D BY FARMERS DEC?.J.til:i'ER 15, 1958 WITH COMPARISONS
!I - - - - ' - , -
COM/lODITY
... .AND UNIT
Average 1910-14
Gt:ORGIA.
Dec.15,
f;Y--,5_'L_- 1958
Average 1909_14
UNITED STAT~'S
D1e9c5.7~5
1958' .
D1e9c5. 18 5 ,
.
Wheats Bu.
$ ;1.,.23
1.95
, ..88
1.94
1.74
1.73
Corn, Bu.
'"
~,
'"
Oata" Bu.. ,",
$,
Irish Fot.,Cwt.
$
Sweat Pot. ,Cvrt.
$
Cdttoll, 'Lb.
..,'.
Cot,tonseed" Tpn ,- ~
Hay,A11,(baled)Ton $
~og's, per' Cv.'t. '
$
Beef Cattle, ~rt. $
Milk Cows, Head
$
Chicken0 ,All,Lb.
~
\'
~,
Eggs, Doz.
: ': '
Butterfat; tb.
- Milk (wholesale), ",
per 1Oi})
$
.91
1.19
.64"
.98
.94
1.02
.67 '1.13
.84
12.1
;::3.-65 : : 41.00
26.00
I 70'36 'lff.CO
.~6. 3 I 14,.60 33 .S5 1;~.0~
13.3
16.0
1
I
I 27.20
18.90
I, IS .60
I' 160.00
,15.0
.'
~:
.94 II
.40
.e2
5'-.~0"
I
'"
1.14
, I'
I
I 1.60
,J61 5.04
,
34.2
II
12.4
I
J 28.2
,
[
1 I .. ',5~.00 I '22',55 ' (' 50.'50
"27.5
19.20
18.10 I 7,.27, '19.10 ;11, ',' '; .~2 .
,
160.00
III
48 .co
I' ,14,.0
11.4
17.SD,18.60 178.00 , 1~.9
.57
1~15
3.35 32.4 .. 43 ;50'
..
18.20 .'1.7' .90
22.20' 222.00' 15'.1_ '
.59 1.16 4.54 30.3 43.00 18.80 17.40 , 22.30 225.00 14.7
~1.4
.' 54.1,': 46.0,:,
25.8 I 50.0 J, 51.0
2.43
"tIt..,;
,
5,71
'(/1/' 1-,6.00
, '45.5 ,51.0
2L5
44.2
38.3
36.3
26'.~, "I 59.~'" - " 58..5,l, 59.1
I " 'r/ ", IU , 1 ~60
4.51 l/ 4.50 ' 4.41
Soybeans, Bu. Peanut s, LQ ~
_. -i/ "Revised'. 2/ Pr~ elimina:ry:'.,
- -==: ~--:;::=-=-,-~
,
"
,4.~. 1~:7,. --, J' <?06 : .. ' ,1.89 I 10.8
1.97 10
s
~ . ... '"
INDEX NTh~ERS OF PRICES RECEIVED BY FARMERS IN GEORGIA
(January l~nO _ De9emb.er 1911 = 100)
,
'"
-
,'Dec.15, Nov.15, Dec.J.5"
" ',1957
_.
1958' 1958 ,~ ' T
All Corrmodities All Crops GraiAs ~d Hay Cotton Lint ' Peanuts Tobacoo Cottonseed and Soybean s , , Irish Potatoes & Sweetpotatoes Fruits and Nuts
All Livestock and Livestock Products Meat An:iinal s Poultry and zggs
- - - - -Da.iry Products
,246
,'J.
259
148
,240
192
449
.171
254
205
217
'289
153
'2~0
260
257
277
275
148
.150
284
2el
202
i98
443
443
22408e
"
,r
2C8 259
167
163
223 , j , : 219
328
324
135
129
238
, 234
.
.,
.',
PRIcE'S PAID BY FAR!'iERS FO~ sELECTED FEEDS DECEMBER 15, 1958 WITS CCMPARISONS 1/
;sr:: GEIR~: ~ec~5.-!-l:~~ KIND OF FEED
- - '
.if .15 _I Nov .15 _I Dec 15
.15 _
1957 ,1958
1958!1 ~7 I 1958 ~j __ 19~~
f ,'" ,
1
.' ", ", Dollars per .~OO, p~un~~,I,
~~ir-ed Dairv Feed: All Under 29-% Protein 16% Protein 16% Protein 2~ Protein 24c;~ Protein
H_~h Protein Feeds Cottonseed Ivleal Soybean Meal Meat Scrap
~in By_Prodccts Bran Ivliddl ings Corn Meal
3.80 3.70 4.00 4.00 4.30
3.45 3.75 4.55
3.20 3.35 3.30
3.95 3.85 4.20 4.00 4.30
3.65
-3.95
3.15 3.35 3.20
I
I 3.90 3.80
I 4.20
3.60 3.56 3.51
I 4.05
3.80
I 4.50 Ii 3.90
i
I I
I
3.70 3.95
- i I
3.68
3.71 4.69
I I 3.25 I 2.53
I 3.50
3.25
2.70 3.22
I
3.63
I 3.57
I 3.55
I 3.83 3.93
3.74 3.68 3.54 3.9(,
4.0G
i
I I 3.82 4.05 5.72 I
4.02 4.27 5.78
I
I
I 2.76 I 3.05
I 2.87 I 3.12 3.16 I 3.18
Poultry Feed
Broiler Growing Mnsh Laying Iv'l3.sh Scratch Grains
4.95 4.70 4.15
4.95 4.70 4.15
I,I
5.00
4'.81.
I 4.75 I 4.28
4.15
3.91
I,
I 4.88
4.36 3.87
4.94 4.45 3.87
~ (Baled) AJ,falfa .".,.l_1. Other
l/ As repo:-ted by Feed Dealers ..
I 1
48 38
00 .00
40.00 31.00
I45.CO 31 10 35.00 11 28.70
I I I 29.00 27 .20
30.00 28.30
I
- - .
L..II.-:.L-.Ll.:I..n.u ~/,JV
CGJE(Q)~Gllh (C~(DJF ~lElP(Q)~1rrrN~ SlEIRfVllCJE ..
. ..' . .:
. \'. .
~..
~.
AGRICUL. TURAL EXTENSION SEHVICE .
UN/V"=;RSITY OF GEORGIA AND t:HE STATE:'DE~ARTMENTOF. AGRIC.ULTURE
1}.t.h~n:s'; .Geo.rgia. , .
: "U; 5, DEPARTMENT OF AGRICUL,TURE
AGR.ICUl.TURAI,. MARKETII~G SS'.RViCE
319 EXTeNSION SLOG" ATHENS, GA.
UNNf i1 Jam. M.-T~0',12, ..19,59'
.,
,":;
0
. . ~. .~
,..' :_ .',4-,'., "0...:
...:" ,'., VEGETABLES 'FOR'FRE$H MARKET
.~ ,'.
~
....
I
, :January 1; ,'1959.' ,
:.1959 UNITED 'SfJ...TES} Pr~duction of w':Lntl3r v(;geta~i~s 'in
"~s exp.scted, to ~e : 12 'Pe;~.:
cent 'larger than in 1958' but only :Cpercent above averago, the
Crop Reporting B9ard announced tod.ay. January,.l foreqasto point.to.a g-reatqr. produqt.f"6i1 or. all winter 'vegetables .than i'n 19.5A':excep:t for carr.ots,. ca\lliflQ~ier,.. oest's',,"artiSl1:o,kes,. Brussels, sp/outs a;nd "sl'J:Llotc. '.' 'A'i~ oi ,the 'c~'ops :Jh.ow.ing a lna- .
ter.i~l' ih~rease. 'over:' last year., except 'c,efery and i~ttuce, .are ,~roduced p,rinqi- .. '.
qI- pally epti,r~ly in li'J,.orida. The,largest 8,:xpe.cted incre.~se is .in thE?, production, .
of tomatoes, wnich is almost .three. titles ,thU1;.. in 1958.. , Last;.winter Florida lost
an extre'in.e1t ~D..r;ge.prGentage 01' vege:~8?1~. pr:aduc'ti~n' :because of: :p,oo,d, ~~ag~ apd',
repeated .:(re.ezes. C0lnpared 1.vith :werage" .estimated 1959 winter, production :!..S .... :
consid9ra~ly'large~'fbr c~~erY, es~arolo~ '~nd,g~een peppers; small increases .~e. i
in e;xpeet.e.d lettuce, ;.3VJeet cO~11 and oggplant. The . largest ,declines. fr,om average ~
were Tegister~:ct 'ror.' ~'arrots, .snap heal;1 s""cauli,flm18r,; cabbage:,' hro.ccoti and bee;ts'~,.:.
I ,~. . . , . ' .'
~~
..'
' .
,.
~.
....
"
"
!
~
t
')
I
"~
.,'
'..
I
" 'Fr:~ezinG' temper?-t\ire::> occ1?-rreu in most 'T~xas vegetabie ,are;as sever~,l ~imo~ .:i,n.
Decembe~ .: .' Btownsv'i~le w:=J.s the only, section csC;qpir..g., ,1"r'eezes, particularly .th,e, . one of D'ecember 16', ,ended grpwth of 'tend~r 'veget,ables, pu't' raQst of tl1es;e, crops. .
Here near 'col;1Pletion' of harvest' ai.1d loss of' proCiuc'-t:ion. w;as, ii.ght . l\.not.lier freeze '.;
dipped into all Texas areas on January 5 but the light drizzle ind.~et soils li.~t:.d:-.d~g'e'.. to,'}iE~~ t~p ~~n .....Maip.. .f:'f~.eit..~;il:J, b~i:.a .4elay in.hartrest .of'~=...,...
growing
v
e.
g
etable s. : "~
.
..
,"
.' :
.:. :'~T~~p~~~t~r;s':'~~PP~d 'b~lO~:f;~~:~i~~" i~ '~cC~b'e';'''~nd'~~i;'';~~~~ry' in rior'~h,
F:torid'a~-" Li'ttle: oi.' ho" daiitage-~'e.sult.e(Cas~ mO-5t 'of"'tnc-.vegetcible -acr"eage }s 10-' .
c'ated further south. Intermittent rains fell throughout December ~nd early J~u
aq. The heaviest were in mid-December. R.:lins advanced maturing of crops but ,'.
hindered harvest and made cultivation and insoct control difficult." Tomatoes' . 1vere' damag'e'd, by 'the' hea~ mid-month rains but' have about' recovered.:' 'l'.hQ overall' ,.
outlpok' ~s l1luclr :br.i'ghter .than 1;ast Y. e::ar' ~!,ien.. cr?p'Ei: ~({~rl, ~~.st ~I'oin ..floog.:ipg ~nd. '.
freezes:
_... ., . . ..
.
.
CABBb.GF:: T'h8 19,9 winter crop is forecast at 6,273,000 cwt., 3 percent ..above ~ I
,"last :y~ear but 4 percent below average. The indicated yie,ld' per aC:fe is slightly below last year and average whi:j,c the acr!3a;e for harvest i~ 6 per-, cent above 1958 but 4 percent below averaGe. Planting continues in al~ areas of
Florida. R~cent, rains have slowed ha:"vestine, and volun:~ is eXJ?~~te~~o '~nc~ease'
sea6onally,j The. Texas crop 'got started under unfavorab1e cond:Ltlon~ Ftnd :vms further. ,retarded by the cold spell ..around mid:"Decemb~r... Thr;,se' cold .temp'8Tcxture 5 ..... caused some leaf damaGe and slowed growth of all 'plants. Supplies durj:ng Dec(jm-' . ~
ber ''lere lighter than expected but volwne shoUJ.d pick up in January and continue
moderate",thJ:'.o.ugh Ma:rch.. Head.s have been running to small sizes but quality has
been good.~ . The Arizona crop is in good condition and of gQod. ,quality.. N[irketings.
or '. .,,1 .
"
... .
. .. . .
..
.,' .....' .
began in early' Decembcl' arld are expected to contiilUe in moderate volume through
February. Supplies are now increasi~g in volume from several California districts.
The bulk of the production during Ja11uary 11ill be moving from the Imperial Valley
and the Los Angeles area.
CUCUMBERS: Florida's winter cucumber crop is forecast at. 98,000 cwt., which is
31 percent below aver~ge production. Last winter the crop was a
complete loss due to the freeze. The small acreage for winter harvest in the lower ~st Coast and the Fort ~Wers-Immokalee area is only in fair condition due to cold winds in mid-December with some damage from recent heavy rains. Imports
from Cuba have been moving through Florida in volume.
i'!A.TERHELONS: Growers in Florida and California intend to have 92,600 acres of watermelons for late sprL~g harvest. This is 10 percent below the
:'9,8 acreage but 5 percent above ave~'age. Both States expect to have less acre-
~ge this year than last.
(OVER)
\"9-
~
OIUOHS: The early spring acre&ge 'of onions in south Texas is estimated at
34,000 acres;-2b percent above the 1958 harvested acreage but 8' percent below average. The 1959 acreage is 21 percent below grmvers" "'intentions last
fall. Heavy raD1S during the planting season left seme fields too wet until too late for planting onions. Most of the increased plantings over last year are in the non-irrigated areas of the LOlver Valley and Coastal Bond. Hore than the usual acreage in the Lower Valley was planted after mid-November and seeding con-
tinued into December. About 25 percent of the ac'reage in the LOvler Valley is ex-
pected to furnish production starting the first half of February but most of the acreage will be harvested from mid-March through April. Earliest plantings in the
Coastal Bend will furnish production beginning in late Harchu
Growers' intentions for late spring onions indicate 14,000' acres in 1959. This is 10 percent below the acreage harvested in 1958 and 5 percent belml average.
In North Carolina and Georgia, g~owers intend to plant less acreage than last year because of a discouraging marketL~g season. In North Carolina weather conditions during January and quality of sets available may also have an effect on the acreage planted. The dry weather through Dec~~ber in Georgia caused some growers there to reduce their acreage. Most of the acreage reduction in north Texas occurred in the Princeton-lIcKinney area where hail caused considerable damage last year. Wet weather in early December and cold weather later in the month delayed preparation of fields. Very few plants were moved into the area by Janucuy 1. Hoisture is mnple and planting can start in late January without any serious delay in harvest. Pllli~ting of the Arizona crop has been completed. 1leather conditions in California through December were too dry for good development of transplants. Most of the fields have been planted but some growers have held off planting until after rainfall occurs. The acreage at Stockton is expected to show an increase over last year.
Acreage and Indicated Production Reported to Date, 1959 with Comparisons
CROP
..tim
STtm
J~CrCAG[; ;roR H!.RVLST
I
YELD P~R i,Crr.::
:
PP.ODUCTIOU
.T.vcrc.Cc I
- t !lid. : IN.:
I .md. tk..-cro.ce t
: L"1d.
1949-57 I
19-50-I- -1-959-
I
;
/;'..'_;;- 7 I -19~-8 :
_ Acres _
_ Cwt. _
1959 t 1..C.-'4.9-57: 1958-t -19-59-
_ 1,000 cwt. -
. . . LETTUCE, Winter
Florida. .1 3,360
Texas
.: 11,820
3,700 10,000
3,500 III
5,500
97
65
100
374
240
350
60
75 1,119
600
412
Arizona, Yuma : 13,780 9,700
9,900 140
155
145 1,922 1,504 1,436
California I 34,810
Group Total. .: 63,TI 0
:
39,200 62,600
43,000 149
160
155 5,167 6,272 6,665
61,900 135
138
2.43 8,583 8,616 8,863
ONIONS
:
y y : Early Spring Texas: 36,760 27,000
Late Spring
34,000
66
'95
2,267 2,565 Mar.l0
North Carolina : 800 2,300
1,000
75
75
60
172
Georgia I
Louisiana :
Texas. Q
:
.. Arizona :
California
1,000 190
7,690 1,280 4,470
800
-
4,700 2,700 5,100
600
85
90
-
47
-
4,600
32
25
2,400 313
270
5,400 291
245
85 9
253 397 1,259
-72
118 729 1,250
May 11
Group Total : 14,710 15,600
14,000 139
150
2,010 2,341
!I 1959 prospective acreage. / Short_tTIne average.
ARCHIE LANGLEY ~p'ricultural Statistician In Charge
L. H. HARRIS, JRQ Vegetable Crop Estimator
.'
_ _ ~
~~
.. , ._ ... .......... ~~_.-r-<-'--'---
~
I -.. ...._~ I l.I-:l rrL.ll
..... .1- J V
CGIE(Q)~CGllA C~((J)1R?IN1J[~JfllJNG IE~Vll(c1E
,I
CRICULTURAL EXTENSION SERVICE UNIVERSITY OF GEORGIA AND THE STATE DEPARTMENT Ol~ AORICUL.TIJ~E.
JAN 1 5'59
IJ, S, UEPAPTMFN r OF ~.GRICULTURE
AGRICULTUR.'.l. MARKETING SERViCE
319 EXTENSION 81...0G-., A'rHENS. GA.
BRClILER CHICK REPORT FOR GEORGIA
LIBRARiES
January 14, 1959
ATIIZNS, GA., January 14--A total of 5,7h4,000 broiler chicks were placed
with producers in Georgia during the week ending January 10, according to the Georgia Crop Reporting Service. This compares with the 5,862,000 placed the previous week and is four percent more than the 5,519,000 placed the same week last year.
Eggs set by Georgia hatcheries mnounted to 7,904,000 compared with 7,619,000 the previous week and is four percent more than the 7,599,000 for the corresponding week last year.
The majority of the prices pp,1d for hatching eggs were reported l1ithin a range of 50 to 67 cents ~1ith an averag~ of 57 cents per dozen compared with a range of 50 to 70 cents and an avera~e of 61 cents per dozen last l-leek. ilost prices charged for chicks were reported l'7ithin a range of ~n. 00 to ;.~10. 50 with an aver~ge of ~;8. 75 per hundred compared Hith a range of ~:) 7.00 to ~~;11. 00 and an average of .:~9.50 per hundred last ~leek. The average prices last year were 76 cents for eggs and ::n3. So for chicks.
Weighted average prices from the Federal-State harket News Service for broilers during the week ending January 10 are as follows: Georgia broilers 2 3/4 - 3 3/4 pounds, at farms 14.58; FOB plants 15.43.
(See reverse side for other states)
GEORGIA CHICK PLACElvJENT BY lrJEEKS
" l l-Teek
. NOVENBEfi. 8 TImOUGH JANUARY 10
-
EGGS SET 1/
i CHICKS PLACED FOR BROILERS
I Ending I 1957-19,8
1958-1959
I ~~ of I
Year Ago I
1957-1958
1958-1959
]~ of Year Ago
Thousands
Percent II
Thousands
Percent
Nov. 8 I
Nov. 15 Nov. 22
Nov. 29 Dec. 6
Dec. 13 Dec. 20 Dec. 27
6,542 6,871 6,868
6,6.53 6,478 7,000
7,033 6,890
7, .549 7,311
7,524 7,832 7,420 8,146 8,092
7,844
115 I
I 106 II
I 110 :1
i
I
118 115
II
'I
116 I
111154 II
.5,091
4,923 4,9;;5
s4,,909336
5,076 5,094 5,172
S,095' 5,016 ;;,196 5,320 5,388 5,2.5.5 S,734 .5,404
, 100
102 105 107 107 10h 113 104
Jan. 3
7,361
7,619
104 I 5,401
.5,862
109
Jan. 10
7,599
7,904
104 I 5,519
5,744
101.~
i
.1
11 Includes eggs set by hatcheries producing chicks for hatchery supply flocks.
ARCHIE LANGLEY Agricul~ura1 Statistician In Charge
1pT. A. liVAGNErl AGricultural Statistician
STATE
~
IIII
Dec.
27
Jan.
3
EGC,s SET AND CHICKS PLACED IN CONI1ERCIAL AREAS.l. BY HEEKS - 1958 & 1959
----G----,------- I
_Week EndI ing
!
I I Il I II Jan.
1.
10 1
Nov.
8
Nov.
15
Nov.
22
Nov.
29
Dec.
6
Dec.
_13 I
~----~~
.t
Paae 2
~ ~.~---
Dec.
20
I-
I
Dec.
Jan.
27
3
Jan.
10
If
_.~
11aine
I
Connecticut Pennsylvania
II
I i EGGS SET - -TH~~SANDS - -II
1,3331,075
1,488 1,079
'I 1,446
1,198
I
1,094 470
1,204 1,477 1,406 . 814
Indiana
Ill~nois l~lissouri
Delaware
I 1,~_~~
II
1,706 1,978
1,~~g
1,649 1,997
1,~~~
1,694 2,086
I 795 189{*" 655 1,293
Maryland Virginia ~iest Virginia
I 2,2~7
I: 1,9b9' 263
2,4~O
2,0.')4 285
2,.454
i: 2,212 I, 290
1,927 796 611
--l- North Carolina
South Carolina GEORGIA
II 2,928
564
I
'I 7, 841+
2,946 522
7, 619
3,289 'II 2,416
561
327
7,
904
,I 5,095
-T'2J~~
I, 1,654 2,308
II
367 2,158
I 236 161
836
1,099 382 825 797
187~'(-
654 1,293 1,871
878 574 2,294 364
5.016
-"--
201 2,648 1,727 2,463
394 2,269
273 164 812
CHICKS PLACED - THOUSANDS
1,075 56o G18 797 189* 676
1,580 1,746
9~1
468 2,359
362*
5.196
192 2,685 1,796 2,550
383 2,321
289 168 861*
1,015 584 857 861 130,'(-
736 1,605 1,551 1,008
L~81
2,444 369-::-
5 J-
2~S
2,650 1,830 2,723
46?~~"~
2,302 270
lL~4~*"
779
1,0).+2
5 ,c/'3~"~
856 870 143 656 1,6).+5 1,653 1,006 506 2,439 347
5.'388
249 2,628. 1,903 2,921
457 2,165
308 219 955
1,125
1, 169~
1,1~7
567
56o
601
953
911
. 7,14
9h3
819
743
163
155
142
696
722 . 665
1,598 1,624 1,692
1,743 1,998 1,852
988 1,076 1,090
490
511
562
2,475 2,480 2,081
342
361
331
__ 5,255 --_5. 7.'31 .._-5--,-4--0- 4 .
237 2,773 1,972 2,999
506 2,211
215 2,863 2,000
3,046
449 2,126
211 2,366 1,946 3,122
39(},'(-
2,105
259
298
258
254
242
238
878
789
861
1,211 669 873 772 1L.9 685
2,046 1,840 1,014
601 2,578
324
5.86
298 2,871 1,999 3,251
470 2,277
269 236 1,052
1,180 531 78h 737 136 765
1,880 1,838 1,092
557 2,407
323
5,744
255 2,904 2,051 2,881
440 2,223
310 300 1,196
158-59
II 40,684 41,047 42,319
27,041-::- 27 , 185~~ 28,012* 28,373-)(- 28, 909~~ 29,427 30, 14&~ 28,521-)', 31,347 30,534
157-58
36,170 38,lL~4 38,984
24,205 24,456 24,601 24,462 24,828 25,320 25,668 25,293 26,741 27,022
-%-
lr Ago
.-'
112
f,- Revised
108
109
112
;
111
114
116
116
116
117
113
117
113
3;
~.JE(Q)JR(GHA CJR{O),IP.>
AGRICULTURAL EXTENSION $ERVICE UNIVERSITY OF GEORGIA AND THE S1"ATE DEPARTMENT OF AGR'ICULTURE
Athens, G e o r g i a . :
' ,JAN 2, 't:9
J
RN~',SE~VHCJE
. s.: DE p,ARTr,1E NT OF AGRICULTURE
GRICULTURAL MARKETING SERV1CE 19 EXTENSION BLDG., ATHENS, GA.
... .., January 19, 1959
GEORGIA 1959 TURKEY PRODUCTION EXPECTP.J) TO BE THE SAr'iE AS 1958 NATION UP 5 PJ~CElNT
GEORGIA: Turkey growers in Georgia are expected to produte 287,000 head during 1959, or the same as was produced last year, according to the Georgia
Crop Reporting Service. This 287,000 head is the smallest number since 1948 when production amounted to 196,000 turkeys.
UNITED STATES :Turkey growerl3 intend to produce -5 '.percent more. tllrkeys in 1959
,
than l'ast year. They plan :incr:ease9 of l~ p'ercent in light breeds
and 3 percent in the heavy breeds, with heavy whites up 18 percent but other
heavy breeds down 1 percent. If growers carry out their intentions, about 81.9
million turkeys will be raised, compared with 77.9 million in 1958. All regions
show planned increases except the North Atlantic and South Central regions. In-
crease& indicated are 11 percent i~ the.West.North Central, 8 percent ~n the
East North Central, 4 percent in the So~th Atlantic and 1 percent in the West. "
The North Atlantic region expects a deCrease of 2 percent, and growers in the
South Central region plan to raise about the same number of turkeys as last year.
Heavy breed growers intend to raise 67,740;000 turkeys this year-- 3 percent more than last year. Growers plan to raise 16,146,000 heavy white breed turkeys,' . compared with 13,678,000 last year--an increase of 18 percent. According to present' ,plans heavy white breeds will account for 24 percent of all.heavies raised in 1959, compared w.ith 21 'percent in 1958. All, regions ,show increases in heavy white breeds except the North Atlantic where an 8 percent decline is inten-
ded. Increases planned are 38 percent ,in the South Atlantic, 25 percent in the West North Centr,al, 19 per-cent in th~ East North Centr~, 16 percent in the West ~d 7 percent in the South Central" region.
Growers plan to raise 51,594,000 'bronze and other heavy breed turkeys in 1959, cQmpared with 52,098~000 last year. Compared with last year expected de- , creases of 14 percent in the South Atlantic, 4 percent tn. tne East North Central , and 3 percent in the'South Central region are partially 9ffset ~y expected in- . creaseg~f 5 percent in the,Nor~h Atlantic regio~ and 4 percent in the West North Central. Growers in the West plan about the s~e number of bronze and other . heavy turkeys as raised last year.
Light breed growers expect to produce 14,121,000 tU~keys, compared with
12,129,000 turkeys in 1958 - an increase of 16'percent. Growers plan increases
in all regions. Increases are 26 percent in the East North Central, 23 percent
in the West, 16 percent in the West North Central, 15 percent in the South
Atlantic, 7 percent in the South Central and 4 percent in the North Atlantic
States.
'. .
.
The number of turkeys actually raised in 1959 may vary from January 1 intentions, the difference d~pending on growers reaction to price of feed, supply and prices of ha:tching eggs and poult,S and the sale of turkeys remaining in growers' hands. In 1958 4 percent fewer turkeys were raised than intended on January 1. During 1958 there was an ample supply of poults throughout the hatching season. Feed supplies were plentiful. TUrkey prices received'by farmers during 1958 averaged about the sanie as the previous year. The turkey-.feed price relationship was slightly more favorable to producers in' 1958 than during 1957
CARL O. DOESCHER Agricultural Statistician
. ARClUE LANGLEY Agricu1tural ,Statist'ici,ai1" In Charge
,~ .',
','
.I
,;" ',',;
- ,.-
.
= .=':, =. INTE!JTIONS TO RAISE ',TURKEYS IN ,1959'
'. . .
;t~t~ .~.:T.:: .=. ,: :~~b~r:r~i~e~2':!928='~/~ -= ~= =IEt~n~e~-!o~,EI1~s1'ni 1n=1252".
. and
.~
. : . " . . : '.:
:
: ' .' ':
: Total 'rur..::-
Division;' : . i He~vy' . ' :'. Light , : 'Total : Heavy : Light I.: Total : ~eys 1959 as
:, ..: breeds. :,. breeds :"
: breeds: breeds:
:% of 1958
- - - -,- -Thousands~ Th~usands Thousands Thousands Th~usands ThousandS -'Percent-
he.
109
. 4 ' 113
86
2
88
78
N. H.
131
Vt.
71
2
133'
1
72
128
2
70 .'. ,. ,1.
130
98
'71 .:, 9'9 '
I"Iass.
462 ... ,' ,10, .: 472"
445.."8,'
453
96 "
R. 1. Conn.
. 27 ,.,' ,1,;., .28
2 5 : .1, . ' 26
93"
219
'6 .. ",' ,'225
210'.
.4
214
95
N. Y.
6il'
10
621
475
9
484
78
No J.
162
9
171
179
.9
188: 110
fa.
N. Atl. Ohio
1,213 , " 154; 'J:,367 "1,309.. 1.68 1,477 . 108 "~3~Q05~'~ ~ ~-i97-'~'J,2P2 - - 2~927 ~:~.,-:- -204- - 3,131- - - ....98 - -
~2-;404- - :- -: 7'"6,9:- Ti. 3;06"3. 'r ,- 2:,"741i - ~ -: -fYto - . 3,0113 - - - 1113 ~.:-
Ind.
2,315.
462 ?; 777
2,2)1 .,
601 .' 2,832
102
Ill.
968 ...' <.. 113" '1;081
955' . : 107 1,062
.98 ":
Y1ich.
894 . ' 149 '1,043
. 806 ; 201 1,007.
97
Wis.
,2,629 . '. 122 2,:7Si, 2,,886" '120 . 3,006 . 109 . .
E.N.Cent. -9~210-~' -, ~1~505'-' ~~O.,,7;i.5 - ... 9,626 -:- -- -1~8~5f ~11;52S -~. -108 --~
Y1inn.
:-9~125~ -; - -:i~i15~ ,-10,340 - -10, Iii2 -,.- -1;416- -11,868 - - - 115 - -
Iowa
Mo.
5,866" '" ," 875 '6,741. 6,082 3,038 ,.' ,; 18,8, '3,226 ,: 3~438
980 7,062 .' 105'. '
229. 3,667
' li4'
N.Dak. . " 682-' . " 24 " . 706:
787
25
812
'115
S. Dak, ..
621" .
. 46, 667
75'4
48
802
120".
Nebr. Kans.
1,032 " 71'2
. '20, .. 1,052 1',082'
' 36 ,. .748
724 .
20' 1,102. ,50 " 774
. '105 103'
W.N.Cent> 21~01q- - -:-2~404-.- 23~)+8d- --23,289 _. -:- -'2~798- ~2'6,D87 ,- - -111-,~
Del.
'":" -108- :-'- --397-:'- -:- ~555 - - 1013 - - - -5]:ej -, - 02"4 - ....'-124-,-
I1d
',' 237 :" 82 " . 319
.'197
'107
' 304 I 95
Va. W. Va.
2,003 486
4,401 968
6,404' 2,008
1~454
406
5,281 7,289
114
968 1;374 : 94'
N.C.
1,551, :. 184'.1,735 '1,3'59
11Q 1,469 I . ,85
S.C.
881. ,. ." 25
906
705,
20
725 "
80
Ga.
Fla.
5.Atl. Ky.
286
'.1
287
286 ,"
1
287
100
-- ... -. . 1-65- - - - - -90-
, '5,717' - ~343- 7'".-
- '6-,,1. '4284-
-
-
25"5, 165 -~1-,- 8- 65- '- -5~-23-4 - -3'ti7- - - 229 -
-
-
- - -90- - - -25-5 -, -
-
7,093 ' -, 16- -
1-2,3'22475
....
-
- ,1-0-0 -
- -16074 -- -'
Tenn.
41 a .
170
17
187
146
13
159
85
203
1 0 3 . 306
183 .' ,', '55""'" 238
"78 .....
Miss.
179
20 '
199
300
20'
320
161 ,
Ark.
2,033
348 2',381 1,917 ',' 313 2,230
94. '
La.
42
.. 0
42
, 32 .' '0"
32
. 76
Okla.
873 '
182 1>055 . 666
251 1,117
106
Texas
_32.38_.
4~0
32.7~8__ 1,.!6~
5~0__ 1,2.6~
~02 __
S.Cent.
Mont. Idaho
'Wyo.
Colo. N. Nex.
'u'iz,
Utah Nev. Wash. Oreg. Calif.
West
7,211 - - 19- -
1,094 ~ - - -1- -
-
8,
-
3
0250-
-
-7:-11491 -
~ - 1-,1-66~- - .-8,,-31099,-
-
-
100 ' :95 ~ -
,
'124 ,.'.. 20" .' 144 . 124
" 30, 154' 107.
, 6.
"I'
---
1,242, ':".' 13
69 " ".: 6"
100
., ,- .- , .
2;797 : .... ' 198"
6 " , '
1,255' 75
100
2~905
'6 . ' --" . :.', \ 6 100
1~577 ,. ,9,. '1,586." 126
76"', 6 . . 82,.: '. 109,
.' 90
.~--' " ;90 " . . 90
2~702
.297: 2,999'- 103
,2 , . ' . -,~
2
2
---
2
100
\508 ,.' 7
515
543
7
550
107
1,391
139 1,530 1,321
213 1,534
100
-1-3-,-3-8-9-3-9-7- -.-. ',-13-;7.8-6 - -1-3" ,06-3 - - - -3-97- -1-3-,46-0- - - - -9-8 - -
~92.527
~7~1~_ ~OL318_' .. !:92.5~3
929_ _2.Q,~8~
~O! __
U. So.
65,776
12,129 77,905 67,740 14,121 81,861
105
1/ Preliminary
. "
Ga
flD9tJ()
G-~
Ja~I~[) <Gl&(Q)~<GllA C~(Q)lP' JFRlEIP(Q)1R{1fllNCG IE~VllceI&
1- .
~ .' "
'
AGRICULTURAL I!XTENSION SERVICE . ., .. :
,.
U. S. OEPARTMENT OF AGRICULTURE
UNIVERSITY OF GEORGIA AND THE
AGRICULrIJRAL MARKETING SERVICE.
STATE DEPART MENT- OF. AGRICULrTURE " ; ~ r
.318 EX~e:.~'.ON ~LDG ATHENS. GA.
At~~-ns;' Georgia .., .... , , . ' ~ ..... ~ _..' ...' . Janu~fY. ?O, ,1-959
I I:' '" :
"..
t i:. ',' }
4,
.. f ""i
',PULLET 'CHICKS ...OiCBRO,iLER HATCHERY StJp'p'.Ly i:L:OCKS
December 1958 - United States, ..,' " :.
t' ! -
:
.. j
.;1 The"indicated pI.aceme'~~ o( pu-lle.t chicks ~or broiler..hatchery supply flocks
by. leading primarr 1?re~d'~r,e,of. bi'.piler..;.J'eplacement stock t.otaled 2.., 147, 000
chic,k4 d,,:ring .Dec~~ber 1:9Sa.,...,~.b.i.f{ .Wa!s 4 percent. less. ~~a~.~.n.December 1957.
Pune~< Chlclt placements' by t~e".e,breeders during 1958.tota~~~ 3?, 959, 000--
27 percent more than ~':l~.i~~)iI9.57,~.~:.,,. . ~ , .' ..";" ,\" , .
t":,,,.:.i" ;::
". . ' ._."':'(t':', ~ .. : ...i ~ ~... ,:
.. ~
...
. The: totals include pullet chicks sold during tile ~qat~,...p1us the number of
pulle.t chicks expect~d fro~ :.e.gg~(.s.o.ld cl~lring'.the ~re~~A~pg -mont~. The con- .....
v~rSlon' fr-om eg'gs to. expec~:!i.p.\l~1.e.tchu::k6 was maqe.ron th~_ baSIS of 125 pullet chicks pel! case o~ hatching egg~ :sold,. .Theprimary" b-re~,ders included in this, repo~,t;'accouritior a very large' percentage of total supply '0" replacement pullets
for broiler hatchery supply flocks. S:l.les of replacement pullets by these
breeder s provide an inqi.cati.Qll,9! the potential number,..D 'pullets a vaHable for
addition to hat.~hery.egg. suppl:Y'iloci<s"several months before the pullets will
actuatty"move' into the flo~ks.
.: .:" "
':' '. "
1.
"
t'
; ,', .
.,
#oIV~
Pul1et..c.:~~c:k~,!! .Placements-tor"Bl'oiler Hatchery S':lpply .Flocks
......._.. .. . ' " (Reported by"leadihg bz:.eeders) ,',' ~,;", '
. . ,, , , .' . .M6~th.
.: : .. :' :
. . . : " ::. ; J
~
.. '. : .. '''re~:56'''' - '~:"""
.- . 1957
:.: .~. s... ,.... ... : (. -1958
- - - - - - - _ .... - -
...:....
j":'
January~ ~~ ..... :
';'.:. "':.":
..
l,OO{):'~ '::'::, 1,'000 .. '
.chick~
...
",
.,....~. .
, .. \
"
,c
1
hic
.'
k.
s
\..
'.
.
. 1,912:':',,1,886'::....
.~'..,.... ...
~. t; 000
chicka
.,
'1,982
: 19 58 as : percent
.. of 1957
percent
\. 105
February.' '.< ' : .. ~, 187 ,., ." 1,997 . ,. ,
2,270
114
March
: . 2, 866
2, 538 . -:': 3, 118
123
..........
l' . ~
..
~ ; ; ',.
, 1..
..-
- "1'I~f;.
\ ~', I .~
. :"
~
.,
ApriL
:, '2,996
3,033 ,.' 3,320
109
I ~~
May
: ,." . '_2, 854
2, 899 '. \'
3, 623 , -. . 125
"
June
: "2,298
2, 060 .. :. .
3, 390 . :. 165
July
",:' 1,778
1,676
3,054
:'.:. "182
August .......... ":" ''-}, 884
Septem.b-e-r..
;.~.:., "1, 864
1,410 1, 935
2, 646 "2, 700
.. ' . ' 188 . 140
October ........... : 1, 922
2, 297
2, 568
>112
November ....... r: 1,900
1,926'
~ 2,"141
111
Decemb.er
, .';- : .. 1~ 787
2,238 \. 2, 147
~
96
Annual Total.
: 26,248
25,'895
32,959
127
!.! .... -~ - --'--~ --' - - - " Includes expected pullet replacements fr~~.. ~ggs sold dur.ing the preceding
". month a~.th.e ...-',-
rate . of
125
pullet
chiCKS ~
per
cas-e. of
eggs.
.
l : 0/ I . ~ : .t~: ... ..... ~.. f.~
____"... ' u. S. Froz_en Poultry Stocks as of the End .0 the Month
': :I:'j
.'1 '
C1 ,.
: December,;: December '. ':, November
ass, ,
: 1953-57.av.:.: : 1957 ' :.,',: ~958
_ _ _ _ _ _.,_.
:
\' . .; ~:;.
'.\ _~_\_:_.~~~~.:
--"', .~~ .....,_ .....-:--1 000 ----,.-' ~TOOO-"' ,'1. : l) 000
..
,..
...
,
,
: pounds
. pound~
poutlds
: December
.':,
1958
.:.l'~
."
1 000
I
,
pounds
", ~; i
~ '.'t "
.... (~
. L';
.. '....,.
Broilers or fryers.. : 24,476
Roasters
: 9,93~ ,
Hens, fowls .......: 66, 469-:-~'
Turkeys ,
: 135,400 '.
Ducks ,
: 7,663
.Miscellaneous , .. : 11, 801
Unclassified.
: 28,939
'rotal Poultry
: 284,682
23, 866 ". 6, 513 (.'. 59, 59~ , .,176,748
5,839 -12,485
31,409 316,455
30,6j5 8,354
83,910 297,845
7, 5"1.:5
... '1. 3 , 'f~'l'
"25, 815 377,235
35, 516 9,764
88,756 161,976 . 5. 750
15, 179 29, 551 346,492
" ~; l
',"f
'1
." ~
;, ,: ~ ~
. . . . -~ ....
r I. ~!..!'
r, ,I '.
.; : l
~; ,"
~
". ~ !..
I
... Y'
.' r'
.... :. t
' '1'
UNIVERSITY OF r,r~RG'1\
JAN') '59
1 I 8 f V \ I < d::.S
CHICKENS TESTED
In Georgia 432, 318 chickens for supplying broiler hatching eggs, were tested
for pullorum disease during December 1958 -- " percent more than the 252,517
tested in .~ 1957. Testing'S' of Egg Type chickens for December were
84, 778 almost six times the number tested in December last year.
'
.I.'.' ~
t
.'
.~
..
.
In the States for which comparisons are available, 2,794" '873 chlcke'ns for
supplying broiler hatching eggs were tested during December 1958--up 27 percent
from December 1957. Testings July thr.ough December 19~~, ~ere u,p 19 percent
from this period in 1957. The number of chickens for oth,eJ" pur~os,es (~gg-type)
tested during December 1958 tota1ed~2",4aS.. 747--4 perc~nt ~~,~s tt'an the ~umb~r
tested in December 1957. The'number of:egg-type chickens, ,t~,sted July through
December 1958 totaled 9,488. 948--down 3 percent from th~s' p~~iod in 19~7.
This report is made :po6&ible thl'ougb the cooperat~on.pf ~be ,National Poultry
Improvement Plan official state agencies. ,tile Animal HUS9~~dJi"Y Res~a'rch ' .
Division, Agricultural Resea,rch Se.r,vic.e. and the Agricultu~al Estimates Division.
Agricult~ral Marketing Service. ' ,',: i ' ,
'
.- ,' , ,"
,'
.1
'.'
.:
J
Georgia - Chickens Tested,by Official State Ag~?fies
1 ~
For Broiler iprod-udion
E'gg Type Chick,e~s
Month
~uly
Aug. Sept.
pet.
Nov. Dec. Jan. Feb. Mar. Apr. May June
. ., By Months
. . , .. : Cumulative
1957-58 : 1958-59 : ,195700:58 : 1958-59
By Months
1957-58 : 1958-59
:
.1
202. 194 230,292 334,522 306,795 254, 554 252, 517 414.416 275,750 255, III 211,093 254,024 185, 343
253.865 240,302 413.,264,"
458,442
38~ 1~6'
432.318
202,194 432,486 "7,67',008
1,073,803
1,328,~57
1, 580, 874 1,995, 290 2,271.040 2, 526, 121 2,737,244 2,991.268 3, 176,611
253,865 17,274' 494, 167 '. 47.736
907,431 Ie, 286.
1,365,873 ,z? 242' 1,754,009 ,,8,325 2, 186. 327 14,836
61,618
: l3, 675
12,086
. 57,426
.; 10, 849 . 17,445
30,299 42. 581 35,652 41,043 26, 186 84,778
United States - Chic~ens Tested by Official State Agencies,
:. ,For BroUer Production
:
For Egg Type Chickens
- . M, onth
. ' by Months 11
t
.:
- ,'hy Months 2/ ,.
;
t'
1957-58
1958;'59
1957""158
,:
1
~
9
5---8-
..
59-
-
-
_
.
,
July Aug. Sept. ': Oct.
Nov. : Dec. Jan.
Feb. Mar. Apr.
~ay
J, une
I, 310. 378 1.600, 805 2,310.549 2,723,936
Z, 2Z5, sao
2,208,307 2,014.868 1,282,382 1,587.391 l,701,02Z 1,554,643 1.310,490
1. 628, 129 1.956, 792 Z', 643, 740
,,; -, " . 3, 119.754 3/
- , Z,,951, 368' - ' ,,
,~.
. 363,. 753
"676.'162 I, lSI, 370 Z,379,471 2,483,280 2,586.456 1,741, 051
454,617'
485. 136 . 245. 7~O,' , 276,,008' 289, '14l
5ge.558
S99~&07
1,243,658
l, 316, 782 3/ 2,342,596'-
:1-/ All states except Mont., N. Mex., A~iz., Nev.
~-~ ~-,------ - -
~/ All states except Ohio, Del., Okla . Mont., N. Mex. Aris., Nev.
3/ Revised.
ARCHIE LANGLEY Agzoicultural Statistician In Charge
c". '1
w. A. WAGNER
Agricultural Statistician
. "
=:=:-.",,:, - . - r - ' _ ... -.-_.-. __ 40 ~_ _ .;._ -.a..~'::: ~
1"~,",
_L~ ... _
~;;;-;;:;r-.., #r\i\'I\"=-~_
"--4
~
()
'1//13
~5~' GIQlRGHh CJRzOJP> ~lE'O!R{l'HlN(a SIE:~VH<ClE
3~
AGRICULTtlRI\L EXTENSION SERVICl:. ' UNIVERSITY OF GEORGIA AND 'rHE !;TATE DEPARTMENT OF AGRICULTURE
U, S. DEPARTMENT OF 'AGRICULTUFiE AGRICULTURAL MARKETING SERVICE 319 EXTENSION BLDG" ATHEN~. GA.
BROILER CHICK REPORT FOR GEORGIA
January 21,1959
, ATHENS, GA., January 21 -- A total of 5,825,000 broiler chicks were placed
with producers in Georgia during the week ending January 17, according to the Geqrgia'Crop Reporting S~~vice. This com2ares with the 5,744,000 placed the
previou~ week 'and is five percent. more than the 5,524,000.p1aced the same week
last year. '
:,
'
, . '.
. Eg~fi s'et 'py 'G~orgia ~at-cheries amounted to '8,08:L, 000 compared with ,
7,904,000 tile prevtous wee~~~nd is thre~ percent more than the 7,859,000 for the corresponding week last' ye~
. The majority qf the prices paid for hatching eggs were reported"within a range of 49 to: 61 ~ents witp. an ,average of 55 cents per dozen compared with a range of 50 to 67 cents and an average' of 57 cents per dozen last week. Most prices ~hcir~~,dtfor 'chic~s, w~re reported withi~ a range ,of, $7.00 to . ~?10. 00 With an average 'of ~~8. 75 per hundred compared with a range of t;p7.00 to :)10.50 and an 'average of ~~8. 75 per hundred last week. The average prices last year were
77 cents for eggs. and to~13. 75 for chicks .
~ Wei~hted average" prices from .the Federal-State Market News Service for
broilers during the' w~~k ending January 17. are as follows: G,eorgia broilers
2 3/4 - 3 3/4, poun~s, ~t farms 17.08; FOB plants 18.11.
.
(See reverse side f?r oth~r sta~es)
:- GEORGIA'" CHI6K PIACENENT; BY, vJEEKS' "
;' NGVENBER 15 THROUGH JANUARY 17
We~k
Ending
,
,EGGS SET ]/ '....
119~ICK~ PLACED FOR BROILERS
I 19$7~1958 ""1958':;19,$9';' :"?''-':~I y~J)1~olr t9S1~1958 "195~~i959 Ye!;. ~~o'
Nov. 15
Thousands
. Percent
.,
Thousands
I Percent
6,.87'1 '::;:: 'l;'311'~ ':;::, 106' ',:: 4;923 .'..5,016
102
Nov. 22 : 6,86,8 " : 7,524
'110
4,955'
5,196
105
Nov. 29
6,,65'3
7,832
118, 4,993
5,320, 107
Dec'. 6
Dec. 13 Dec. 20
6,418
7,000 .1,033
7,420 " ~,146 '8,.092
115
5,036"
5,388. ,101
1 1 6 " 5'.,076 ' :,: ' 5,255 . 1Q4
115, ' "5,094 " ' 5,' 734' , 113
Ded. 21 . 6;890
7, 844
114
5,172
5,404
104
Jan. 3
7,361
Jan.: 10
7,599
Jan. 17~' '7, 859
7,619
104
7, 9q4 .'.. ,lq4
,~, O~l ,
;' , 103
$,401. ,5 ;519 ' .' 5,5'24 -
5,862' 109 5" 744' '104
5; 825, , 105
..
11 Includes egg~ se~ by hatcheries, producing chicks for hatchery sUPP1y.~locks.
'ARCHIE' IANGLEY
, .. "
. , ~'l.: A. WAGNER '
Agri'cultural Statistician In Charge ' . I ' " , ,-: '.' .' , Agricu1tural>Statistician'
UNI\'FRSITY OF GiORGrA
JAN 2. '59, :
~
LIBRAI<ILl)
:. ",
I,
'"
,,
,"
'. ;...
EGGS SET AND CHICKS PLACED IN COMMERCIAL AREAS 1. BY \'1EEKS
1958 & 1959
Page 2..
, Week End;ing
STATE
Jan.
Jan.
3
10
:I Jan.
Nov.
Nov.: Nov.
Dec. "1' -- Dec.
Dec., ,_ De'c.
Jan.
:l;,7:
" 15
22 i
29 0
6 . 13 - ZO'
27
3
'Jan.
Jan.
10
17
- - l 'L' /, -.-: EGGS SET - THOlJSANDS. '
i' CHIC~ PLACED - THql!S~:~TDS_
Maine 'Connecticut
Pen~sy.lvariia.
Indiana Illinois .. r1issouri Delaware, Maryland' .
Virg~nia
We~,t: Virginia' North Carolina South Carolina
GEO"R, GIA
Florida Alab"ama
Mississippi Ark;a.n-sas Loui.siana Tex'Ci.s' 1.vash..,ington , OregQn '
CaliFornia
r
TOTA;. L.'
1958;.59 .:
1,488 1,079 1,477 1,678
280 1',649 ,1',:997 2,430
Il . 2,.0$4
. 285 2;946 ,522
II 7,619 -.356
3,478 - 2,'451
3,534 . 644 2,722'
400 .' h31 1?52(
II .
41:,047'
1,446
i ,1,62.9 - '::
1,,9.99
1,075
j
1,01" ( ,1,042 ',;1",125'
1,169*; ,1,147
1,211
1,180
1,:198, .1,111' ',.
.'1;406>, 1;315 .,., :1, ,1,564".1,677 " " 263 :' 30)." - "
1,694 :~'1,690~: '.' :,1
2,q8~ ":' '2,p9Z,.: I
:, 382 '?,2~ . 79-( ".' 187*
-., 654'
1,2,EJ)-
560 l 584.~ 553-:f-
567
560
818 ~ 857 I:; 856
953
911
797 '~ 861: :,', 870
943
819
189~~ " '": i30* ': '; 143
163 . :" :.155
676 ,:~ , '736 ': 656''', :--. : '696 " 722
,1,580' .~ 1;605 ' 1,645' ',.:1;598.'~ 1,624
.~ 60r
;:' :;14' ~>, 743' : ~ ': 142. :':' 665" ~: 1,692':
669 ' 873 "
772
~~
2,046
531 784
737 136
765 1,880
2,454 2,212
2,416
I 1,871 .;1,,746 ' ;' 1,551' I 1,653
?, 2,00 ':,~ I ", 8}8,
941 :: 1,(j08 : 1,006
i,743 988
1,998 ; : ~, 852:-. 1,840 1,076 " 1,090 ' 1,014
1,838 1,092
"290 }',289 : 5.61
7,904
. 390 3,613 2';556
.. 321' ),411 :.: 594 ~
_ 8,081
" ",429' 3,632:, ,.
'~, 2:;747, ',..
, 5-742,294
3b4'
5,_ 016.'.
.. '201 2;648 i:, 727'
',' 468 ' 481 i 506 ,~,3S9 ',' ".2,444 ; ~,439
490
511 ,," 562
2;475 .. 2,480 _. ; ~ 2,081
362-l:- 369-l:-:, 347
342
361 :', 331
-. . ~
f .
5,196, ',5,320 ; $,388."
..
"5',255:'-
5:, V4'
~ :,5,404
~
.
192 : ': 245":. ';, 249
237_ '., 215.. , " , ':-.'211
2,685 -,;2;650, ,: 2,628"- '2,773 . 2,86j--' \1;'366
~:, 79t; ~,. ~jl';830~ '1,903 1,972 2,000 '1,946
601 2,578
324 5,862
298 2,871 1,999
557 2,407
323
-5,744 255
2,904 2,051
3,.754 3,942.
,~663,' 669
,I
2;665 : 2',531. : II
' 457 : 389"
2:,,463- ' 39.4 .
2,2q$." '13
2,550 ",: :2; 7~3 " . 2,921 :' 383 ,.;: 463* ; 457' 2-~32L' ),302,', \ 2,165
:~' 289, '- . i '2io ." 308
2,999 ,'" . ' '$06
'2,2ii' 259
,3",'-046 : 3,122 3,251 449.- ;.' 390* ll70
2, 126 '. ;2,105 :' 2,277
298 i i 1:258 '. : 269
2,881
440 2,223
310
373 1,.481
:. 4 1,41
0 3:,
U . ",
'
'a1l6h~
-'168 :',' i44-:f- :;: 219
254
861* :' 779;: ~ :',955 " .' ',' 8. 78
242
:- :238 ,',
I
..
236
789 : j .861 .-: 1,052
300 1,196
.. - - '. ' '"
42,-,319 42, ?9q
'. ,
._,_
2$ 27 ,185~~ 28,012* '-:373~':- "i8, 909-ll- 29,427 30;t48* 2a,,52i~l-> 31,347 30,534
1,251 532 585 657 182
732 1,797 1,688 1,016
437 2,207
320
5,825
205
2,766
1,944
3,073
430
2,079
284
309
1,226
_,
_
29,545
TOTAL, 1957-58
38,144 38,984 39,918
24,456 24,601 24,4"62 24,828 25,320 25 ;668' '2~\293 ,,~ 26, 741 27,022 26,821
168io9 %of, Year Ago .1 .
. 108 .., III
114
llq
116
ll6
." ,': _:.
117".
:: 113
~
117
113
110
*
Reyised
5
J/S-
G1E(Q)~CGllA C]Ri(D)P) ~JEIP(())IIRllllNG IEIRiVll(C[
AGRICULTURAL EXTEN~'ONSERVICE
UNIVER~;'I'fy 6f" GEORGI.l\'ArIO THE
. ..
.
STATE DEPARTMENT 0,. AGRtC;JLTURE
AthznS', "Geol"g,fa
. '.;
..
.. -I
'. . '."
'AIGJ.RSI.COUELP'TAURRTMALENMTAROKIFrTAIGNRG.IC<USELRTVUIRS=E~L
" .. '., "'31'9 EXTE'NSI-oNBLDG.~ATHENS. GA.,
.'. J'.;
,,'?ar~uary 26, . l??f. JMf2 ~ '59
,
'.' ",
- ... '.",
{-lONEY AND,B.EE~WA~ f~9P.uC_T.~~~,-.1958
r- L1BRA'~IES
. .' .', :
, . . ' . . . - .. h-...-..,.",.,,..,,.
_
GEORGIA::'! r,fojley .pr05Uctton-in G~6.rgia. during .19 58 .tot'al~~.~!_.6,9~" O~O".P?unds, a
decrease of 2 pe'rc'ent from the 1957 produoti-on of 6, 727,.009 .pounds:
The number of colonies of bees in 1958 is estimated 213,000 compa'red 'with
217, 000 o:ne year igo. Honey productl.on per colony in 19.58 is placed ~t 31
pounds, ~h~ same"as the 195.7' yieLi ardthe uighest in rec~nt y~ars. '
.1
.
I
.~
... "
,
The value ot"the 1958.:l1oney crop is estimateU at $1, ~05,.O:00 co~pared with
a value of $1, 769,'000 in 19'57. The average price:recelv~jw~.s 24.0 cents.per
pound for ~1l honey sOld. a decrease ..of 2. j cents from la~t ye~r' s ave.liage of 26.3 cents. < Value 0' beeswax'amounts to .:j;49, 000 compar.ed w~.t,h $6~,.:0.00 in 1957
:. :."
I :.
"
~ , ;
..'
:"
UNITED"Sr ATES:' ~PR.ODUC.T.Io.N_:.B:-qne..Y.l?roJ~ctioll in 19.58 totaled 2p?; 629, 000
.... ...... . _ . . :' . :.......__RGt.mds r an lncrease' 'qI 9peJ:c~nto:v~,r' the
2.43,
,. , .
902" '000 pounds
. " ._. ~'.. ,., ... _
produced in 1957 'anC'. D
perc~"~.t"a'b6v-e-t' 'h. 'E1'':1952-
. ,"
t
56.average'
oJ ~ ' ..
of 235. 720', doo po'uhds. ac-c'orJing to:tne Cr.)p Reporting Board.' The ',crop was
produce~' by:5. 420, '000 colonies ot bee3-:rup slighti'y frodithe ~'5, '397, OQ'Q co'lonies
in 1957.~ Pr'oduction 'per (;:alony of i1:9; \) pounds was 8 per;c'ent appve the: 1957
yield of 45.. 2' pounds per .colony and c.ompare s with;-the S- year' average'.6f 43. 5
, ..
pounds . . J!..s Q.micl-.De.c~I1(lb_~.r 1?e~':'keepe'rE" 'Felfortej appr.9:xi~ately7-3' .t'f1i~~ion
pounds of'hdney on hand for sale cOrPpared with-aho.at -64- mill-ion pounds on- hand'
a. year ea~lier. Be'eswax production ,of ~":792, 000 pounds'\lVas\ ~ ''perc~il~' gr~ater
~han in , 1. 9 6 7 . .
' .. '.
,: .'
",
......,. ,
.
. ,
'. \'
"
.'
.... "
'PRICES - Beekeepers received an average of 17. 4'-'Cent:s per '"
I:: . :
pound for 1.958 hone'y sales;;:::l. 3 cents fess than in ..:
1957. :'9r ~U e.h.tracted honey in w~olesale lots, ,they rec'eived l3.6cents.per
pound, :~~!TIpared-.'With' 15'. 0, c.ents "in-, ~ 957,'" Hone-y"sold wh9le~~e_in 6Q-.p.Q!:1nd .' :. " ..
containe+s averaged 12.0 cents per lmund"compared-with.13 ..4.. cents ip..1957.
Beeswq.lXprices .averaged ~6 cents a; pounj or 11 c-ents le'ss than in 1957. :
~.>.
* * * * *.' * * >:' * * * * *
! ,. J,
Ho:p.ey prqduction in '1958 was'w'ell above 19~7 in the V.'est, WeS't.No~th . ':";'
Central" and South Central'Sta.tes. 'Increases were 31 pei-cent.in the West, 22
percent in the West North Central, 'an-i 21 percent in the South Central States.
These were partially ofIset })y decreaseS of 18 p~rcent in' the: North Atlantic,
.
15 perce'nt' .in the East North Centra~,.. a~d..14 perce.ntj':l :t.h~..$d.u.~l~..A.tl~~t~.c: Statzs. '.' >.-
~
..
'.
t
P~oduction 'in the West,was \.\~shri~~i;fro~a"~e'~;"~~'-~if~'r:''m'4inly~due"to.:~ ,.
the hig!) yielJ per colony ~n Galiforrli~.. An aver'age of &0 poupl;ls pe:r,. c;olony was
produc:e.d in 1958 in Califo'rnia compal"e-d with 40.'pounds. in 19~7.
<'
.
.\
.
In' the Wes't North Central States. production was 22' percent ab'o:ve 1957 and Z1 per.cent above average." Product'i!on' in the SO'uth Centrall~egion ~as above ." averag~ 1 with Texa.s producing the largest crop since 1950 .. rhe No~th Atlantic,
East Nel'tn Cent.r.al, and South. Atlantic 'States had a cold; wet: spring and early
Bummer "re suIting in 10.w.et:_pr.Q~.Ll~t:~.~hj?~~thepi'evio'lis. ye'at ::-:"1,11' ;:.:"~lQri-da-the ( . '
late winter {reeze weakene<.\ colonie:s a~lcf b-ie s we're 'harnHeYed 'bytoo mu-ch rain
early itlthe season.,and th~ crop was l,~ .percent below 1957.:; .
.
.
\ ..... l
0'
. . ' :.
'.
rI
~\. .
"
..;
..
The 10 leading honey States wl'lich produced 61 pei':cen,t'.O.f the :.c;rop were
California, Min'nesota, ?lorida, Wisc'onsll1, Texas, Idaho, Iowa, New York,
Michtg'a.n and South Dakota.'
.', ".
,
i
I:
I
.Beekeepers receive.,;! an aver,age of 17.4 cents per' polind for ail honey sold
in 1953; inclucling the co.n~binej wh;ole~ale and r~tail sales of extracted, chunk,
anJ comb honey:. This was 1. 3 cen~.s less than in 1957, "anu .the lowest since 1954.
These .PFi_<:~~ include sale"~ by larg~ -a;nd small apiaries' 'ow~ed by farmers and
non-f~_rmcrs." '.-- . : '" -.;':' .. -~-
_
1 '.,... -
-
:.~ ,
~
.............................. ~ .... ........
- ,.. _, ..
".- ,- _ -_.
,'
. . . . . . - ' of _
_
_
_
..
I,. ).
i"~
I ~ r.,.' ,.; ~~.
.., ~ .;
-;
.... 1J ..
HONEY BEES - NUMBER OF COLONIES AND PRODUCTION OF HONEY
State and Division
Col.Qnies of Bees
Honey Production per Colony
..
1957 : 1958 : 1957 : 1958' :
Honey Production
1957
1958
Thousands
Pounds
Thousand Pounds
: Value of Honey Production
1957
1958
Thousand Dollar s
Maine N.H. Vt.
Mass. R.I. Conn. N.Y. N.J. Pa. N. Atlantic
Ohio Ihd.
Ill.
Mich.
Wis . E. N. Cent.
Minn. Iowa Mo.
!'l. Dak.
S. Dak. Nebr.
~ansas
W.N. Cent.
6 8 11 18 2 14 189 30 1'35 .: 413
301 186 163 158 194 : 1,002
248 158 117
2.4 40 57 40 684
732 9 47 11 55 19 18 2 19 15 18 197 61 33 18 143 27 436 42.4
301 26 184 35 163 45 155 67 196 74 999 46.5
250 84 164 76 122 26
28 110 49 145 63 70 43 33 71972.6
18 30 37 16 18 ,19 44 ,26 24 33.0
18 28 33 55 77 39.6
110 64 31
108 165
90 41 83.9
pe1aware Maryland V.irginia W. Virginia
!'f.C.
S. C. Georgia Florida S. Atlantic
3
3 25
29
29 25
146 139 24
108 103 14
187 183 20
57
58 26
217 213 31
263 274 72
.1,0101,00236.3
26 26 21 16 14 24 31 57 31.5
~y.
Tenn.
Ala. Miss. Arkansas Louisiana Okla . .
T,exas 5'. Central
136 170 191
77 88 92 43 266 : 1,063
118 155 191.
73 88 88. 46 261 1, 020
14 14 15 20. 20 23 19 45 ~3. 8
24 19 19 28 22 .29 35' .50 30.0
Mont. Idaho
Wyo. 0010. N. Mexico Ariz. Utah Nev. Wash. Oregon qalifornia W'est
74
78 105
'80
182 186 73
62
37
37 85
97
67
67 62
72
10
11 80
95
89
95 63
7'5
53
52 65
50
8
9 95
63
92
97 49
53
54
53 42"34
559 559 40
" ,F
, i;; ;;
r= P '
80
A' '"
U. S.
5,397 5,420 45.2 49.0
1957 Revised. 1958 Preliminary.
192 376 605 324
38 252 11,529 -540 3, 645 17,501
7,826 6,510 7,335 10,586 14, 3~6 46,613
20,832 12,008
3, 042 2,640 5,800 3, 990 1, 320 49,632
. 75 725 3,504 1,512 3, 740 1,482 6,727 18,936 36,701
1,904 2,380 2,865 1, 540 1, 760 2, 116 . 817 11,970 25,352
7,770 13,28p
3, 145 4,154
800 5,607 3,445
760 4, 508 2, 268 22, 360
,'\ i AS:
243, 902
126 270 407 304
36 285 8,668 858 3, 442 14,386
5,418 5,152 5,379 8,525 15, 092 39,566
27,500 10,496
3, 782 3,024 8, 085 5, 670 1,763 60,320
78 754 2,919 1,648 2, 562 1,392 6,603 15, 618 31,574
2,83Z 2,945 3,629 2, 044 1,936 2, 552 1,610 13,050 30,598
6,240 11,532
3, 589 4, 824 1,045 7,125 2,600
5(,7 5, 141 1, 802 44,720
Jil<' ii'
265, 629
77 135 195 119
14 91 2,041 '169 944 3,785
50 97 131 114 13 ,lOS 1,491 274 872 3,147
1,542 1,536 1, 577 1,916 ,2,441 9,012
3,458 1, 981
633" 433 928 614 244 8,291
1,051 1,200 1~ 194 1,458 2,460 7,363
4,372 . 1,658
779 469 1, 229 , 828 326 '9,661
23 . 204 . 1,090 503 1,223 468 1,769 3, 579 8,859
23 205 899 524 851 419 1,585 2,952 7,458
611 693 811 376 394 398 203 1,987 5,473
909 869 1,020 499 426 449 398 2,075 6, 6~5
1,243 2,126
459 68"1 121 656 524 119 717 426 3,086
,...t ... n
905
1,672,
470 I
. 767
139
770
359
79
740
332
5, 724
"
X?"
45, 578 46, 231
ARCHIE LANGLE Y Agricultural Statistician In Charge
W. A. WAGNER
Agricultural Statistician
.. .'
\GlE:(Q)JRi(GllA CIR(Q)JP>. H1P',\\'~lRtlJrll N(G~l[JRiVll<CIE: ~I~-
I JAN L 9 '59 AGRICULTURAL EXTI!NSION SERVICE
UNIVERSITY OF GEORGIA A:m THE
"
STATE DEPARTMNT OF AGRI.CULTUR! "
U. S. DEPARTMENT OF AGRICUl.TURE' , AGRICULTURAL,MARKETING"SERV(CE, :
319 E.XTENSION BL.DG., ATHENS, GA. ' ...
GEORGIA CHICK HA TGHER Y REPO-----
January 28, .1959
ATHENS, GA., Januarv 28- - A total of 5, 742, 000 broiler chicks w.ere placed with producers in Geo~gia during the week ending ~anuary '2t1, accor<,ling
to the GeorBia Crop Reporting Service. This' compares with the 5,825,000
placed the previous week and is :> percent less than the 6,041, 000 p1~ce;l the
same week last ye.ar.
'
Eggs s:et by Georgia hatcnerictl amou.1ted to 8,35'1, 000 compared w~tn' 8,081,000 th:e previous week and is 2 percent more than the 8, 199,000 for
'the corresponding weet, ,last year.
The m~jority of the prices paid for hatching 'eggs were r.aported within a
range o :>0 to 6'5 cents with an average of 57 cents per .:ioze.1 compared with a
range of 49 to 61 cents and an average of 55 cents per dozen last week. Most prices charged for chicks were report~d within a range of $8. 00 to $10.00 with
an average of $9. 25 per hundred compared with a ranee of $7.00 to' $10. 00 and an average of $8.75 per hundr,ed last week. The ave'rage pr~'ce,s last year were 78 cents for 'eggs and .$13.75 tor chic.ks.
Weighted average prices from the ?ederal-3tate Market News Service for broilers dur.inG the week endine January 2'.:: are as follows: Georgia broHers 23/4 - 3 ::'/4 pounds, at farms 18.07f, ,TOB plants 19.00f.
(See reverse sid~ for other states)
GECRGIA EGGS SET, HATCHINGS, AND CHICK FLP_CEMENTS 'NOVEM3ER 22 THROUGI-i JANUAR Y 24
WEn~eoink.g..'t,
.~
....
- -. -
~~::
C - _
~~~
.-u- -?-.~--Q-P-~_,."-L~-:x-::-~-;--~-~-;.-:-~-~-~_:.~-~-~-~-:-.-.-.-j.._;..~-f--/-~--~-~-:.:.d
I 1957-58
1958-S9 % ot.' 11957-58
Yr. ago, '
19S,8-59 "
,1~r/0.oaf goI '1959
1959 '
Thousands
?A
Thousands
%
Thuusands
Nov. 22 Nov, 29 Dec. 6 Dec. 13 Dec. 20 Dec. 27 Jan. :;
Jan. 10
Jan. 17
Jan. 24
.'6,868 ,6,653 '6,478
7,000 7,033 6, &90 7,-361
:7,599 :7, '859
8, 199
7,524 110
4,955
3,196 105
7,832 118
4, 993' , , 5,3'20 ' 107'
7,420 8, 146
I1
11::116
5,0:561.' 5,388 ]07
5,076
5, 255 10~~
8,092 115
" :5,094
5,734 113
7, 84 L! 114
5, 17~, " 5,404,,104
7,619 :l 10f.t:, 5,' 40 1
5,: 8,62' , !09
7,901 104
5,519
5,744 104 532 403
8,081 103
.5,5,24
5,825 105 659 494
8,351 10,2
6,041
5,76.-2
95
672 462
!.! Includes eggs set by hatcheries producil18 chicks for' hatchery slipply flocks.
ARCHIE LANGLEY Agricultura,l S~atistician In Charg~ ,~', ,',;:' ',,: ;:'
\i\'. A. WAGNER Ag!icL\ltural Stati~tician
"
,"
:
.,
#~"
-,
"\ I
,
:
.
... I
...'
....
'"
<-
EGGS SET AND CHICKS PLACED IN COMMERCIAL AREAS, BY WEEKS - - 1958-. /59
'i
i"l
Week Ending
Page I..
ST.A ,r~~
II
I I
;1
I Jan.!I
II 10
Jan. 17
Jan. 24
II
-
Ii EGGS SET - THOUSANDS
IIiit!,l
.
Nov. 22
I
II Nov. 29
II, Dec.
l
6
I
:1
Dec. 13
i
I I
I Dec.
Dec.
I 20 I 27
I I I '
I Jan.
Jan.
Jan.
Jan.
!3
10
17
24
CHICKS PLACED - THOUSANDS
Maine' Connecticut
,!
11 1,446
Ii 1,198
1,629 1,111
1,512 1,.134
IIIHj 1,075 560
Pennsylvania Ii 1,406
1, 315
1,365
Indiana
II! 1,564 '1,677
1,857
:i
Illinois Missouri Delaware
iI
263
1,694
I' 2,086
301 1,690 2,092
269 1,774 2,082
II,II'
' Maryland I 2,45I 4 2,416 2,521 1'1
818 797
189':' 676 1,580 1,746
Virginia
2,212
We-st Virginia I
290
2,200 321
2,219 281
III
941
468
North Carolina II 3,289
South Carolina
561
GE()RGIA
II 7, 901
Florida Alabama Mississippi
1
390
ii'II 3,613 2,556
I' 3,411
3,426
II 2,359
~, 05984 1_~35852 1111
362* 5,196
429
. 396
I
192
3,632
3,664
I' 2,685
2,747
2,819
I 1,796
Arkansas
1'1 3,754
3,942
4,097
I 2,550
Louisiana T exas
I:
663
2, 665
669 2, 53 1
707 2, 673
I.
383
2, 32 1
Vashington Cregon
I
457 373
389 400
447 410
289 168
California
1,481
1,413
1,584
861':<
I
1,015
584 857 861
136* 736 1,605 1,551 1, 008 481 2,444
369"~
5,320
245 2,650 1,830 2,723
463* 2, 302
270 144* 779
1,042
553::' 856 870
143 656 1,645 1.653 1,006 506 2,439 347 5,388
249 2,628 1,903 2,921
457 2, 165
308 219 955
1,125
567 953 943.
163 696 1,598 1,743 988 ~90 2,475 342 5,255
237 2,773 1,972 2,999
506 2, 2 11
259 254 878
1,169*
560 911 819
155 722 1,624 1,998 1,076 511 2,480 361 5,734
215 2,863 2, 000 3,046
449 2, 126
298 242 789
1,147
601 714 743
142 665 1,692 1,852 1,090 562 2,081 331 5,404
211 2,366 1,946 3,122
390* 2, 105
258 238 861
1,211
669 873 772
149 685 2,046 1,840 1,014 601 2,578 324 5,862
298 2,871 1,999 3,251
470 2, 277
269 236 1,052
1,180.
531. 784. 737
136 765 1,880 1,838 1,092 557 2,407 323 5,744
255 2,904 2,051 2,881
440 2, 223
310 300 1,196
1,251
532 585 657
182 732 1,797 1,688 1.016 437 2,207 320 5,825
205 2,766 1,944 3,073
430 2, 079
284 309 1,226
1,274
607 753 730
109 723
11,,977486
1,058 537
2,346 290
5,742
198 2,884 2,025 2,998
397 2, 227
342 274 1, 118
~OTAL 1958-59 Ii 42,319 TOTAL 1957- 58 I,' 38, 984
42,990 39, 918
44,170 40, 637
'I. 28,012':' 28,373* 28, 909"~ 29,427
,
24, 601 24: 462 24, 828 25, 320
, 30,148* 28,521'1< 31,347
25, 668 25, 293 26, 741
30,534 27, 022
29,545 26, 821
30,356 28, 539
% of Year Ago I'
109
108
109
:'1'
114
116
116
116
117
113
117
113
110
106
"
tI,
*'R pvi RRn.
315
/959 GJE(())~(GllA (C~J)r ~lE1P(Q)~llllNftG IE~Vll(c[
:2 AGRICULTURAL EXTENSION SERVICE :;;I UNIVERSITY OF GEORGIA APIO THE
U. S. DEPARTMENT OF AGRICULTURE AGRICUL.TURAL. MARKETING SERVICE
STATE DEPARTMENT OF AGRICIJL.TURE
Athens, Georgia
319 EXTENSION SLOG., ATHENS, GA.
, . l',
,,'. 3, 1959
~ .' \':'
I.
Febru~ry ,,',
GRAIN STOCKS - JANUi AB.. Y 1, _1959
GEORGIA: Stocks of ~on in all storage positions on Jan~a!y I. totaled 44,607,000 busbels, an increa~c of 36 percent from the 32,802,000 bushels on .
hand a year ago. O~ts stored in all positions amounted to 3,792,000 bushels or 30,000 bushels bclow-the 3,822,000 bushels stored on January 1, 1957. Sorghum ~~ stocks are estimated at 576,000 bushels, nearly 20 percent above the 481,000 bushels stored In all positions a year. ago. Stocks of wheat in all
positions totaled 802,bOO bushels, an increase of five percent from the 761,000
bushels stored at this time Iwst year.
GEORGIA GRAIN STOCKS - JANUARY I, 1959 WITH COMPARISONS
GRl\ IN
: ON FARt1S
:
r 1958
195 :
(1,000 bushels
OFF FARMS
: ALL POS IT IONS
I~58 19..59 : 1958, 1959
(J , 000 bushc Is) (1,000 bushe Is)
Corn Oats Barley Sorghum Gra i n ':lheat Rye
30,352 1,986 68 454
333 19
40,462
2,550 67
533 229
16
2,450 1,836
40
27 42G
,'(
4,145 1,242
12 43
573
*
32,C02 3,822
108 481
761
,/(
44,607
),792
79 576 802
"I,
',,'
"Ie Unallocated -- to avoid disclosing individual operations.
fEED ,'NO FOOD GRt';INS STOCKS MAINTAIN RECORD LEVEL
.. ,
UNITED STATES: Stocks:of. wheat, corn, barley, sorghum grain, and soybeans in all positions on January I continued at record levels." Wheat
stocks at 1.8 bill ion bushels, sorghum grain at 721 mill ion, and soybean~ 469 million bushels exceeded the previous records by 16,.39, and 23 percent, respectively. Corn stocks of 3.9 bill ion bushels were nearly 9 percent above the record leyel of. a year ago with barley stocks 8 percent larger. Oat stocks'
at I bill ion bushels approached the record level of 1946 and were 13 percent above a year earlier. RY9 and flaxseed stocks each were sharply above the" previous year.. Stocks of feed grains--corn, oats, barley, and sorghum grain-totaled 156 mill ion tons, more than a tenth wbove the previous record of 139
million tons in storago January 1, 1950.
ARCHIE LANGLEY Agricultural Statistician In Charge
CARL O. DOESCHER Agricultural Statistician
UNITED STATES GRAIN STOCKS - ~ANUARY 1, 1959, \.J ITH COMP/\R ISONS
_ _ _ _ _ _ _ _ _ _ _ _ _ _ __ ~i~ !h~u~a~d_b~sbelsl
- GR_AIN__AN_D _PO_SI_TIO_N_____
1
~
_Ja1n94. 6-157A_v._
:
~
_J1a9n5. 8 1_
: Oct. 1
: -19-58-
Jan. 1 _ _1~5~
WHEAT .On Farms 11
::.'. 356,943
292,407 643,900 456,581
Term i na Is' 2/'
.272,132
360,662 472 ,590 422,047
Comod'i ty Cred i t Corp. ~/.
47,038
72,516 83,731
87,230
l~t.Mills,Elev.&Whses.1/~/ 464,140
657,075
- - -- - - -- - - - - - - - -- ------ - - ----- --- - - - - - - - - T-OTAL'
-
1,1-4-0,25-3-
--
1-,3-8-2,6-60
--2-,19-4-41-0'-,,08-5398-----1-,88-1-4-59-,,78-59-97--
-
CORN On Farms 1/
2,123,545 2,468,049 344,187 2,695.993
Te rm i na I s 7.1
55.616
104,264 85,125
97.223
Commodity Credit Corp.]/ 327,492
642.774 611,614 633,545 :
Int.Mills,Elev.&Whses1/~/
130,067
396.120 429,568 499,156
Oi\TS
TOTAL
On Farms 1/ Term i na 1s 'U Commodity Credit Corp. 3/
Int.Mills,Elev.&Whses.l/~1
TOTAL
__ 3~6l1~2Q7_ l,~7Q,~9~ _ ~,22?,~lZ
849.429 15,031 271 63.497
928,228
1,202,549 952,566
38,380
25,526
4,932
3,978
- - - - 89,180
66,606
1,335,-04-1 - 1-,04-8-,676 -
B/\RLEY On Fa rms 11 Terminals 21 C6mmodity Credit Corp. ~/
Int.Mil1s,Elev.&Whses.l/~/
137.034 25,471
1,733 64,118
210.:;45 36,722
559 111.978
306.800
44,333 11,787 133,943
225.368 47,061
9,381 107,840
TOTAL
_ _ _ _ _ _ _2~8~326_
_3?9~6Q4_ _ ~9,~6i
282,5Q _
SORGHUM On Farms 1/
52,935
206,996
13,412
193,790
GRAIN Terminals 21
22,210
80,903
84,777
128,642
Commodity Credit Corp.JI
569
15
3.096
2.549
- - - - - Int.Mil1s,Elev.&Whses.l/~1 63;247
- - -230-,243- - -20-8,-11-3 - - -39-6,-41-6 -
TOTAL
-1-38-.9-61- - - -5-18-,1-57- 309,398 - - -]2-1,-39-7
SOYBEANS On Farms 11
99.231
.189,935
2,191
199,467
Terminals 2/
14,057
23.993
2,635
42,767
Commod ity Cred i t Corp.JI
133
Processing Plants 51 .
64.297
Int.Mil1s,Elev.&Whsei.1/~/ 45.505
'0
78,S63 89,243
2,012 4,649 9.596 .
1.954 98;610 126,279
___ IOIAk
2~3~2~3
3~2~024
2 __ 2l.Q8
~6~,Q7Z
11 Estimates of the Crop Reporting Board.
?/ Commercial stocks reported by Grain Division, AMS, at 45 Terminal cities
.3/ Owned by CCC and' stored in bins or other storages owned or controlled by CCC;
:other CCC-owned grain is included in the estimates by positions.
~/ All off-farm storages not otherwise designated, including merchant mills.
5/ Firms,reporting crushings and stocks of soybeans to the Bureau of the Census.
t-." ..
o.
3/
GJE0 ~GHAC IRi({))IP HI~,~~,~~I~llN~ IEIRl;~rllCC1E
AGRICUL.TURAL. EXTENSION SERVICE
. UNIVERSITY OF GEORGIA AND THE STATE DEPARTMENT OF AGRICUL.TURE ,
GEORGIA CHICK HATCHER Y REP
U. S. DEPARTMENT OF AGRICUL.TURE
'59
AGRICUL.TURAL. MARKETING.SERVICE 319 EXTENSION BL.DG., 'ATHENS~GA. '
J?ebruary 4, ;1959
ATI'-iENS';'::C,A:';, February 4- -A total of..5,'9:43, 000 broiler ~h~ck~",~e_r~
p1aced,with' producers in Georgia during the week endin3 January :s r~" 'a'ccording
to the Georgi~ ,Crop Reporting Service. This compares ,with the 5,742, :00
p1aced,the pr'eviou's week a~d is three percent less than the 6, ~42,'OOO placed
~he sa~e w;eek last year.
''
,
EggD, set by'G~orgia hatcheries amounted to 8,390,000 compared with
8,351,000 the previous week and is one percent more than t~e 8, 278, 000 for
lhe corresponding week last year.
'
, The ~ajority of the prices paid fo~ hatchi~~ eggs wer~ reported wit hin a
range :of 59 to 6,5 c'ents with an average of 56 cents per dozen compared with
a. range of 50 to 65 cents and an average of 57 cents per dozen last ~eek. Most
prices cha,'rged :for' chicks were ~eported within a range of :/>8. 00 to ,$10,.00 with an av~rag~ of $'9.25 per hundred ,compared with a range 0. $8.00 ,to,$10. 00 and an a'v,rage of $:9,25 per hundred last week. The average prices last year" wer:'e
79 cents for eggs and $13.75 for chicl~s.
'Weighted . average ,p!"j~~..E!, from the .Tedera:l-State Market New? Service for broilers during the week ending ianuay 31 are 'as follows': 'Ge,or-gia. broile.r.,s.
Z 3/4 - 3 3/4. pound,S. at farms 16. 79~ ZOB plants 1-? 66~.:
(See reverse 'side for other states)
GEORGIA EGGS SET, HATCHING?, AND CHICK PLACEMEN,TS
NOVEMBER 29 THROUGH JANUARY 31
Wee~ Ending .
"
BROILER TYPE
"
;'
" .,. I
Eggs Set!'!
Chicks Placed. for Broilers in Georgia
"
~GG -TY~E ' Eggs Chicks: Set ~atched
1957-58 19S8-S9
;
Thdusands
0/0 of Yr. ago
0/0
1957-58
'
,
,'19~-8-59
: % of
'Yr;ago,
1959
,.
I
' 1959 '
ThousaI)d~
10
Thop,sands
Nov. 29 ' 6,653
7, 832 " 118
I
Dec. 6 6,478 ; 7,420 ' 115
Dec. 13 ' 7,000
8, 146
116
Dec. 20 ' ,7, 033" : 8,092
115
Dec., 27 ' 6,.'890 , 7,844 ' 114
Jan. 3 7, 3(>1
,7,619 " ,', 104
Jan., 10 7,599
7,904
104
,,1:,993, : 5, 320 5,036, , 5', ~S:88 :
5, 076
5, 255
5,,094 .: 5, 734 5,..172 ' 5', ~o'4
5,401 . 5,862, 5, 519 ' , 5,744
1Q7 , : .,
: 107 '
i04 '
"
113 ' 104 ' i09':
'104'-0
r ',
",
I -"',
5'32
-,
,"
,.,
,'I
.:
. - '
403 :
Jart; 17 7,859'
8,081
103 5,524 , 5, 825
105
659
~'94
Jat\.~ 2~ '8, 199
Jan.', '31 8,i78
8,351 ,8, 390
102 6,' 041
5, 74~
,101
:
.
6
,
.'
1
4
\
2.
;
'
.
5,,9~3<
95 - ' 6'72 : 97 7i3
.. 462
~' 4~3
l!, .. ~ncl~des ~ggs set by hatcheries producing' chicks for 'ha'tchery; stipply' flocks,.
-{\RC~IE' LANG,LEY
':
Agricult~r3.l Statistician In Charge,
,."
I
.
~ .' ...... f:
., ,,',
:'~
.
W.' A. WAGNER'
Agricultl:l,ral Statistician
'. I
.'
.'l
o. ' , . t . . . . . . 0(
\. I V ~_
- \,'.
M"
....
"0 ...
_ ,1_< ~...
"~ -..
: ..
., ! '
..' ;
- i ..
.\ ~
"
i
EGGS SET AND CHICKS PLACED IN COMMERCIAL AREAS. BY WEEKS -- 1958-1959
STATE
,,
~
.. ..,
'Of'
"
.... .
Maine.
Conne~tieut"
Pe?nsy1vania
Indiana
'.
Illinois,
..
Missouri
Jan.
. . Jan.
-.
. :Jan,'
" . 17
.. 24 '. , ' , 31:' .-
,
-
"
... ..." EGGS
..
.-
, ~- l~. 6'29
SET :'": 1,
THOUSANDS .'....
512
1,651
......, ..:
.
1,1-11 1, 134 1;~315 . 1,365
~ 1, 229 , 1, 244
'1" 6 j 7 ,_. 1., 85't, . r,860
. - 301 '. ': : 269
~12
. " 1,-690 .. 1,774,' ".1,901
Delawa,re Mi'iryland " ," Vi,r-ginia : .' . We'sf Virginia
,. .' .2,09.2
1 ,2,416 ',2,200 ' ',321
.,2082- "2,'086-
'~2;" 521 . ';". ~ 2, 5:42, .
'2;219'-
- ':'281:
2/3?9. '..
' 322- .
North Carolina South Caroh~a GE0RGIA
~, 411 ~ 594 :' 8,081
. 3,~26' ., .3; 672' .
.. : "582'.
5CJ7 . '
'. ?, 351 : ' "8,.390
Ploi-{da
"
, ~,29
396'" ,. -436.
Alabama MiJ:; s.ts sippi Arkansas
. 3,(:)32
'.0 747
3,942
.
3, 664' .., 2,819,': .
-3, ,763:.;.
2.,: 94-6 .
. 4,097:: ,-4;'27.7 ..
Louisiana
669
. 707' .. . 741
Texas
.' 2.,531
2., 673 '. ?' ~3'5 .
Washington Oregon Ca1ifo:rnia
.
. :.. 3'89 .4'00
'.:1,413
..
447 ." '446
. .' 410 :. . 463
0-
1; 584
..
' ..
1, 48'S .' ,.
TOT1\L 1,958- 59 . 4;2',-990 44,- 170 4S,53Q
Week Ending
...
--.
.Nov. 29
pee. ". Dec.
6.
13
Dec. . Dec. ..20 '- " 27'
Jan. ': ' :':.3
Jan . ..... 10
0"
-
-
....
.
;
,
CrECKS P-LACED - THOUSANDS
-
1,015" 1;042 1', 125, 1,.. 169'* ,~, 141
584 . 553* : 567; .- 566
601
." .
1;211 669
.
11 180 ... 531
.'
;
857 861
856, .' 870:
; 953: .' ! 943: .'
911
714
~ ,8,1.9.:. , ,.' 743-.
813' .'. '1.77.;
'. .
- 784 ,737
,.
136* . 143',
163
1 5 5 . . 142. . 149" ,.: - 13 6
-
..
- 7-36 . 656
: 696 .
1,605 ' 1; 645' . 1,. 59,8 .
722: 6:65'. 685 ,... 765 1,--62'4'" ' 1: 692' 2, 046;.:' ;. 1, 880
1, 5~1 ;.. i; :t>53\ .',' 1,: 74-3 1,998 1,852 1, 840" It~838
1,008 .1,.P06
988 '. 1, 076 1,0'l0
4fU
'506 ' ,490" , "511 . ,.' 562
"
i,442.; , 2',.43'9 : 2,'415' 2, 48t) . 2, 081
,369>:<:' .347 342 . 361
331
1., .Or4. '60'1
2,578' 324":
1,()92 :557
2,407 323
5', 32-0 '-5;388 ' 5,255 5,734 . 5,404 .5, 86~ _ 5, 744
245
., . i, 650
.1,830
'. '249. 237' 215 :. 2-11 .. 2'98 '. 255
2,',628 ., 2" 773 : .2, 8.63' ' '::2;'36,6 ~ ."2;; 87 i . 2,904
}, 903' " 1-; 972 2,000 1,946 1,999' 2,051
"
..
2;-723 '.463":<
-2,942.517
-
2',999 506.
'
3,046 449
3, 122 3, 251 '. 39-0* .. .470 .'
2,881 440
i, ;
\ .. :2'~ 302
.2,"165 ~ .2;.211
126' .'.:i, 105. 2:,277, 2,223
:~ _ -270 . .308 ',-- 259
. .-' 144;:< ,.219 . , 254
298. '.... '25.8 ',.. 269 .- 310
242
238
236, . 300
" 779... . 955 . ..8"/8
. .789
861' 1,052. -: 1, 196
:
..
.
"...
,
'. .
~
...
. '.
. _. . ~
28,373* 28,909* .29, 4'2? . 30, 148* 28, 521>:< 31,'347 .. 30, ~~4
Jan. 17
Jan. 24
1,251
532 585 657 ' 182',
73~
1, 797., 1, 688 1,016
437 2,207
320 5, 825
205 2,766 1,944 3,073
430 2,079
284 309 1,226
1, 274 607 753 730 109 723
1,978 1,746 1, 058
537 2,346
290 5,742
198 2,884 2,025 2,998
397 2,227
342 274 1, 118
29, 545 30,356
TOTAL 1957-58
~
.. ,
0/0 of Year Ago'
..
:
*Revised..
.
,
-
40, 130
'--:
-
.
.
..
lQ7
-
:
41,074 :.:~ 108
.. ' 41, 914 .-
:. ": .
'.
~~
.' 109' ..
..
.
..
-.
"
;
. . '
,
.::
24,462
..
116
,"
...
,
'
24:.828 25,320 25,668
.. i
'.116
;116 ,'.. ': 117
~ ..
I
. . ..
..
',
.
,
,~.
I
25,293 113
- 2
6
,
7.4.1'.'.:.
.2 .
7
'
,
.
0
)
3
117' . n3
~
26, 816 110
28, 539 106
Page 2 k'
Jan. 31
1,280 576 709 639 174 738
2, III 1, 741 1, 101
532 2,681
316 S.943
178 2,964 2,059 3, 172
433 2,136
385 205 1, 108
31,181
28,826
108
I I I
I I
I
I I I I I
.-
3JS
ce (GJECO)~.CGllA CIRi(Q)~ ,~,lE~(Q)Jf~~1r'llW(G SJEIR{Vll IE
AGRICUL.TURAL. EXTENSION SERVICE UNIVERSITY OF GEORGIA ANO THE STATE DEPARTMENT OF AGRICUL.TURE
.
FFB b. .',59
,
,
. S. DEPARTMENT OF AGRICUL.TURE
GRICUL.TURAL. MARKETING SERVICE
319 EXTENSION BL.DG., ATHENS, GA.
~~ebruary 4, 1959
GEORGIA'S COMMERCIAL BROILER INCOME EXCEEDJ .~:164, 000, 000 IN 1958
Commercial broiler production in Georgia for 1958 set a new record high with a total of 292, 119,000 birds. This was the eighth consecutive year that Georgia has led the nation in broiler production. North Carolina was the second ranking 'state followed in 'Order by Arkansas, Alabama and Texas.
Gross income from broilers 'produced in Ge0rgia in 1958 amounted to . \:' $164,521; 000. This is an increase of $1~, 185,000 from the 1957:income of
$150,356,000 a:1d exceeds the income from any other agricu.ltural commodity in.
the State. i_verage liveweight per bird. was 3.2 pounds, the same as in 1957.
Average price per pound for the year was 17.6 'cents compared with 18.0 cents
last year and 18.8 cents in 1956. The 1958 price ranged ircm a high of 20. 5
cents per pound in March to a low of 14 cents in Decem.ber.
.
Several new areas of production have developed, particularly in South Georgia, but the majo:,:,ity cf the state's pr'oduction is still in'the northern part of the state. The ten leaiing counties w~re: Cherol<'ee, Hall, ~~orsyth, Whitfielq Jackson, Lumpkin, Pickens, Dawson, _i'ra~1klin and White.
PRODUCTION AND VALUE 02 GEORGIA BROILER3 (Period 1948-1958)
,---.Number s Value
'L
300 Year (000)_ (000$)
300
280
240
200
l/l
..o~.. ~ ~ ....
~
160
1935 1936 1937 1938 1939 19-10 19',1 1 19'>':2 1943 19L1:4: 1945 19 L16 1947 19'",8
19~9
1950 1951 19S2 1953 1954
19~5
1956 1957 1958
500 800 I, 100 I, 300 1,600 3, SOc) 6,000 10, 000 17,000 24,,000
29. 520 22,435 2U,717 33,025 45, 574 62, 892 88,678 112,621 121,631 154,471 177,642 222,780 261,00::> '292,119
230 384 539 611
676 1,495 2,775 5, 152 12,198
19, 116
24,466 20,171 24, 191 29.108 32,977 45,433 68, 530 88,610 93,826 101,951 125, 700 :129,836 150.3::>6 164,521
o Number BroUers
!Bj Value, Dollars
,--280
I-l
ii
I- 240
~I
200
I
~.... ..~ .......
-. -- -I
o
:J
I
i
::::}/y.;J
1-
160',
til
I
llj~jrI .:;\):;:):):1
120
I- - -
I
I f<:'
80 J
::{t:\7 li,,!;l:
:{,(:: :?,t
~_.--'t"""
40 _.
,,":;i,i,',
Ili Ilii!:
~fl;:'il
I\lli!;
i~rt:\~;\: :
'~<8
149 '50 151 152 153 154 '55
Years
'56 157
I- 80
I- 40
o
158
195,~ BROILER PRODUCTION UP 15 PERCENT IN 22 STATES
The preliminary estimate of commercial broiler prod;Iction'during 1958 in '22 important States cove~'ed by weekly chick placement reports totaled, , 1,496,864,000 birds--up 15 percent from the number produced in 1957 and the
largest number of record for these States. These 22 States produced 90 percent
of the Nation I 5 broiler s in 1957.
Geol;'gia, the leading State, produced 292, 119, 000 bires in 1958 followed by North Carolina with 134,185,000, Arkansas with 133,331,000, Alabama with 130.. 024, 000 and Texas with 114,327,000.
The average price received for the 1958 production was 18.3 cents per pound live weight--0.5 of a cent less tnan the av~rage price received per pound In 1957. B,ecause of the large number of birds produced in 1958, the gross infom,e from sales in 1958 waa 14 percent larger than the gross income received
from sales 'in 1957. Gross'income from the sales of broilers in the 22 States fotaled $890, 245, 000, compared with ~~784, 099, 000 i."1 1957. The average yveight per bird sp1d averaged 3.2 pounds in 1958-:'the same as in 1957.
Commercial Broiler Production and Gross Income in 22 States, 1957-1958!.!
Str.l,te and Total
I
1957
:
19582:!
: Number: Pounds ;produced :produced
:Price :per lb.
:Gross . Number': Pounds: Price: :income3-!produccd:procluced:per lb. :
iGnrcoosms e~
Thou.
Thou.
'Fhou. Cents Dollars Thou.
Thou. Thou. Cents Dollars
Maine Conn. Pa. Ind. Ill.
50,47.4 28, 370 35,291 42,370
8,337
191,611 9<), 295
123,518 139,821
26,678
19.5 20.4 20.5 19.2 18.7
37, 364 20,256 25,321 26, 846
4,989
56,475 208,958 30, 3~,6 106,2.46 42,349 143,987 44,912 152,701
8,224 25, Lk94
19.4 19.8 20.4 18.8 18.3
40, 538 21, 037 29,373 28,708
4,665
Mo. Del. Md. Va.
W. Va.
28,200 93,537 74,288 61,646 25,233
84,600 318,026 252, 579 191,103
83,269
18.1 19.4 19.4 18.5 19.1
15,313 61,697 49,0 1)0 35,354 15,904
33,900 105,090 94,250 329,875 86,209 293, 11~. 62,879 207, 501 27,252 89,932
17.8 19.0 19.0 18.3 18.8
18,706 62,676 55,691 37,973 16,907
NC.
S:. C.
-Ga-.
F'la. Ala.
106,352 15,690
261,00')
10,884 103,875
329,691 50,208
835,200
33,740 332,400
17.9 18.5 18.0
19.3 18.0
59,015 9,288
150,316
6,512 59,832
134,185 442,810 17, 561 57,951
292,.119 93'1,,781
11,31'1 35,089 130,024 429,079
17.6 18.0 17.6
18.3 17.6
77,935 10,431 164, 5;~1
6,421 75, 518
Miss. Ark. La. Tex::ls 1Nash.
Oreg. Calif.
66,597 110,191
17,428 100,826
11,671 :7,,6'11
___ ~)! ;:J2
206,451 18.3 37,781
319,554 18.2 58,159
52, 284 18.8 9,829
302,478 18.9 57, 168
39,681 22.0
8,~i30
2~1, 630 21. 7
5,345
__ 1}5_,_1J:~ __ ~!:. ~ }_0_,_~6_0
85,424 264,814 133,331386,660
20,650 66,080 114,37.7 342,981
14,939 52,2fi6 S,340 26,638
~7_,_~35__ 1_~7_,_ ~6}
17.7 46,872 17.6 68,052 17. 5 11, 564 18.5 63,451 20.7 10,823 19.6 5,231
~!:. Q__ }}_,_1_=:'2__
Total
1,303, j9? 4, 175, 985
18.8
1,496,864
784,099
4,859,983
18.3 890,245
1/ St"'l.tes having w.:::~kl}' cbick placer.u~mt r,,~ports. 2/ Preli.rr..~nary. 3/ Includes
:~onsllr"lption in househ01ds of producers which i.s less t:1an 1 percent of total j:'t oduction.
ARCHIE LANGLE If Agl."icultural Statisti.cian In Charge
W. A. WAGNER Agricultural Statlstician
.".'
"
~JS
GJE(Q)~(GllA C~(Q)IP
AGRICULTURAL EXTENSION SF-RVICE UNIVERSITY OF GEORGIA AND THE STATE DEPARTMENT OF' AGRICUI.TURE
Athens, Georgia
~IEJP>(Q-)IRrrrrlN~ ~JE~VllC[
u. UNIVERSITY Of r.aoft~,
S. DEPARTMENT OF AGRICUI.TURE
AGRICUL..TURAL MARKF-TING SERVICE
FEB 10'59
319 EXTENSION 81..0(;., ATHENS, GA.
L1BRMICS
Februa ry 5, 1959
FARM PRICE RtpORT~S OF JANUARY 15, 1959
GEORGIA: The All Commodity Index of Prices Received by Georgia farmers increa'sed
3 points to 260 percent of its 1910-1914 average during the month ended January 15, 1959. The index at 260 is 9 points above the level of a year
ago.
The All Crops Index at 275 percent of Its 1910-1914 average, remained un-
changcd from the December 1958 Index. Compared to a year earl ier, the index Is up 13 points.
The All Livestock and Livestock Products Index Increased 8 points to 227 percent of its 1910-1914 average. Higher prices for beef cattle, chickens and milk (wholesale) all contributed to the increase. The Index is up I point compared
with a year earl ier.
UNITED STATES: The Index of Prices Paid by Farmcrs, including Interest, Taxes,
and Farm Wage Rates has been revised, based upon data from the' 1955 Farm Expenditure Survey. The weight base period has been shifted from 193741 to 1955, and commodity coverage expandeo. The Index of Prices Received by Farmers has also been revised.
The newly revised Index of Prices Received by Farmers In mid-January, at 244 percent of its 1910-14 average, held unchanged from December and was about I percent above a year earlier. Lower prices for hogs, cotton, dairy products, fruit,
and tobacco were offset by increases for commercial vegetables, cattle, chickens, and calves.
The revised Index of Prices Paid, Interest, Taxes and Farm Wage Rates was 298 on January 15, about I percent higher than a month earl ier. Prices paid for commodities, farm wage rates, and the prel iminary 1959 estimates of interest and taxes all averaged higher than in December 1958. The January index was nearly 3
percent higher than a year earl ier.
_ _ _ _ _ _ _ _ _ _ _ _ _ _ _ _ _ _ _ _ ~SumIDarY_Tfble~fQr_tbe_UDI1eQ St~tes
Index
. January 5, . December 15,: January:
Be,ord hlgb
- - - - - - - - - - - - - - . - - - - - . 19-10--1-4:100-
- - - - - - - - - . - - - ::. -Ol-d:-RIye-Sv8-ise-d O-ld-:1-R95e-8vi-se-d
15:- - - . - - - - 19I5.9,. Index'. Date
Prices Received 247 241 246 244
244
313 Feb. 1951
Parity Index 1/ 301 290 308 295
298
298 Jan. 1959
Pari ty Rat io
82 83 Go 83
82
123 Oct. 1946
1/ Prices Paid, Interest, Taxes, and Wage Rates based on data for the indicated
-d-at-es-. - - - - - - - - - - - - - - - - - - - - - - - - - - - - - - - - - - - -
ARCHIE LANGLEY
RAYMOND HANCOCK
Agricultural Statistician In Charge
Agricultural Statistician
,
. _ - _ . ' - - - - - t1 PRICES RECEIVED :BY FARMERS .JANt1A.RY 15, 195Q WITH COMPARISONS
GEORGIA.
tNITED STATES
I CCMMODITY----,-A-ve-r-ag-a--i-.Ja-n-.15-, ,Deo.15, .J~n.15,1, .A,,;;~;g~I-.Jan:15-'--11n;;:is-;T .Jan.15, ~
.. --_.. L-... I' I -h--- ! -
_
AND
. --
lNIT
--_.
-
-
-
: 1910_-14-~I
1958 -~. 1.9_~5.8'-.-'
1
9
59
_
l
I:
L
1
9
.
09_1
... _.
4
'.
.1--1
9'.5'-8
--.~I-
._1.
9.5.8'.
>I
1959
Wheat, Bu.
$ 1.23
2.00 f 1.95 i 1.95
.88
1.90
1.73 : 1.71
Corn, Bu.
$
! t '! .91 I 1.27
l.19
1.24
.64 I .93 ' 1.02 ! 1.02
Oa.ts, Bu.
$
~ish Pot., Cwii. $
Sweet Pot. Owt.
$
.67 1.13
.84
: .90 :
i-I
I 5.00 I
.94! .91
i _
5.00
;
_
5.25
Ii .40
II 1.14
,I 1.60
I .61
,1.81
I 5.18
: .59 I .59 . 1.16 ! 1.21
4.54 I 4.47
Cotton, Lb.
I 12.1
29.5
! ! 34.2
I
34.3
t
I 12.4
27.4
30.3 28.2
Cottonseed, Ton
iI
$ 23.65
! Hay ,ll):,. (baled )Ton $
I
Hogs, per Cwii.
$ I 7.36
Beef Cattle, Cwii. $
3 .. 96
46.00
27.50
17.80
I 15.20
50.00
I 27.50
12 10 1
I 19.10 I
I i 50.00 I I 27.80
n .20
I 19.80
I
11
22 55
lI I-
II 7.27
I 5.42
51.20 , 43.00 43.30
19.00 18.50
19~70
118.80 I
I 17.40
! 22.30
19.30
I
/16 40
22.90
I
MP.k Cows, Head
$ 33.85 ! 130.00 1160.00' 60.00 148 00 185.00 !225.00 227.00
Chickens,Al1,Lb. 13.3
Eggs,Doz.
21.4
19.4 50.0
I 14.0
II 45.5
17.4 46.5
11.4 21.5
19.0 38.9
I 14 7
1
I 36.3
1 16.7
I 36.4
Butterfat, Ln.
Milk (Wholesale)
per 10Q(t
$
30;rbeans, Bu.
$
Peanuts, Lb.
25.8 2.43 5.2
I 49.0
1-ill 6.00
I 2.10
! 10.2
::::5i
2.05
I10.3
51.0
f1 6.05
! 2.10
1 103 '
26.3
: 1.60
I
!
Ii 4.8
59.0
1/4 .41 2.05 9.79
1. 59 1 I~/4.45 II 1.97
;
; 10.6
I 58.6
I~'~/4.33
2.02
10.6
~I Revised E:I Pre1imi!lary
i
I
. . ~.~_
.... ,:""-:- . ~-'~':":":':""'--~"7'
--:--,---,-.,,:_._=:...:._-.-.--.~~o:::-r..-::-'.,-~.-
-" C . - - . _ '.
.... _ .. ~
.-. _.-.
IL. _ _~
.- -~..-'.-_.-. ----__.. ._--- .'-
TImEX NuMBERS OF PRICES RECEIVED BY FARMERS IN GEORGIA
(.January 19io _ Deoember 1914 =100)
.Jan.15,
Deo.15,
1958
1958
.Tan .15,
19~
All Commodities
251
All Crop 8
262
Grains and Hay
153
Cotton Lint
243
Peanuts
196
Tobacoo
449
Cottonseed and Soybeans
192
Irish Potatoes,Sweet Potatoes& Cov~eas 258
:Fruit and Nuts
188
All Livestook & Livestook Produots
226
Meat Animals
298
II
POUltry and Eggs Dairy Products
162 . 236
257
260
Z75
275
150
152
281
282
198
198
443
443
200
208
259
268
163
163
219
2Z1 I
324
322 I'
129
147.
236 .._ .._. :3~_1
.---.-----....---.---.-.--.--.-.---. ---,-.....-. -,.----- ____1-- _.... PRICES
PAID- -B-Y
-F-.A-'RGMEEROS RFOGRiASE-I..E-C.'lE-D--:F-E-ED_S..-J.ANUARY
i 15, 1959 !
WITH COMPARISmS ~I UNITED'-STAiE-S .. -----
_
.
KJND OF FEED
I --~.--
l.Jan.15, Deo.15, : .Jan.15,II.Jan.15, Deo.15, .Jan.15,
, 1958
I
I 1958
It 1959.II 1958
1958
1959
I
'Mixed Da i.ry Feed
III Under 29% Protein
16% Protein
1C% Protein 2.~ Protein 24% Protein
3.85 3.75 4.05 4.00 4.30
I I 3.9DO0ll~rs4'.p0e0r
3.80
3.90
~'OC?
I
EE...~
3.61 3.56
4.20
4.30
3.52
4.05 4.50
i 4.15
3.80;
4.60 I 3.90
3.74
3.68 3.64 3.96 4.06
3.81 3.75
3.73 4.04 4.17
H~h Protein Feeds eo1ionseed Meal
Soybean Meal
Meat Scrap
3.45 3.75
3.70 3.95
3.90 4.05
3.72 3.68
Gx-ain By_Products IJro.n Middlings Corn Meal
h0ultry Feed roiler Growing Mash
II 3.15 3.35
I 3.40
i 4.95
3.25 3.50 3.25
5.00
I 3.30
3.55 3.35
2.66 2.71 3.20
5.10
4.81
Laying ll.'fash Scratoh Grains
I 4.70 4.20
4.75 4.15
4.80 4.20
4.29 ~.91,.
.HualafBfa~led)
All Other
I
I 50.00
, i I 38.00
45.00 35.00
46.00 36.00
31.30 29.10
-
I
J
---~,.
iI l L I .
- _"y'_~~s reported by Feed ~_ale.r~. . -.. -- ..
~"'t-' ......
I 4.02
I 4.27
I
!
I 3.05 3.12 3.18
4.94 4.45 3.87
30.00 28.30
4.27 4.45
3.17 3.21 3.18
4.98 4.53 3.90
30.30 28.60
--- -----_. .. ~-_ '-- ._. . ..
7/~
GIE:(Q)~GllA ce)RiO)jp) ~JElP' CO)IRfJrllN1 SlE~VllCCm:
}16'1
."
AGRICULTURAL EXTENSION SERVICE
UNIVERSITY OF GEORGIA AND THE
STATE DEPARTMENT OF AGRICULTUR .
Athens, 'Georgia
. .:
U. S. DEPARTMENT OF AGRICULTURE AGRICULTURAL MARKETING SERVICE 319 EXTENSION SLDG., ATHENS. GA. ,
:;. '.' February 11, 1959
VEGETABLES FOR FRESH I MARKET
.
.
, '. FebruarY'!l, 1959
...... ',
.. '.
. ' '.
UNITED STATES: Winter yege.table production irr 1959 is 'expected to' be 8 percent' .
l~ger than in 1958 but 3 percent below aver~ge, the' Crop Reporting Board announced. to~ay.: This. production is 4 percent belew:' the January 1 es'- .
timate due mostly to.,mid-January, freezes.,in Florida which' reduced yields: on some. crops and caused some ,acreage' abandonment'in'others~' Larger'~rops than ~ year
ago are forecast for all ..wi,nteT, vegetables except, carrots; 'cau1iflower, bee'ts, '. artichokes, Brqssels sprouts, andshallots.' All of 'the crops, eicep,t cele~y, showing a material increase over~la~t year'are' produced principally 'or entirely:, in Florid~.. The larges~ increase 'is:in tomatoes, which'is'nearly ~~ee.tim~s that'.
produced in 1958. Last winter Florida lost an 'extremeiy 'large percentage of vege-
table production because of ,.floods and repeated f-reezes'.' Small 'incr:eases "are ,ex:' . pected in green peppers, lettuce, '.and:' eg.gpl'ant. ' The iarge'st ,declines' from aver~e..
were registered for carrots, snap beans, cauliflower/, 6abbage, broccoli and . '.,., .'
beets.
.'
Vegetable areas in, Florida ;received: light 'to' hea"y'frost"durihg' .ranu,~y a~
far south as the Everglades. : Low'est temperatures occurred 'on Janua,rY ;l.l"and .12:,' ....
resulting in light frosts ne'ar La:kE:l"Okeec~obe'e 'and heavier r'rpst"away,'frpm t,h~. '. . ..
Lake and northw~rd. Adequate: soil moisture reduced the s.everity of'damage,. but. some sweet c9rn.and,sn~p .beans 'in the. Everglades' were seriously damaged and some,
sweet corn acreage abandoned~ Some' sweet corn and .cucumber acreage. was al'so '
abandoned in the F.ort Myers-i.Irnmokalee area where 'Q'amage, to eggplant and p,eppers :.:
was also severe . Strawberries in the Plant ..City area were set back with some . . ;..
loss of blooIll; and exposed fruit,., :Warmer' weather' in' Florida near the 'end of the'" month stimulated growth but foggy:mornings, and high 'hUmidity favored developmeht~'
of disease and made control difficult,. .
'.,; 'i .. ,
'" '
ot .' '.' . Freezing temp~ra,tures dipped. into all, b~t the lower Rio': Grimde va~rey
Texas several tim~s duri,ng .January..Overcast skies 'and' abundant" soil moisture
limited damage to tip burn of tender vegetables. Cold weather and wet fields de-
layed harvest but movement gained in volume after mid-January only to be inter-
rupted by the cold snap near the month's end.
SNAP BEANS Z ,.Florida.ls wi~ter::~r~p...is: now"fe~e~ast'''.~t '504,'O~'O ,:~~t,.> mo~e'than "foui'..
times the short 19.58 crop put4Q ..percen~ ..,!=>~;I.9W. .:Cl-yera.ge... :AdveI,'s~
weather condi.tions 9.1Iriri~ J'anuarj';'reducecCyietii:f: prospect.s i~ the 'Pompano, Bv~r
glades and :pa.(~e County ar.eas .. and-re,sulted, in ..'lightvolume being 'harv:ested~' .'
Younger plantings in the' Pompano area Show improved prospects. Planting of sp~ing
beans continues active
.,
CABBAGE~
Winter pr'o~hiction is
forecast
at
6,273,000
cwt.',
3 per~ent
above
: "'.
last' .
year but 4 perc~z:1:t. '!=>.~+9'f,: ~:v.,er.qg,e .. Har:ile-st, .c.ontinu.es m ~'all' aTe~s Qf . . :.
Florida where' t:h~ .mid":'Janu.ary;:.cold, spells..,resulted' in' reduced quality. The' small'" .. ,
acreage in Dade County escaped serious injury and damage in the Everglades was generally light. In other areas, damage was more seve:re.':. You,ng 'plantings wer~ : : affected but are improving~ -In Texas, harvest of early"p):antings in the Lower ..
Valley was active duri~g JanUary. Unfavorable w,e~t.h.~.r,. 9:~~inK,,~h,.~, mootb..retarded ' progress of lat:er' plantings~:."In ','~he :Wj,.r:r":er':.Garqen,. harve,s't ..of.. e.a:rly. planting's
is nearly complete. Light harvest from the late season acreage is expected the
latter part of February. Harvest continuesactive in the Imperial Valley of
California. This area is furnishing the bulk of current supplies. Production is
also available in the Oxnard, Los Angeles and San Diego areas.
SWEET CORN: Florida's winter production is now estimated at 440,000 cwt., compared with the short 1958 crop of 92,000 cwt. and an average of: ,
447,000 cwt. Winds' and low temperatures during January in the Eyerglade~.4id . .'
considerable damage 'and caused some acreage to be lost, Winter supplies from this area will be light. Steady supplies from the Pompano-Delray area will be available through March. Harvest from Dade County is increasing and is expected to be active about mid-February. Planting for spring harvest is active and will continue through mid-March.
(OVER)
UNIVERSITY Of GI!ORGfA
FEB 13 '59
LIOOARlf:S
. \ " \ :.. \ ':.~'-. ,,. ....
~~:' '~',~~~:':/~:':~;~": ,~" ,.'~ '': .:.. t
'.
~J '
,
,
:)'
'1 ';"~"" -t~~.... :;,~.
.' "
,~
:...{~i
..... I ...
I,
"
_ ,-, "C ...
-':f' ," I
\
'I ft'
..
(
/.
..'..I.
'-
,
"
I
.
'
.
,
:
'
,
\'ri' .' J.. 0" "
.. "'.
,":.';
;;- <,,';J, "i'/: ',\\ ' , ',:',::;,'"
',~~' " <::'::~ ...:J.
.,;.:,: '. ::: :" ' , ' .... ,,,::..::.. '.:. t.~.~
LETTUCE: Winter production is now forecast at 8,6'~1';OO0 elit.,. .:[l;bt~lt;\OqU.i:I.;;(:~~Q.:~a~t
yeex and average. Cold spells in Florida caused damagE).: .to:t!),f.:rt~ :p'pr~~,on of the crop which was at or ne:,!\r~::~").;tur~ty..,.'. Howev:er~" rounger plantings in' all sec-
tions arc in good condition and the weather' damrige 's-cipcctcd to have little ef-
fect on tote.l production. Tho EVGr.glade~ i;B t4P ,pr,incipal source of current sup-
plies.' Lighter quantitios nre availablo' from' tho ':Dade County, Uanatcc-Ruskin and Sonford' areas.. In Texas, . ~~rve'st :~f tthq:,5~.~~~..}lnr~y. a?reage in thc Lower Vf\lley
was d~tiv.e during ~<;m~ary. " Lat,cr. P~;t.ings ;~~d(Y )'O?~'.: pr~~~e~_s.' .d~~~e; ::~i:l.q1 ~o!l.~~.; ,
d c
u o
e m
pttlae't.udn~If, e' .YVOi-eil'dabs~' ethwoe. raethw. :er.re'
lHo'.nw. rv.o':.sBtn'"~,oQ.f,rt!i"o.'np'r~',ly~.t':.ipt.lina.gn~' t
J.ngs :nTt e
'in tho:'.'tl ~ald.ng.. SIlt
Ulter iafa.
Garden J.S ct9Q ,g~lf'tith.
but ar~',;not :cJcpccted to' fu:rn~ah anY prp.dti,.q~~~n. befoI'C '}1arch:~''; 'Hi:tIWcs~ .got,UIt.~qr..:'. ,
way at LaredO': lato :in Jcmullrv- arid,supp.ri,cs:urc :expoct'od to be I:tvni.lap'lo thoro. :th.o
first hcUf :of .February.
,....
l
In Arizona,
som'o. I ;.... 'd.. 1's'e~$e"
h:as"
j.
snown lUI:>
.~. .1 .. ,', . .:,
', J',
most.J,.y. 0!-1,()+d<;lr'" .
.r.~:cl~~.'c?ut,. .qual~ty. :l.s g~ncr~ltY '~ood, ..1~a1''''d:H;~on, :th~ .o'arly;:..pl-aI').4Qd. ;{;\.C~9.Q~i9.},~.~:.; ..
noarmg' complet:l.On. In C;,b. fornJ.a, a markO't~g .order for:wJ.nter, b-Q<\d .lot.tu,l::c .
. cover:ing: theImP~'r.~cl .~d 'Blythe 'Vallcys has. ~p0.$dd hrrrvcsting.~ro;.~:pn9~~g:~q\i'ot~s
.1'he aider hns restr,ictod' daily Im,Nest nncl: Illovoni.6nt.:. Harvest.in, th9 IIT?cr,~~~.:.~,
V~lley 'is': curr,oI)i;.lY' nda!' 'peak with sm~l, s:i,~QS inct6as'ing. and....a:Iw.ii:-4p .rnrig.~:ci.('; ....'
qunlity present . ! il.t Blythu, harvest ;'01' thc'.:l6te~crop..i.$ e~9.ctGJd t,Q. ~br.t",l.:;i!-c" in February. bome additionnl light suppiics 'ar'c :m:::ei[',ilC'.:ble,fr9rin.~~~.6~;'P~9~?,,~a
Los i.ngclus areD,s.
,4
'.:. :
f
. '. . .~',"",
. '.. ~ ',' ,'t.
'D: ON10N~~ ;Uninvorabl~ growing condi~ions .during' Jnnua~xot~rdG~gro~~h,Qftho .::;.: . cro-ly . 'sp:r:~g' 'crop nll,'[J'c[';s . of .Taxns:.. Plnz:ts in.. tho J:,.OW:cr::~~,9):t~9!l.de
Val~ey ancrcoast.a;L Bund GXCIlS 'wurc wuakenoc?- ~y th';J .~ont:uiued.,cool. i~runP W;?~t~cr ... \.
Thfs.hinderep. sprnying an~ blight has CR1..j.S9.d sQmc".dnmhgo:.tG tQpq~ .',:').'n.P.,C;-?'p 'i,~ .: \'
GXI;>'ected to. overcome this 'setback 'with fnyor<;1ple gi;'owlng 'and sppny.=Vlg .9R~i1.it~9~~.
HiJ.:ht~H5t oL the ear:l-iest plantings in' the.' Lower ~Ja:)..l.cy will :pxobnp.f.Y ~t,~~:: ~?~.~
mid':'F'cbruary bu:'=-. m013:t of t!lis 'acreage is:,cocpectod to be h6r:trt.stedi..fr;0!!l pdA:-:~th
'if! thr'ough' :.i;'pril. Hq.rvcst .in the CoD.:stal Bend .i.s expected i;.ogot undpr:wy,y .nb.o~t, ,. "
mid-March ,vith mas t of the acrcngo to be nsr:v:cstcd a:t:to'( mi~~April.......Tp.e .pflip;
?r.-r. the ;Laredo area is mating fairly good progr'Qss although surlshinQ:.'f.!Pd
,;W~f1.:t.f.10.r
nre beeded, to si;.imul<:1,tc. g~owth. In the \'lintor Gardon arall 'stdnd,l3 ia.J::',c l:U}.oy:.~n).:'
parti'culnrly. on. the. se.oded .ncreng<:: . Supplies ar~ not c xpcctod to be nvnil'ci.'blo
in either of tho~c nrc'as untj.l lfter the first of l.priL T'hD ':'crop' J~:::th'1liEC'.glo
Pns'S 'area' has made good progress, but needs 1'1t'.rIn d.f,y wonther for. ;'bGf?'j; ig'tQ~r..~.: ';
., ,
: ."'J :.~ ~".!, .. " ';:;:,.j .
' . ;.: ~"~'~';"'''~':~.: ;.,:.:~.~ ...
":'.
. .: .
.(
.\~. :':i'.,i ~'.'~' L~:,,~rf" .
~.
Acreage a:nd Estimated ProQ.uction Reported to! pa.te, 1959 ..rith Comparisons
,''':
__
-'-
.L~
....
._--0....0 __ ~ ~"-----_~
o'
,.. .
:;
-'" .
:
i .. ~--,- ~~- --~.: ..'
CROP
ACREAQ; FOR HARVE:ST
:: YIELD PER ACRE ':' . PRODUCTION
AND
,I
. STA1E
Average: 1958 1949_57 :
: Ina.
I .1.959
19s8t.:-- t Av. ". t' 1958 I' Ind~ :A~r"1'~e,l.
rnd
: 49_57' : '" I '1959 : 1949_~7: .... f' 1959
:3,700 3,500 III
10,000 .5,500 '97
--~------
-------.--;-.. -- --:-i-'("(. f i.
65 " 100 6'0.' 70
.. ....:' "~ ".
.37~ .. ,~4.0: .
1 ,ll~.
. 600' '"
350 385
"
,T... '. ,'_ .. :
't .. !'}..
.: !/dnelude s p'~~c.e~s~it.
'"
.... .. , '" ~ I ~ '.
: .;
, ...
.,.
.
,
~
,.
:. ~
i " . ~ .: ~'.. 't. ..
" : : '
or:', ::. :. :.' ",;,' ,;',"'''' ,'I
,
"~ ':":"',', r
:; ....
.-:lLR.CHIET.J...:.q:Nr GTF:li'Y
. ; ,.;. ~)~~r~~ult\il'(tl.Stn1?:i~;t:i,.9i<+n
,.
In Che.rge ..
.. ~;;:.:.." !.I.~'I;:;~ ::"'/: ::...~~;.:\:.;;;.;.~ .>'~~~'
.
'.
,4. t
',' .: "
.... :.:.~ , ........
I' "
"
. L . H., Ht,RRIS, JR. , Veg~table Crop Est}.~ator
.,. ""f'\; :
:
' ..
.. . ', ,
":":
It,', i .
.
'0;
J]
...
3
GIE:co)~CGRA C~(Q)lP ~IE:f.p)Q)~1rlllN(G SJE~VllC'[
,
'
AGRICULTURAl.. EXTENSION SERVICE UNIVERSITY OF GEORGIA AND THE STATE DEPARTMENT OF AGRICULTI.'RE
BROILER CHICK REPOR T :TOR .GEORGIA
U. S. DEPARTMENT OF AGRICULTURE AGFHCUL. TllRAL MARKETING SERVICE 3t9 EXTENSI~N BLDG.! ATHENS. GA.
.!..i'ebruary 11, 1959
ATHENS, GA., i'eb. 11- -A total of. 6,233, 000' broiler chicks were placed with' produc,ers in Georgia duril1g the week ending ...~ebruary 7, a~cording to the Georgia. Crop Reporting Servic~. This compares with the '5, 943, 000 placed the
previous week and is 1 percent more than the 6, 16'5,000 placed the same week
last year.
Eggs set by Georgia hatcheries amounted to 8, 854, 000 compared with
8,390. 000 the previous week and is 5 percent thore than the 8,433,000 for the
-. carre sponding week 1a'st year.
.
The majority of the prices paid for hatching eggs were' reported within a
range of 50 to 65 cents wi.th.an average of S6 cents per dozen the same as last week ... Most pric.es charged for :chi'c~cs were.. reported within a range of $8.- 00 to $10.00 with ail:average of.$9. 25 the sam.e as last week. The average prices
last year. were 79 cents for eggs and $13. 75 for chicks.
Weighted average prices from the ""'edera1-State MarI<;et News Service for broile'rs during the ..we.ek.,enq~n3 ..:Tebruary 7 are as follows: Georgia broilers
2. 3/4 - 2$ 3/4 pounas, at farms 15': 07"; POB plants 16.00
. (See reverse side for other states)
GEORGIA EGGS SET, HATCHINGS, AND CHICK PLACE,MENTS
DECEMEER 6 THRCUGH .2EBRUARY 7 "
. ~. . ....
Week Ending:
.'
,: .8ROILZR TYPt
Eggs Set !!
j
C11icks Placed for Broiler s in GeorJia
EGG, TYPE -
Eggs Chicks Set HatcheJ
'.' I c: , 1957.- 5.8
.. 19,58-.5~
% of Yr. ag.o.
1957-58
1958-59
.Yo
Yr.
f ago
.
1959
, 1959
, . ' Thousands, '. . 0/0
: Thousands" %
Thousands
Dec. 6 6,478
7,420 115 ~ 5,036 5,388 I 107
Dec. 13' 7',000 ,. 8,146 116
5','076 5, 255 ! .104
Dec. ?00 f 7, 03'3 ' .. 8, 092 . 115
Dec. 27. 6, 890
7,844 ' 114
Jan. :3 7,,361
7,619 104
Jan. la' 7, 599
7,904 . 104
5, 094 5, 172'
, 5,401 5, 519
5 734 I 113
, . 1:;' 404 " II 104
5, 862 I 109
5, 74o!!: 10o!!:
532 403
,Jan. 17, '7,"859
Jan. ,24 . 8, 199
.8, 081 . 103 8',351 102'
5~ 524 ,6, 041
5,825
'5;74i
105
659
95 .' 672
494 462
Jan. .3-1 8,278
8,390 101
6, 142 . '5,943
97
713 453
,teb.' 7; 8,433
8,.854. 105
-
6, 165 6,233 101 1 I
663 571
-11
Include s' eggs' set by hatcheries producing chicks for hatchery supply flocks.
."
"..
.'
.
. ARCHIE LANGLEY Agric-.l1t~r':l1 Statisticiai1 In Charge..
W. A. WAGNER Agricultural Statistician
",
rEB L '59
U~AK\"'~
STATE
. Jan .., ,. " 24
EGGS SET AND CHICKS PLACED IN COMMERCIAL AREAS, BY WEEKS 1958-1959
.- .
. - ..... _. _L_
..
..'
;
Week En'di~g
, ". - . "
. ~.'
.
~
:
..
:
. Jan.
<F"eq .
Dec. ; Dec.: D,ec . Dec. . Jan.
.:ran. .... Jan.
31
'. 7
6
13
20
. 27
3
10
17
Jan. 24
Jan . 31
Page 2. ~
Feb. 7
Maine
Connecticut
Pennsylvania
Indiana
Illinois
.'
Missouri
Delaware
Maryland
Virginia
West y.irginia
North Carolina
South Carolina
GEORGIA
?lorida
Alabama
Mississippi
Arkansas
Louisiana
Texas
.
Wash-ingtoI)
Oregon,
California
EGGS SET - THOUSANDS "
I '. I', 512 .. 1, 651 . :-i";565
I _ 1, 134 ,. '1,229 '. ,1, '2-0:8 1-, 365 . 1, 244' .' , 1, .486
.' 1,857 , . 269
..' 1, .8.' 60 -
, 312 .
1,781 '29,B
.1,7.74 1,901 ' 1,,847 ..
. ' 2,082
4, 0'86 :. 2, 14'3 "
. 2) 521 2, 5.42 : 2, 591
2,219 281
-
2,329 322
'.
2,381 328
.3,426 :: J, 672
3,861
582 8,35.1
.. 597 8, 390
600 ...'~ .8,854 -,
396 ' 3,'664
2,819 4,097
707 2,673
447 410 ' 1, 584
436 3, 763
.2,946 4,277
741 2, '835 . 446
463 1,,488
3'93
3,666
3,041 .4,187
.
121
2,865
428
.502
"I, "620
TOTAL 1958-59
."
.
44, 170
45,530
:46,366
...
"
TOTA~ 1957-58 41, 074' 41;914 ,42,08'~
:
_ .. CHI.CK_S...P..L. ACED. ~ THOUSANDS
1, 04"2.
:
. 1,: 125 .
1, 169*
1,' 18-5>:'
1, 21 r.'
1~ 180
55'3>:< '567 :..: '!560
601
669
. 531
856
953 ' 911
714
873
784
81'0
163-'~'
943 163 .
.1319 . 743, ...- . 772
.737
152* . 138* ' :149 '.' 1'36
656
696
:722 ~. 665
685
.765
1,645 . 1,598 1,624 1,692 2,046 1,880
1,653 . 1,743 :. 1, 998 1, 852 1,84Q ,,1,838
l;.OOq
988 1~ 076 . 1~ 090 ' 1,014
506 - 490
511 . 562'- 601
2,439 2,.475 ,.2,480 2,081 2, 578
1,092 557
2,407
. '347
362* , 361
331 ' 324
323
5,388' ,'5,255 : 5; 734 5,AO{ 5, 862 5, 744
1, 251 532
570* ., 657
182 732 '1,797 1,688 1,016 437 2,207 320 5,825
249 -, 237
215
2, '628 . - 2, 773 2',863
. 1,903 1,972 '. 2,000 . 2,921 2,999 3,046
457 - 506 ' . 449 . 2, 165 2,211 2, 126
3-08 .. 259: 298
219 . 2$4
223*
955
878
7.8. 9
211.
~98 .
2, 366 2,87'1 .
1,946 1,999 3) .122 3, 306* .
3.90* : 477* -2; 105 .2,277
258
269
238
236
861 'I, 0-52
.,'
255 2,904 2,05J 2, 88'1
440 2,223
310 300 1, 196
205 2, 766 1,944 3,073
430 2,079
284 309 1,226
1,274 607 753 730 109 723
1,978 1,746 1,058
537 2,346
290 5,742
198 2,884 2,025 2,998
397 2,227
342 274 1, 118
28,929* 29; 447* 3'0, 126* 28, 555* 31,409* 30,534 29,530* 30,356
24,828 ,25,320 25,668 25,293 26,,741 -27., 033- 26,816 28, 539
1,280 576 709 639 174 738
2, III 1,741 I, 101
532 2, 681
316 5,943
178 2, 964 2,059 3, 172
433 2, 136
385 205 1, 108
31,181
28,826
1,286 648 778 613
. 120
800 1,837 ~ 1,902 , " 1,094
572 2,721
363 6,233
236 3, 104 2,046 3,044
396 2, 127
339 240 1,074
31,573
29,209
% of Year Ago
:
* Revised.
108
109
' 110
...
116
116
117
113
117
113
110
106
108
108
(;2
GIE:((J)~(GllA c~(Q)r JRIEJP>(())IRrrllNCG [~VllCCI&
AGRICUL.TURAL. EXTENSION SERVICE llNIVERSITY OF GEORGIA AND THE 51'ATE DEPARTMENT OF Ac:.RICUL.TURE
U, S. DEPARTMENT OF AGRICUL.TURE AGRICUL.TURAL. MARKETING SERVICE 319 EXTENSION al-DG., ATHENS, GA.
February 16, 1959
to
LIVESTOCK ON GEORGIA FAFU1S JANUARY 1, 1959
Estimated inventory n'rmoers of livcc+'ock~~nd poultry on Georgia farms as of January 1, 1959 showed decreases from a year ago in the number of cattle and calves, sheep and lambs, horses and mules, and turkeys. The number of hogs and chickens on farms showed increases compared with a year earlier. Changes in inventory numbers by species were as follows: cattle and calves, down 2 percent;
sheep and lambs, down 15 percent; horses and mules, down 12 percent; turkeys, down 3 percent and hogs, up 5 percent; chickens, up 10 percent. (Estimated
number of livestock and poultry on farms is shown in the table on the back of this report).
The total value of all livestock and poultry on Georgia farms January 1, 1959 was '::;218,009,000 compared with ~~178,121,000 a year ago. All species except horses and mules, sheep and lambs, and turkeys showed an increase in value. The increases were due primarily to a higher value per head as only hogs and chickens
failed to show a decline in numbers.
Valuation in thousands of dollars, by species in order of rank for 1958 and
1959 respectively, are as follows: Cattle, (~119,042'and $151,500; hogs, ::~39,832 and ')46,102; chickens, $10,481 and ~}12,064; horses and mules, ~~7,57l and ~)7,425;
sheep and lambs, (;1,030 and ~p758; turkeys 0165 and $160.
.
DISTRIBUTION OF GEORGIA LIVESTOCK VALUES BY KINDS ON FARlvIS (Percen:rof~totaiValue of livestock""=JarlUary 1, 195~
Cattle $151,500,000
\
69.5%
*Sheep and Lambs <.:i758,000 - .4%
..........~_ .......
ARCHIE LA.NGLEY Agricultural Stati~tician In Charge
/
.- ,/
WILLIM1 E. KIBLER Agricultural Statistician
UN1'1rRSITY OF GEORGIA
FFB 18 '59
UBHAR1CS
~ "
,.
....
(":J
LIVESTOCK ON GL!:I)RGIA FAE-1S (IN THOUSltNDS) January 1, 1950 - 1959
Year
.1\.11 Cattle
fond
I._~-_._---
Cm',s &
I
Other
/"
Heifers
CO"rs 2 Yrs. H01s
i 2 Yrs. &. ' .l\.nd . l.l\.nd
Calves
CIder Kept Older
I For mlk
-----------..:.----~,---,-..:..ri-,-.-~ -"
I Pigs
i
i
Sheep ,And
Lambs
I I - - . , - - - - - - - - - - : - - - - - Chickens Horses (Excluding Turkeys
And' Mules
I Commero ial Broilers) I - - - ,-, ~----
,- '1;000 He~d -
1950 ::'1,040
3q4'
193" 1,667. 9 , 257 , 8"llq .' ',:, 52
1~5,l,,' 1,liJ ,: 364" .232, 1,800 '10 .: 244
'8,029 ".,' 54,
1952"
1953
1954 1955
1',247 . ' 364 I I,' 2,$2 I 1,9,08 11 '215
8,298" 51,
1,,4~2' 357,',! ,', '3.75" ;!.,698" , 1 4 ' , 192 " .7,7'75. ,'.' 54',
1,564" . '353"" .. :45,2' " '1,4'43 I? " : ,,;: 166
"7,,941.~,,, 59,
1,627
346" 518"" 1,472 21 '150'
8',5,3.2", ~,,, 6~,
1956 1,562 1957 1,$46,
332
517 1,563 46
138
. 329" ' ,,512,. l~ 73.0 " ,63 ; 12)
8,23l
63
8,.559, 66
1958' '1,546 r ',326. d." 512 ',' 1,695 ',56 :.
1959, 1,515,
,J13;,' 52~, 1.\'780 4,8
ll~... 8,7j4, 'L' 37.
99
9,,6,51: .. , 36
,
t'
'j ,
" ANNUAL LIVESTOCK ,AND POULTR~ INVFNf:'0RY ---JA~JUAn~ 1., :I;?5~ -:-UNITED ,STA~~
,
.
.,
.I
.",',.
'..
',
'
, "Cattle !lUmbe'r.s dn J~nu~ry 'l,~ ,1959 ,at. !96.~' m':llli:a'ri"head \"1ere, 'Jip '4' p~i~ent; or'
3.5' m:i.:Uic)n head:, 'from a ye~r' earlier~, and l-1ere apo-q.t the, saine as'the ,previous record reached January 1, 1956. '~liik cow' numbers clec11ned '3 percent to 2i.6
million head--the smallest number $ipce 1921. BeBf cow numbers: increased 5 per-
cent and all'other beef stoc~'t~a_~ 'Up from," a 'year; e9-rlier.' Hog nw:nP'ers increased
12 percent from January 1, 1958 largely due to the'increase in the fall pig crop.
Inventories of all sheep and lambs were up 4 percent, and stock sheep nwnbers were
also up 1.~ percent from a year earlier. Horse and mule numbers declined 8 percent during the year. Chicke~.and turkey invento;ies'ipcrease~3 and 6 percent
respectively from Januqry 1, 1958. The total inveni!0ry value of all livestock and
poultry on farms and ranches January 1, 1759 'Has, :!P18;1 billi'o,n--up 29 percent from
a year earlier.
CATTLE: The '~umber of cattle and ca~';'es 'On "farms and ranche.s in the United States increased 3,501,000 ~E!ad"or 4 percent during'1958. The total
number on January 1, 1959 was 96,851,000 ,head, about the same as the previous
record inventory of 96,804,000 head on January 1, 1956. The number of cattle and calves on farms and ranch~s ~t th~ beginnirlg of 1958 was 93,350,00Q head and the 19~8-57 January average i~i:87,994,DOO head. The inc~ease~during 1958 was the first since 1956 and represenus'one of the larger uptur~s tecorded in the cattle industry. This increase, however, t-las moderate in cornp~i:son with ,the massive up-surge in nwnbers which occurred during 1951 and 1952 at 6 rrdllion head each
year.
HOGS: The number of hogs on farms January 1 totaled 57,201;000 head, the
largest since 1952. This number exceeds a year earlier by 12 percent
ana is 4 percent larger than average. I!wnbers in the North Atlantic region were
down 1 percent but all other regions showed increases ranging from 4 to 14 per-
cent. The largest regional increase--14 percent--was shown by the North; Central"
States which had 75 percent of the U. S. total.
'
BHEEP: The number of stock sheep and lambs on farms and ranches January 1,
,1959 at 28~364,000 head was 4 percent above the ~1,327,000, head on
Janu?-ry 1" 1958'. : This': j.va~, the largest inventory, number 9i~c~ ,January J., 194~., Tne number of sheep' anal~mbs on feed for market at 4,280,000'head was 7' percent more than a year earlier. All sheep and lambs, including those on feed for market:
totaled 32,644,000 head, a gain of 4 percent from January 1, 1958.
HORSES A~ID MULES: The January 1 inventory of horses and mules is estimated at 3,079,000 head. This was 8 percent below the
3,354,000 head on January 1, 1958 and only about 51 percent of the 1948-57 average of 6,075,000. The decline during 1958 was consistent throughout lTIOSt of
the Nation except in the Western States where the decline amounted to only 2 percent.
CHIClillNS: Chickens on farms January 1, 1959, {excluding commercial broilers) totaled 383,257,000. This was 3 pe+cQnt more than the 370,884,000
chickens on January 1, 1958, but 8 percent beloH' the 1948-57 average. The number of chickens increased from a year earlier in all regions of the country except the North Atlantic where a decrease of 1 percent occurred. Increases l-1ere 8 percent in the South Central region, 7 percent in the South Atlantic, 5 percent in
the Hest, 3 percent in the East North Central and 2 percent in the \\Test North Central. Chickens on farms January 1, 1959, consisted of 243,829,000 pullets, 119,565,000 hens and 19,863,000 other chickens, compared with 224,619,000 pullets,
127,891,000 hens and 18,374,000 other chickens on January 1, 1958.
3".
I 'D9/)(/",
G E 0 R G I A Cit 0 P A E PO R TIN G S E R V ICE
GJlfl3Agricultural Extension Service
U. S. Department of Agriculture
University of Georgia and the
Agricultural Marketing Service
S_t_a_t_e_D__e_p_a_r_tm__e_n_t__o_f _A_g_r_ic_u_l_tu_l_;_"e '" . . ,
-319 ~xtension Bldg. , A.then.s, $~
.~~~--~-----~.-~-.---~.-~-
~~
l_~_
... . "
..
.. ..,
.
~
'.. I ~.
GEORGIA CHICK HATCHERY. REFORT
February IS, 1959 l.
;
Atl,tEms, Ga., February 18- -A. total 'of 6,270, 000 broiler chic;ks; were, pl~ced
~th producers in Georgia during the week ending February 14, a~~ording to the
Georgia Crop Reporting Service. Thi.s compares with the 6,233,000 placed the
previous week and is 3 percent more than the 6, 108,. q,oo placed the. same 'We~
Hut year.
'.. . .
. . . : .... .
". "0" ...
~.~:",'::.. ':'... :.....;..... -.....
.
~
l
Eggs set by Georgia hatch~r\~s amounted to 9) 1.75, 000 compared wit~ i
8j 854, 0<;)0 t~e previous wee~: apci is 9 percent .more .tJ~an the 8, 411, 000 for 'the ;
c9rresponclipg. week last y~a:r. ~"':: ;. '::: ' , ' , , ,
'
I
i
.
i
\ iThe ~ajority of the prices paid for hatching eggs were reported within a:
r~nge'.of 50 to,65 cents with an.. a.v.erage of 57 cents per dozen compared with' a ~
ra;nge ~f, 50 tb 65 cents with ah.~Y;~J:age ,of 56 cents per dozen last week ..:' Mo:st ! pll;iceEi ch.a~ged for chicks vjer~.'r:-ePortedwithin a range of $8. 00 ~o $10.00 with\
a'D! ave.rage 0, $9.25 per hundred compared with a range of $8. 00 to $10 ..00 and ~
a~;ave'rage of $9. 25 per hundred last week. The average prices la~t year werei
80~cenfs for ~ggs and $14.00 fQ~~ Shicks.
.
\
::\ ~Vei~ht~d average :~ri.ces '~!im th~' F:eder~l'~StateMar'k~t News ser~ice':~or\
bri~ilet"s duri~gthe week ending E"'ebruary 14 are as follows: Georgia broilers :
2.:}/4 -: 3 3/4:poupds, at farms 15. 7l~; FOB plants 16.61.
\
'I
M4
~.".,
i'!
.
~.
(see rev.er.s.,e ~ige .for other states)'
.... . .... ' ....~ ......,
.
1
. GEORGIA EGGS SET, HATCHINGS; AND CHICK PLACEMENTS,.
~I
.
'..
,"';1
We~k
... Eli,thng .. (
.,
",'
,DECEMBER 13 THROUGrI ]fEB'RUARY 14
I".
BROILER TYPE
,
". -. '1
qhicks 'Placed for
. ',.. I
Brailer.s'in Georl:!ia
1957.. 58 1958-59
i % of
IYr. ago
EGG TYPE Eggs Chi~ks \
Set Placed i
1959 1959
DeC:, 13
DeC.. '.20
Dec,~ Z7
Jan.. 3 f
l7 Jan. 10
Jan;.~ Jan;':a4 Jan:")l
Feb. \7
Feb~'1;4
:......,
Thousands
7,000 7,033 6, 890 .7,3(>1 7, 5997,859' 8,199 8,278 8,433 8,411
8, 146 8,092 7,844 7,619 7,904 8,081 8,351 8,390 8,854 9,115
I%
i116
115 114 104 104 103 102 101 105 109
,1
Thousands
5,076 . 5, 255
I5,094 5,734 5, 172 .. 5,404
5, 401 . .5, 862
5, 519.' . '. i5, 744
. I 5, 524 ' 5, 825
I 6, 041 .' 5, 74~
I 6, 14:2 .5,943
6, 16~ '. ;. 6,2.33
6, 108 6,2.70
1
%
104113 104 109 104 105
95 97 101 '103
ThousandS
532. 403 .. 659 494 672 462 713 453 663 571 653 545
11
t'n~ludes
"';
\
eggs. set by hatcheries
producihg
chick.s..~.o'.r .h. ~. tchery,.supplyflo.c..ks'.::.
:~'~.\. A~CFnE :LANGLEY
". :'.
" .... '':''': .;.. .
'w. A. WAG~ER"
----?-------------- --- ';- -- -------:--.: Agri~dlturalStatistician In Charg~'
;
Agricultural Statist~'cian
--,-~~:- ~~:- -~: ~- ~';-::-,: :,~ ~~-,"-:~ ~ ~:~
..
:".f
....
. .'
.... :...
,'~; ~:.~ \",' M'" ,,' ':';' ..:.,;.''';'':'': f;,
~ .:
-, I' l..... .....
,." ~ ',: . '..
.... o.
.' '.: '.
.. ,
FEB yq,'S9 .. RI[S . ~:1 : ." .... ..' ::.
. ..
. '.11
. '.
tl .,' '.,'
...
'".,
..
\.'
,EGGS SE'F"ANP CHICKS:~:PLACEDIN;COMMERCIAL AREAS, BY WEEKS:'1958.~1959':
STATE
Maine
Connecticut
Pennsylvania
Indiana
Ilhnois
Missourf
Delawa.r'e:
Maryland"
"
Vir'ginia
West VirgiI},ia , North Caro~ina ., :
South Carolina
GEORGIA
Florida Alabama Mis 's-i ~ sippi Arkansas Louisiana Texas
Washington Cregon California
,
.
~ ,Week Ending
Jan., 31
,:' Feb," 7
. F'eb, 14
Dec. .. ':. 13
Dec, 20
Dec. 27'
Jan.. Jan.
3
10
Jan. 17
.;ran, 24
Jan. 31
7
EGGS SET - THOUSANDS'
CHICKS PLACED - THOUSANDS ,
1; 651 1,229 1,244 1,860 _ ::312 ;.. 1,,:901
:,' 2C, ..Ht6
2, 542 2,329
322 3,672
591 8,390
,436 3,7,63 - .2, 946.
4,277 741
2,835 446 463
1,488
1, 565 1,208 1,486 1; 781
298 . 1'; 847 '2;143
2,591 '2, 381
328 3, 861 :. 600 8,854
':.393 3'~ 666
5; 041
4, 1~7 721
2,865 428 502
1,620
1,'637 1, 175 ...
1, 36'2 1,968
373 '. 1,834 : 2, 150 , 2, 713 ..2j:6~3. "
370 3, 85.0;, .
597 , .:; 9,175,
449 , ~, 897
3,076 4;'465
709 2,996
413 477 1,654
1, 125 1, 169* 1, }85~ 1,211
567
560
601 .
669
953
911, 714'
873
943
819
743
772
163
152*
138*
149
696
722, 665'
685
1, 598 1,624 1,692 2,046
.. !, 743 1,998 -, ~ 1,852 1., 840
, ')-88 1,016 .' 1,09,0 1,014
490
,'5J 1 . 562
601
2;,,475 2; 480 '2, 08l " 2,578
362* ' 361
33 ~ .. : 324
, 5, 255 5, 734 , 5,,404 5, 862 .~
237
215' ; 211
298
'2,773 '2,863; ~,366 2,871
1,972 2,000' 1, 946 1,999
2,999 ,},046 3,122 3,306*
506
449
390* 477*
2,211 2, 126 2, 105 2,277
259
298
258 '
269
254
223* 238
236
878
789
861 1,052
1, 180 1, 251
531
532
784
570*
7~7
657
136
182
765
732
1, 880 1, 797
1, 838 1, 688 1, 09 2 ,: . 1, 0 16
557,, 437
2,407 '.: . 2; 2'07
323
320
5,744 5,825
255 '2, 904
2,051 2,881
440
2,223
310 300 1, 196
205 2, 766
1,944 3,073
430
2,079
284 309 1,226
.. -.
1, 274, ..: ',1,280
60'7,' ~ 576 ,.753, ..' ~ 709
730 :' 639
: 109
'723
,
,1;978 1;746 1,058
.174,
. 738
l,l11
i, 741 i., 101
537 : 532
2, :346 2', 681
'290 '316
5,742 5,943
198 2,'884 2,025 2, 998
397 2, 227
342 274 1,118
'178 2.'.964 2,'059 3, :172
433 2, 136
385 205 1,108
Feb. 7
1,286 648 778 613 120 800
I, 837 1,902 1,094
572 2,721
363 6.233
236 3, 104 2,046 3,044
396 2. 127
339 240 1.074
Page 2
Feb. 14
1,272 668 724 744 130 848
2,063 1,716 1, 168
580 2,870
404 6,270
205 3,263 2, 109 3,216
412 2,214
382 215 1, 163
TOTAL ,19:5'8,-59 TOTAL 1957.-58 11k of Year Ago
45, 530 46,366
41,914 42,086
.l()'C) .
l'io,.
47,973 42,392
:". 1:13' :'.
*Revised:
29,447* 30,126* 28,555*"31,409* 30,534 29,530* 30,356 31,,181 31,573 32,756
25," 320 25, 668 25,293, '26, 741' 27, 033 26,81'6 28, ~39 28,.'.826 29, 209 29,495
---.l 1'6
117
q
-117
113
110
106
108
108
III
CG1E(Q)~callA ce1~(Q)IP? ~lEJP(Q)~1rllNCG ~lElR{Vll(cIE:
AGRICULTURAL EXTENSION SERVICE UNNERSITY OFGEORGtA'ANO THE: STAT!E O.EPARTMENT ;OF AGRICULTU~E"
:Athens,' Geor.gia.
U. S. OEPARiMENT OF AGRICULTURE AGRIC'ULTURAL Mt;RKE"J:'!NG S.ER~lCE 319 EXTE~ION BLOG~. AT~E~S. {iA . ,
.2ebrli.ary 19, 19-59: , '!
,.
"
,
#
;
PULLET CHICKS l'''OR BROILER HATCHERY SUPPLY ZLOCKS
,'. : . January1959- United States
; : " ".J.. I.:
',. _ i
,I
. J#
,The .indicated placement of pullet chicks for broil.er; ha,tch~ry ;su.pply.'t'i..o~ks..
by leading primary breederso broiler replacement stock.totaled,Z,;} H, ,0,00. : :,:
chicks tluring 'January 1959, This. wa:s 7- percent more than.in January 19p8 ...,.;
..
.
The -totals include pullet chicks :sold dUl1ing the month, ;plus the number 9f
pullet chicks expected from eggs sold during the ,preceding ~onth... The con~.. ';,
version from eggs to expected pullet chicks was made on the basis of 1Z5 pullet
chiCks per "cas:e of hatching eggs so1:..1. The ,pr.imary breeder.s', induded in this
report aCCOunt for a' very large percenta'ge of tot-al supply: of ,replacement.pul-
lets for 'broiler, hatchery suppl;y flocks," 'Sale s of replacement pullets by these,
breeders provide an indication of the potential number :o.. plil~ets availa1Jle fQr.
addition to hatchery egg supply flocks several months before the pullets will
actu~lly rp.9.v~ into ~h.e gociCS.
.
. .' ... : .:.. : '~'. .. .... .,...
PulletChicks 11 Placements for Broiler Hatchery Supply Flocks
- (rep'orted :)y'leading breeders')'" .. ,'..
. ~" ~ ...
~
'. .
Mo~h
..,- '1957 .
1958'
., ' . " " ,.,
'195'9'
1959 as peicent . of 1958' ,_._-,
~
..' ..
1,000
chicks
,1,000 chicks
. ,1, 000 chicks
Januar{ . ':
'.: 1,886 .'
l,98Z
'. 'Z, III
?ebruar-y .. : , . ; : ..: March.... , .. , "'.:
1,997 Z, 53'8' ::;
~Z, Z70 . 3; 118
April.'::.:;
: .. : 3, '033 .",,", ' .. .'3,3Z0
May
-: ';,: Z, 899
3';6Z3
I"
June , July , . , . ,
'.. :.:, Z,060 '. '. : 1,676
3;390 , 3; 054
'. ,
August
,
', .. : ' 1,410
Z,646
September
, '.. , : " 1,935
2,700
October ...' ..: .. '~ :'. ;', ::' Z', 'Z97 " , .. ...... Z,'568
November, . " .. , : l,9Z6
Z, 141
Decemoer .. ,. , , :. , Z, Z38
l, 147 .
'.
Annual Total. . ,' : "'Z5-, 895'-
, 32, 959
Includes expected pullet replacements from eggs sold dur~rig the preceding month at the rate 6f lZ5 pullet chicks per 30-dozen 'case' of eggs.
U, S . .i:....rozen Poult~y Stocks as of t:h'e End. of the Mo~th
C, lass
J, '
January . 1954-,58 avo
1,ODO
pO,un'ds,
January. 1958 , .
'
,.
Decelnber 1958' ,
.
.'
1, 00'0 pounds
."
'
~
1,000 ' pounds
.,
-.. "
January
1959
., 1,000 -pounds
Broilers' or fryers, . ; Roasters ............. : Hens, fowls, ....... : Turkeys ........ , .. : Ducks ............ , .: Unclas sHied........:
Total Poultry .. '.' ..:
'ZZ,844
-. 9 , 50"3"
60, .110 138,903
5,8'41
35,759 Z72,960
19,49,9 c ":
5,477 ' .
6Z,673
179,390
3, 597
31,346
, .. 301,98Z
.,
34, 6Z1 ; '., . 3Z, 757
9,773 .!
9,656
87, 885,
t"
.'
80,016
162, OS'5' . , 5,686' ;
. 46,583"
346,603 )
160,406 . ". " 4,134 ,
45, 190 ;33Z, 159
I ~ J. .... .,
...~ '
.'.'
I: .,J
..' ,-, : .
i .. ;j
..'
"
"
.-",
'I
..
;I
'.
.~ )
,
CHICKENS TESTED
.( . . I
r" ~
t.~ ".'~:'
.. " ":I~:Ge<>'r,gi~' 564,"491 chi.ckens for supplying b~~:il~r ~~tc:,lling eg~.~ .~~~~ tested
for pullohitn disease during"January 1959--36 percent' more' tnan the' 414,416'
tested in Ja'nliary 1'958. :Te'stings of egg-type chickens for Janua'ry were:34; 194
almost 55 percent of the number tested in January last year. .
I :.
'... '., \
'!. ':,.'" , \ '. . :"""" ~ I ~ r
In the states for which cotnparl.-sons are available 2, 601, 927 chickens for
supplying broiler hatching eggs were tested during January 1959--up, 29 p~.rcent from:.January.1'958.;. Testing.s July 1958 through January 1959 tot~led 17;'3)6,5~3
up 20 p'erceht from this period a year earlier'. The number 'of 'chitk:en:s <fdr', : : .' other.purposes(egg,;.type).tested during January 1-959 tot'ciled '1', 648, 821~-5 per,;.':
cent less than the number tested in Januar}r 1958. The num:':'er of egg-typ~,
chickens' tested July; 1-958 through January 19'59'tcitale&'l'I, i-yi; 769-'~do~'j ~e~-
cent from the per-iod a year eatlier.
: \ '.
''';
' , , ; (;.. ', .. ":;1) :' :: ".,
,) ~..:, ~: i .- :
' . '.
:
.~.,:
!, .,.' ",..' .~
:
. . '!-
:J.T,his .report is made:pos.siblethrough the' cooperation bithe N~tionarpoult~y
Impro.\'.ement Plan. official state' agendes",th'eAnimal HU'Gban~ry'Re'search; ..\/.; ':
Division. Agricultural Research Servi~e, and the Agric:ultural- E:sti~~te$ DiVision,
Agric.ulturali Marketi.ng Service. " , ' . -
' . . .: ..... 'i ...; ...' .;
!j 1\1/ ,:,.. ~.
,"
I
':. ~
\.,!~. r..\.:'~ ",~. ~"" ;~'J;'.,. "
Georgia - Chickel1~ Test~(Lby Official State" A'genc.ies .,:
.,:.; ~I W:
:
.. f.~ j , ,
Month
- ....... '.:'" " . ~ _....... .......
" ...... ': 'By Months
(.
1
.'. ',1957-58
oJ i; :~.:
~
. 1958-59
,~
July .. : 202, 1<)4 . . 253,865
Cumulative
:
By Months
195~-58 :. 1958-59: '. . : 195' 7-58.: 1958-59
io~, 194
- - iS3., ~6'5
..-. - ,. .. "'.. .. " ..... .. .....
17,274
30,299
Aug.
: 230,292
Sept. !-. ,': .334, 522
240.,302 413,264
432,486 767,008
494, '167 47,736 907; 43'1' 18,286
42,581 35,652
Oct. \ : 306, 795
Nov.
: 254, 554
458,442 388, 136
1,07l,803 1, 365,,873 27, 242 . , . 41; 0'4'3"
1, 328,357 1, 754~'O09;
8,325 . , . 26'.:,'-lS&"'.1' ....
Dec. Ja.n. Feb, Mar. Apr. May June
: 252,517 : 414,416 : 275,750 : 255, 111 : 211,093 : 254,024 : 185, 343
432,318 564,491
1, 5e~,,874 1, 995,.Z90 2,271,040 2, 526, 121 2,737,244 2, 991,,268 3,176,611
2, 186', '321'
2,750, a18'
. ,..~ . ~.
: .' I :~
.1\::- f
.. f~t ~
~
'.
.,
14, 836 . , 84, 778 ';.
61,618 ,34,194 "".
13,675 . , ..... . - ,
12, 0-86 .
. ....
",'t' .' 'I
57 426 i
i: . . . ~ . . . I ':
...
10, -849, . 17,445 '
'J ~; ~) # .. . ' . ;
, . . , .:' ~ .. .:.
.. . , , '"
j.
.',;,', .....
"'i I
,... ~~. ~.j,
.J
.."~'
... '
United States - Chickens Te~te~ by Offici.~~.Sta~e Agencies,,' .',
.-
Month
For Broile'r Production . , ""'.': ,'....:~~6r,'~gg t:YPe,. thl~i~e,n~.~;: '~~:':~~-
. by Months!! '., .
- ,\.~ t 1 ..: ....,. I;>y. 'Months l-{;:-'i"'!: .....:.
1957-58
1958.- 59
.-,.'.- . )9~~,-5.8,,: '!: .,19-58-59
July
Aug. Sepf." .. :.
Oct. .
Nov. Dec. Jan. Feb. Mar.
Apr ..... ; May,.: ..
June .',. :
1,310,'378
1,600,805 2,"310, 549 2,723,936 2,225,580 2,208,307 2,014,868 1,282,382 1,587,391 1,701,022 1,554,643 1,310,490
1/ Ail states except Mont.,
1, 628, 129 .'
'363/153
1, 956, 79'1. .2', 64'3'" 740 . , 3, 119.,,15'43-/
.. ,--..,6.. 7",'6.. ' :.1'6.'l' 1, 2:;t1, ,l70 2, ~.7\9, 47,1
2,951,368 J
2,483,28'0
2, 79~, 87~:
2, 5-86 .. 4,56
.. 2, 60~ .. 92.7 .::
1,.741 051 ,It 54 '617
p;
.4'85,.\36
1245.,..750
~16... 008
.
'.
.'2.89,'.142
N. Mex. ,.. Ariz'-, 'N~~.-" .. ".'
500" . ssa
..
L
599,
243,
660578
'~
..".
2, 316, 782~
2,342,596
.. \'., 2 ...48.5, 747 I :.)': _
.. 1~ 648 .. 82I! .. ~ " j}
0-'
,:. f
~ :' ~
.!,- I
. ,,':' '., I
;. I:",
.
j
2/ All states except Ohio, Del., Okla., Mont., N. Mex., Ariz., Nev.
3/ Revised.
ARCHIE LANGLEY Agricultural Statistician In Charge
w. A. WAGNER
Agricultural Statistician
3/5
GE ORGIA CROP R E PO R TIN G S E R V ICE
gricultural Extension Service
U. S. Department of Agriculture
University of Georgia and the
Agricultural Marketing Service
State Department of Agriculture
319 Extension Bldg., Athens, Ga.
-------------------------------------------------------------------------
GEORGIA CHICK HATCHERY REPORT
February 25, 1959
Athens, Ga., February 25--A total of 6,419,000 broiler chicks were placed with producers in Georgia during the week ending February 21, according to the Georgia Crop Reporting Service. This compares with the 6, 270, 000 placed the previous week and is 5 percent more than the 6, 132, 000 placed the same week last year.
Eggs set by Georgia hatcheries amounted to 9,615,000 compared with 9, 175, 000 the previous week and is 16 percent more than the 8, 302, 000 for the corresponding week last year.
The majority of the prices paid for hatching eggs were reported within a range of 50 to 65 cents with an average of 57 cents per dozen compared Vii: th a range of 50 to 65 cents with an average of 57 cents per dozen last week. Most prices charged for chicks were reported within a range of $8.00 to $10. 00 with an average of $9.25 per hundred compared with a range of $8. 00 to $10.00 and an average of $9. 25 per hundred last week. The average prices last year were 80 cents for eggs and $13.75 for chicks.
Weighted average prices from the Federal-State Market News Service for
broilers during the week ending February 21 are as follows: Georgia broilers 23/4 - 3 3/4 pounds at farms, 17. 05~; FOB plants 18. OO~.
Week Ending
GEORGIA EGGS SET, HATCHINGS, AND CHICK PLACEMENTS
BROILER TYPE
EGG TYPE
Eggs Set !.!
!
I
Chicks Placed for Broilers in Georgia
1957-58 1958-59
% of .
Yr. ago
1957-58
1958-59
i % of
/Yr. ago
Eggs Set
1959
Chicks Hatched
1959
Thousands
7Jo
Thousands
%
Thousands
Dec.20 7,033 8,092
115 5,094 5, 734
113
Dec.27 6,890 7,844
114 5, 172 5,404
104
Jan. 3 7,361 7,619
104 5,401 5, 862
109
Jan. 10 7,599 7,904
10~ 5,519 5, 744
104
532 403
Jan. 17 7,859 8,081
103 5, 524 5,825
105
659 494
Jan. 24
8, 199 8,351
I 102
6,041 5,742
95
672 462
Jan. 31 8,278
I Feb. 7
Feb.14
8,433 8,411
Feb.21 8, 302
.
8,390 8, 854 9, 175 9,615
I 101 105 109 116
I
6, 142 6, 165 6, 108 6,132
5,943 6,233 6,270 6,419
97
101
I 103
! 105
I
713 453 663 571 653 545 732 590
!J Includes eggs set by hatcheries producing chicks for hatchery supply flocks.
ARCHIE LANGLEY
W. A. WAGNER
Agricultural Statistician In Charge
Agricultural Statistician
--_.,._-------------------------.---~---------------------------------
UNIVERSITY OF
FEB 26 '59
L1BHA,(IL~
'I
<GJE))~CGllA (CJR{CDJP> ~lE:]P> (Q)IFtfnN<G 5)lE~VllCClE
AGR ICUL.TURAL. EXTENSION SERVICE UNIVERSITY OF GEORGIA AND THE STATE DEPARTMENT OF AGRICUL.TUR
'Athen's, 'Georgia
U. S. DEPARTMENT OF AGRICUL.TURE AGRICUL.TURAL. MARKETING SERVICE 319 EXTENSION BL.OG... , ATHENS. GA.
Pebr~ary 26, 1959
CALf: CROP, 1958
"
.
.... .,
~..
..
GEORGIA: Th.e. 19~~ calf crop for Georgia is. estimated at 679, OQO head,,a"lie ..
.. ' '.:: : crea,se. of :; pe~cent from the 1957 calf cr.op of 698, 000, head. The
estimate for .19:58 'is' 27 percent above the 10-year (1947 - 56) av:era.ge 0. 534, 000
head,... '" .".. .....
..... .
-" ,....
..... , '. :':". -., " , .......
. The~.:lecrease in the calf' ,crop' fer 19:58 was due in part to fewer 'cows and
heifers two years old and over on farms January 1, 1958. The numiJer; of calves
born as -a. "percent 0. 'Cows and 'heifers' two yo'ear's old and ~14~r' a.1s9. -showed a .. '.
decline f'r.om:'19 57, The calf crop expre s sed a.s a. per,~e.nt.age of c'o:ws 'and he'fi'e'r s
'two yea'rs .010. an'c;l :older on farms d~opped :rom 83 'percent i11 1957, to 81 percent
in )958,;' ~hile the number 0, cows and heif~r5 two year s old and .o.v~r declineQ.:,
from 84~;'OOO January 1, 1.9.57 to 838,000 Ja.nuary':J, 1958,"
I
J.
\"
.
.' '.. : .
..
I k;
.
/. ~ .
UNITED 'STATE'S':'" CP',Ll"" CROP 1 :?ERCZNT SMALLER -~ ',The Unite~ States.;'
.. ': ::', .... _.' :- ..... '. '" ., , . ..
"'.
. . .. . . ca:lf'c:rop in: 19,~8,
totaled 40~ 5~4, 000' head, a decline' of 1 percent f~drri t~e. 4.0,;', 7~6., 000 h~ad 'i-n- \......
. 1951', This'vlas'the' fourth'corisecijtive ye'ar' to "show.. a.deGrease. Tpe 1958 ~~op
was5 pe'r.cent b~low the rec'ord 195~ crop of 42, 691, 000 ~ead, ho'wever:it wa,s.
1 'p"'er'cen:f'a:b~ve ~he 1947- 5~ average. All regions e?,c,ept the 30uth, 'C,entral an~
the West'$howed'~eclinesfrom 19~7.
':
"~i." .
in
.\0"
"
',,: .1 Th'e decrease
:.
the calf crop 'during the past. year re,'sulted. fr'o~ a de'cline"
in cows ai"ld heifers 2 years' 'Old and .over. The number of all cows arid heifers .. ',-.
Z years Old and. ove~ :.Janl,laJ"Y l, .195.8 was 46; 520, 000 head, 2 percentless than'
a yea., r:'e~ ~. rl.ie.~.
..
.. .
... .-
'.: .' ,
The number of c:a.lv.es' bo~n. ip ~958 ~xp'r.e$sed as a per,ce.nt. of the cows and , heifers ~ year sold 'and over January 1, 1958 was 8.1 perc'ent, 1 percentage point
abqve ooth.19 57 and the 1947 - 56 average. This pe~centag'~ is not s'trictly a .::' calVing rate, sirice the January 1 inventory of cows and hei,fers 2 years :010. an.d' , older do~s not include all heifers 'ov..hich would give. .birth to calves during the' year and since the inventory includes some cows that are sold before ca.-Iving ..
The percentage is calculatedto sho'rV the trend in productivity over a period of' ,
time. It .may fluctuate from year to year due to variation in cow slaughter during the year and, trends in breeding heJ;'d replacemeht. .. . ' , . . , " . ,. .
'SbUTHERN STATES: In the South Central States ttlfcalf crop in ,1958 was
. . " , ..
10,578,000 head, . 1 ptcent ,above "the previ'o~s year, while
in ,the South. Atlantic States the calf crop totaled 3.-303, 000 hea~l, 2 percent be"; low 1957: The calf crop expressed as a percent of'cows ana h~ifers 2 years o~d
and older. was 84 percent in:the Soutt} Centr~~ State $. 'compared, with 82, in 1957.
The South Atlantio States, at"78 pet'cent, we're 1 p~i:'ceiltag~ 'point "lower than "in'.
1957.
'."
'."
.
i
ARCHIE LANGLE Y Ag:1'icultu:ra.l .3tat.isUci~n. Ip. .\l).a,J"ge "
,.' .
~:
~t-.RL 0 .. POESCHER '
Agl'i-cultural Statistician
'."" ;
:, i '
' .. /
,
.'
t4
/ .. '~' '
'; .~
, :1'
~
.
.. . .' _.' ~.]
~. :.
'!
." : " .
..
MAR 2 '59
i:.~
.,
:'J'
,.
,. t ...~
CALP CROP, '1958 . '"
yr.s.: .' '.. '.. :. . ,Co,,?-,'s .an'a 'helie'I" s
, .:: ',,2
l!,t. older
State
: '" Janu~;ry' '.1
: Calves born as per-cent .::
: :
of yr
cows s. &
and h older,
eifer Jan.
s12~: ./
:
:
"
. Calves porn..
and
Diviaion :10-year:
: 10 r year.: . ,
: 10-year :
1/
:average: 1957 : 1958 : average: 1957 1958 : average: 1957 1958
-
. : 1947-~6:. , :
"
J
).
: ~947-56:
~\
.
:
.
.
.
..
.1
94 .;
7
-
5
6
..
;'
.
:
~
1, ~OO:' 1,000 1,000
. . . . . 1,0'00 1,: 000 1,000
head .head' head' percent percent percent head ::. head 'llead ;.
,',
N.A. Ohio
- - --- -- -- ---- - -- - ---- ----- ------ ------- -
::'3','4~8"'3, 511 3,459
84"
84' 85, '2,903' 2,999 '2,923
~--:-_:~.- '!".. - -. - ' - - . - - ' - . - -.~. - , - - - - - . - - - - - \ - ; - ~ -:' _.:~ - : - ',:-.- -) _._-
:~, ~51 1, 16~ 1, .12~, 86
85
86;. ..... ,.990 ' 988 '. 968
Ind. '. :, 954. 942
898. 90.
88
Ill. .... :1,i,446. 1,469 1,420' 9'0'
92
Mich.' ;. 1, 002... . ~.91: . .9'37: : 86 "
8~
88, '. 854. 82.9'" 7.90 90.. LJOO 1,351 .1,.2-78, 8 6 . . '..85.8 , 823 .80'6
- - - - - - - - - - - - - - - - - - - - Wis.
- - - - - - - - :
~
2-,517
~
2,670
~,597 . 91
.'
91.
,93- .:.-. - 2,,4-89 -2-,430- ,'2,4-15-',-
E.N.C. : 7,069 7,234 :;~:.,_:.~.~::.
6,9.7_7_ .__8'9__ ~ _ ~8..9__ \ __9.0"::'
6
,
2.9 ,.~
16 ~'';:
,_4.
2
1
6,257- - ,_'~.it
Minn.:. :'.1,740 1,847 1,781 Iowa ; :,.1, 949 2,.030 1,942
92
90
93' :93
91
1,595'1. 662" i,"6Zi"
95," .1:,807 '. 1,888; L 845' .
Mo.. :','::'1,76;3: 1,928 1,834 91.,.
91"
92' ,1,608' 1,.754 \1,687
N.Dalc .. :. ':850 1,014 974 S.Dak. ,~: 1; 335.' 1,525 . .1,530
89
87
89 ,;.; 91
90 ,. 756 882" 877, 93 ',: 1,188 1,388 :'1,,423.
Nebr. : 1,749 1,845 1,819 90
91
92
1,573 1,67.9 :1; 673
Kans. : 1,690 1,548 1,526 89
88
90
1,510 1,362 1,373
-"90 - -"92 - W.N.:C. ~li,:676-li,;37-1-1,-406-'--9i - -
-lO,7'037-io;'6-15. iO:.499.-
.
~-
-----
_. - ._ -
-
~-
-
----
~-
----
_' _ _ ~_ -
--
_: __ , -
_'1- __
N c. ,(. ~l~, ~4..s _1~, J~1_ 1!3,_3~3~ __99 _' __ J~ __ J ~" __ I!>, ..3~8 _ 1] ,_0~6~ ~6~:~_5~ ~
Del. Md. Ya, W.Ya:
N.C, S. C,
Ga.
Fla.
S;A.
41
42
41 80
275
302
306
8~
81
81
88
85
33 . 232
34
33
266" 260
699,
'3?2' ~1A'
2.66.:
6'79 t
770 74Q.'; .83
33.1 31.6' 85
579 .585' 77
356' ,. 351 77
841 :' 838 78 .
_
......:...
__ ~
._
83,. 84
82
82
81
~H
80. 7i
83
81
.;578
639
622
273. 271 259
, . . 370
.. .206
469' 474 285, 2:70
,., 534 __'
698 ..
679
. aZ4 1,,052'.1,038: 64 , 6 7.. ,.68' :,532 '705 706
- 7 - - - - - - ~ ~
~
~I~"-' ~ ,- ~;,- ~ - -.~ - - ~ - ' - . ' - '~'.- - -:~ ~ ~ - - - - ,
:_3_,5_8_4 _ _ 4',_27_3_ _4_,2_1_5_ "._76 .._. " 79_ .' _7.ta_ . _'.~,75_7'. _.3,367 3,30. 3__
~
~
~
~,
~
,~
~
~'
Ky.
903
991
966 87
88
91
787
872
879
Tenn.
'918: 1,02'9 1,003": , 86 i . ':.' 8'6
'86 -<.' 794 .. <i.a8S ...... 863"
Ala.
. .84'3 1,047.' ,I, 048 ~ . 77
80 ' 81 "
650 838 849
Miss,' Ark.
1,,095
1,:481
'1 , 473
. 72 . ' :" 76
: 73'"
;j"'796"
1:,'126,""
...l' '
Ol5' \
'
7.54
8'77 . 870 '"~ ,82'" ... 82
80.' '. 614' . '719 \ I 696
La.
. . 9 58 I, 2 10 .J, 1~ 8 . 77 I . .. 7 8 . 77 ' .... 140 . 944 ":., 9 2 2 :
Okla. 1~ 566, 1,669 "'1,577 !88"
.' 84
'JO 1;3'17 ''1','402 ':1,41.9'
- - - - - - - - - - - - - - - - - - - - - Texas : 4, 729 4,499 4, 403 ~
83
-83- - - -88- - - - -3,-907 -3,-7-34 -3-, 8-75 -
S. C.
:11,756 12,803 Il, 538 82
82
84 . 9,664 10, -520, 10, 578
- - - - - - - - - - - - Wes.t
,;:J~~;-,,-;'~-6,~ 8;-~~-2- -~,--9-~5-- -- -8~
-
-- -- -~5-
-
- .--8-~
,-
-
~
~-,~-~~8-'-~6-'~'-8~4:!-'~-6~-"9--5~'--
U.S.
~4,298 47,670 46,520
86
86
87 37,90140,766 40,514
11 Divisions- -North Atlantic; East North Central; West North Central; Total
North Central; South Atlantic, South Central; and West~ 2/ Not strictly a calving rate. Figure represents calves born expressed a~ .percentage of the number of
cows and heifers 2 years old and over on farms and ranches January 1.
GEORGIA CROP REPORTING SERVICE
Agricultural, Extension Service
U. S. Department of Agriculture
University of Georgia and the
Agricultu:ral Marketing Service
State Department of Agriculture,
319 Extension Bldg: ,Athens, Ga.
------------------------------------------------------~-----~------------
GEORGIA CHICK ~ATCHERY REPORT
I
'
Mar'ch 4, 1959
l
,.., '
. Athens, Ga., March 4, -- A. total..of ,6, 626,000 broile'r chides ,were placed
with 'pr'od\,icers in 'Geo~gia during the week ending l'~~br.uary 28, C!-ccor:~ing'to the
Geor:gia Crop Reporting Serv:ice. This compa,res with the 6,419,000 place,'p. th.e
previous week and is 6 percent more than the -6, 244, ,QOO placed the :same week',
last y e a r . '
' ' , ,"
"
, ' :.'
'
Eggs set by Georgia hatc.heries amounted to 10,082,000 compared w~th
9,615,000, the previous week and is, 22 percent more than the 8,2"91,: 000 for the
cor;t:esponding week last year.
'
,
"
\'
,": The majority of the prices paid for hatching eggs were reported within a
ran~e of 50 to 6? cents with an average of 57 cents per dozen, the sam~ as .:last
week., Most prices charged for chicks wer.e reported within. a ran'g~ of .$8.00
to $10.00 with an average of $9.2"5 pe'r hundred" the same as last week. The ave~.age pr'ices.last year wer~ 80 cents' for ,e'ggsand'$14. 00 'for chic~s,
i
Weighted average prices from the Federal-State Market News ,Service for
broilers during the week ending Zebruary 28 are' as follows: Georgia broilers
2 3/4 1-
3 3/4 pounds, at farms 15. 66~;. FqB ,pl~nts 16,: ~2~.""
'.
." " ' . '
::-.. ", . . . . : . .
.
' " .,
,;",.,' ;" ".",
GEORGIA EGGS SET., HATCHINGS. AND CHICK PLACEMENTS
1
I
I
~
BROIL~R TYPE .... ' , .
, EGG TYPE
Wee,k , Endmg
E s Set 1/
I ~~i:k~ ,P~~c~d for.,
,E~gs, Chicks
' gg , _
Brollers m_GeQ::,gm , , Set :' Hatched
I 1957-58
195a~,,5.. 9
, ,
.. %0
, ,1957-
-
" 58
1-9
58
'
'--59'
I.
j,_,%,o
,
.
\9'59~
1959
Yr. ago
'fr. ago
. ThollSa.:l.ds
% ,: :rho~san~~,: ,: :,~ 'j': "Ufo': ,,' ,Thousands ..
Dec. ' 27 Jan. 3
6, ,890, 7,844 7,361 !,6l9,:
114 !5"172 5,,404" ,104" 1-04 '5; 401 5',:862" "109"
1
:;,
,
Jan, '10 Jan. 17
7, 599 7,859
7, 904 8,081
104 5, 519 5,'744 103 5,,524' 5,825
104 "Ids
532 403 659' 494
Jan. 24 8, 199 8,351 ,102, 6,..041' 5,742
95" 672 ',462
Jan. 3.1 8, 278 8, 390
101, 6, .142 5,943"
'97"- 713 453-'
Feb. 7 Feb. 14 ?eb. 21 Feb. 28
8,433 8,411 8,-302 8, 291
8,854 9, 175 9.,615 10, Oa2'
I
105 6,165 6,'233
109 6, 108 6, 270
116 ", 6, 132 6~419
.
.
122 16, 244', ' 6, '626
I
! 101 103
663 571 653" 54;
'I ' i' 105 732
II . 'l~6
746
590:' ."
587
1
I
1/ Includes eggs se~ by hatcheries producing chicks for hatchery supply flocks.
:' ARqHIE LANGLEY'
w. 'A. WAGNER
... - Agricul~ural;Stati~ticianIn Charge,
Agricultural Statistician
,
,
------------------------------------------------------ -----~
-, ~
... .~
~.
.. \
!
.'
..; .
:
H
.\ ... ~
.~ I it, I
,.
Mf~R'5' "59
,,
L100AKIc..::> :,. ,
.. , . ".
.,
-',
'- -
- - - - ,I;: -
,
-
C - - --- -
-'
-- - -- - - . - - -
- - - - - - --------~
-
-
.. ----- - '.- -
-, -,
Week Ending
2
<>
STATE
,'
,
Maine Connecticut
Pennsy~vallia
Indiana Illinois Missouri Delaware Maryland Virginia West Virginia North Carolina South Carolina GEORGIA Florida -, Alabama Mississippi Arkansc.s Louisiana Texas' Washington Oregon California
TOTAL 1958-59 '
Feb.
14
Feb.
21
Feb. "
28
EGGS SET - THOUSANDS
.
1,637 '1,614 . 1, 547
I, 175
1, 226
1, 124
1,362 .: 1, 574 1,968 2,045
1,356 1, 913
373 "
415
341
' 1,834
1,955
2, 046
2, 150 , 2,245 2,074
2,713
2,86'0
2,909 .
2,633 . 2,612 2, 594
370
353
336
3, 850 3,953 4,055
597
609
597
9, 175 9,615 ,10,082
449
3, 897 31 076 4,'465
709 2,996
413 477 1,654
384
' 3,988 3,096 '
4,511 763
2, 911 415 494
1,544
357 4,210 3,253 '4,541
745 2,984
415 - .
437 I, 764
47,973 49, 182 49,680
,Dec,.
27
Jan. 3
Jan.
10
Jan.
17
Jan.,
,24
Jan.
31
Feb.
7
:
C
H
I
C.
K
,
S
PLACED
-
THOUSANDS
1, 185* 601 714
74:3 138* 665 1,692 1,892 1,090 562 -2, 081
331 .5,40:4 -
,I, 211
669 873 -772 149 685 2,046 1, 840 1,014 : 601
2, 578 324
5, 862
1, 180 " 53'1'
784 737 136 765 1, 880 1,838 1,092
557 2,407
323 5,744
I
1, 251 ~J 274 532 ..' 607
570* 753
657
730
182
109 -
732
723
1, 797 1,978
1,688 '-1', 746
. 1,016 1,058
437 _ 53~,
" 2, 207 ' 2, 346
320
290
5, 825 5, 742
1, 2'80 ' 576
709 , 639
174 I
738 2, 11,1
1,741 1, 101
532 2,681
316'
5,943
1,286
648 778 613 120
800 1,837 1,902 1,094
572 2,721
363 6,233
211
298
255
2, 366 2', 871 ,'- 2, 904
I 1,946 1,999 2,051 '3, 122 3,306* 2, 88-1
390* 477>,'r- 440
2" 105 , 2,277 ' 2,223
258 ,269
310
238 ' 236
'300
861 1; 052 , 1, '196
.
~;
28, 55~* 31~409* 30,534
205 2,766 1,944 3,073
L!:30
2,079 284 ::';09
1,226
198
178
2,884 : 2,964
2, :025 ' 2,059
2, 998. , 3, 172
397: , 433
2,227, , 2, 13:6 '
342'
385'
274
205
I, 118' 1, 108
.
236
3,104 2,046 3,044
396 2, 127
339 240 1,074
29, 530'!< 30,356 31,181 31, 573
.Feb.
14
1, 272 668 724. 744 130 84"8
2,06~
1, 776 1, 168
580 2, 870
404 6,270
205 3,263 2, 109 3, 276
412 2,214
382 215 1, 163
32, 756
Feb.
21
I, 229 606 737 877 168 865
1, 769 1,967 I, 129
586 2,903
373 6,419
239 3,202 2,302 3,377
511 2,242
393 234 1, 130
33,258
Feb.
28
1, 154 602 843 816 176 829
I, 927 1,814 1,269
700 3, 021
360 6,626
245 3,228 2,308 3,392
509 2, 178
343 283 1, 164
33,787
TOTAL 1'957-58 42, 392 41,573 40,956
2-5,29J 26,741 27,033 26,816 28, 539 28, 826 29, 209 29,495 30,253 30,270
% of Year Ago
113
118
121
113
117
113
110
106
'108
108
111
110
112
>.'. Revised.
CGIE:(Q)~(GllA ce~(Q)JP ~JEJP>J)~1rllM(G E~VllceJE
AGRICULTURAL EXTFNSION SERVlCI:
U. S. OEPARTMENi OF AGRICULTURE
UNIVER$ITY OF' GEORGIA AN;) THe:
AGRICULTURAL MARKETING SERVICE
STATE llE;PARTMENT OF AGf'HCULTt'RE
319 EXTENSION BI-DG., ATHENS, GA.
Athens, Georgia .
March 6, 1959
",
-,
'.
FARM PRICr; REPORT AS OF FEBRUARY 15, 1959
GEORGIA: The All Commodity I~dex of Prices Received by G~prgia Farmers decl~ed" two points. to 258 l;ercent of its 1910-1914 average during the month
ended February 15, 1959. ~h~ Jndex at 258 is the same as'one year' earlier.
The All Crops Index at' Z1; pe;cent of its 1910-1914 ~verage r~mained un-
changed from the January level. Slightly higher prices for corn, wheat, and sweet potatoes wer.e offs.et by lower prices. for cotton ~d oats. Compared to a year '._ earlier, the Index is up six points.
The A~l Livest9ck and Liv~stock Produc~s Inde~ decli~ed five points to 222 percent of its 1910-1914 avera:e. Lower prices for hogs, all chickens and all
milk wholesale were' primarilJr "!'e spcmsible fbr the decline ~ Higher prices for beef cattle ~d mill<: COl'IS p.art:".ally. offset the decline. 'rhe Index. is down r;ine points when compared with the l"ebr:t~y 1958 Index.
UNITED STATES: The Index of Prices.:Received by Fa:r;mers dropped 4 :tenths of a . percent (1 pOll,t) during the month ended February 15 to 243 per-
cent of its'1910-14 average. \'-ith 'few exceptions, 'livestock and product prices
were lower and crop. prices were higher. Primarily.responsible fo~ the declin~ were lower prices for hogs, milk, tomatoes, and eggs . Most in~ortant offsetting changes were higher'prices 'for-lettuce, new 'crop strawberries, and oranges.
The Index of Prices Paid for Commodities and Services, including Interest,
Taxes, and Farm Wage Rates declined 1 point (one-third of 1 percent) during, the' .
month. Lower prices for farm production items were responsible for this decline.
I
"
.
With both prices received for farm products and prices paid for goods and services bought slightly lower in mid-Februar,y, the Parity Ratio held at 82, the same as in January and nearly 4 percent lower than a year earlier.
Summar,y Table for the United States
- - -ilidex- - - :FebMlary 15;:-January.-l'5,- -: February-l~,-: - - Record-high - -
_121Q-~4_=_lQO_ 1. __125~ __ :__ ~9.29
1. __ ~929__ .!.-_I~a~x_-_:_~!2a~e_-_-
Prices Received
246
2.44
'243
31j Feb. 1951
Parity Index ~/
291
298
297
298 Jan. 1959
Parity Ratio
85
82
82
123 Oct. 1946
lrp;i~e-; Paid~ Int~e~t~ Ta~e-;;-,- a~d-W;g~ Rate-; ba-;ed ;n-d~t~ fo; th; indi~ated-
- dates.
,ARCHIF. LANGLEY Agricultural Statistician In Charge
RAY110ND R. HANCOCK Agricultural Statistician
..
,"
UNIVERSITY OF GIiORCIA
MAR If) 15
lIf:lll'"~ltl!:.S
COMMODITY ANDtNIT
Wheat, Bu.
Corn, Bu.
Oats, Bu.
PRICES RECEIVED BY FAlM.:RS FEBRUARY 15, 1959 WITH COMPARISONS
.
_.-
,
--
--
-~
-
p
~
, -----------,P-. ,
._. __ _
.. _ - - - -
r-----G-EO-RG-.I-A,------.---
-(-
I,
LN I'IED STAlE S
---t -.--.------.-----,-------.
i Average :Fe.b. 15 Jan. 15; Feh. 15 : Average
: 1910-14 . 1958 '1959 : 1959 ; 1909_14 I _ _
Feb. 15. Jan.15 , Feb. 15 1958 ' 1959 , 1959
.
.. _ _
_._
M_
-:- _
.
$ 1.23 $' .91 $ . .67
2 00 i. 1.38 i
1.95 1.24
.88 : .91
1.97 I:,i
.88
1.28 11 .64 I I:
.89 'i, .40
1.92 .95 .61
1.71 1.02
.59
1.74 1,04
,60
Irish Pot., Cwt. Sweet Pot., Cyrt.
$ 1.13 $' .84
5.25 5.25
1.14
ji
5.50
1.60
2.23 5.45
1.21 4.47
1.10 4.36
Cotton, Lb. Cottonseed, Ton Soybeans, Bu. Peanuts, Lb.
12.1 $ 23.65
$ 5.2
31.0 34.3 49.00 50.00
2.15 -2.10
!
10.4 10.3
34.0 51.00
2.10
,; 12.4
'f
22.55
'I
i!
4.8
24.9 49.90
2.05 9.6
28.2
28 .3
43.30 43.80
'!,
2.02
2.05
10.6
11.0
Hay,All,(baled)Ton Hogs, per Cwt. Beef Cattle, Cwt. Milk Cows, Head Chickens, All,' Lb.
$ '!
$ 7 .36 $ 3.96 $ 33.85 ' 13.3
29.20 27 .80
1.'- .
. 18.80, 17 .20
lY .20 '19.80
140.00 160.00
:
19.4 17.4
27 .80 15.70 20.40 165.00 16.4
18.70 19.3Q 19.30
7.27 19.70
5.42 , 20.60
48.00 193.00
11.4
19.4
15.40 ; 22.90 1227.00
i
16.7,
I 15 .40
I'
! 22.80
I,
1232'.00
16.6
Eggs, Doz.
21.4
i
48..0 I 46.5
47.2
21.5
36.6
36.4
35.4
Butterfat, Lb.
, 25.8
50.0, ) 51.0
51.0 '. 26.3
59.4
58.6
.:
58 .3
Milk (Whsle. )All
$' 2.43 Y 6.15' Y6.05 ;y 6.00
V 1.60
4.32
;Y4.34
gj 4.24
(Pe:x> 100 Lb.)
.
,
;'
~~uid lAkt.
$
M<lJlu.:( . ,. . ._ _ :;;: .
J _ . 6.25' 6~10
4.88
..,__ ~_'!.~O_._..3!79 ....; - . __. ...:._ .. __ .. __ .. ..: __ 3.L~ _
4.87 ;3. 26.
Y 'y Revised..
Preliminary Estimate'.
.. - -.. . . -. .. ... ___ __ ._.__ . . ..'_ _ ,'0'.-,, __ - - - - '- -'-"
JNIJEX NUMBERS OF PRICES RECEIVED BY F.ARMli:RS m GEORGIA
(January 1,910 _. December 1914 = 100)
., ~l~:~~ities'
. ,~ .. ~ - .. -. ,. -
Feb. 15 1958
-. -; ~~~
. Jan.15 .1959
260
Feb .15
1..9-5"' .9.
258
Grains and Hay "
i 160
275
275
152
153
Cotton Lint
.
I 255
282
280
Peanuts
I 200
198
198
Tob a o c o :
.
I 449
443
443
Cottonseed and Soybeans'
, 204
2C8
212
Irish Potatoes,Sweet.Potatoes and Cov~eas: 269
268
279
I' Fruits and Nuts
193
163
163
All Livestock and Livestock Products
, 231
227
222
Meat Animals
315
322
311
Poultry and Eggs
160
147
144
Dairy Products
2~0
239
238
----...- ._--'._'- ._._._.__..._.....
Y PRICES PAID BY FARMERS FOR SEliECTED FEEDS FEBRUARY 15, 1959, WTIP.: COi.1PARISONS
GEORGIA
:
LNITED STJ.TES
-;-r -- KmD OF FEED ----':--"'-,--_.,.
I Feb .15, TJan.i57-:-1'eb :i5-:~; Feb :15, ._; "J;;;-.15
--d._ __ . ._:_...__._._,. __ ._ ,_. _ ..._.._ l.,;I.9.SI?- _\__.1_959. :_;J.~5~ __~, __ 19~.. __._: .)9?9
i
'Feb :i5-;19?.,Q.....".
Mixed Dairy Feed
i
i
D~l~~r:.~.!e:._ ~C}.?_ ~o~~s.
l
All Under 29% Protein 165~ Protein 185'~ Pro te in 20}~ Protein 2,;'% Protein
Hiih Protein Feeds
CO ton seed Mea:L
Soybean Meal Meat Scrap
Grain By_PrOducts Bran Middlings Corn Meal
Poultry Feed Broiler Growing Mash Laying Mash Scratch Grains
Hay fBaled) ilfa fa All Other
l! As reported by feed dealers.
3.90 3.80
4.10 4.00 <.,.30
I
I ",,00 3.90
I 4.30 ...,. ,15
I 4.60 I
33..5850 " 34..0950
3.20 3.45 3.40
I
' 3.30 \ 3.55 I 3.35
5.00 4.70
I 4.20
I
i50.00 j40.00
,i!
5.10
I 4.80 4.20
46.00
1, 36.00
3.95
3.60
3.85
3.56
4.30
3.51
.10 . 3.79
4.50 " 3.90
j /,
4.10 I; 3.78
.05 Ii 3.72
,.I:
I
I
3.40 3.55 3.30
2.71 2.76 3.17
I,
I 5.00
4.75 :i
4.15 "
4.80
4.29 3.8Q
"l'1Ill
..
I
46.00 ; 31.00 35.00 29.50
3.81 3.75 3.73 4.04 4.17
4.31 4.L',7
3.81 3.75
3.72
4.04 .14
4.36 4.39
3.17 3.21 3.18
' 4.98 f.53
I, 3.90
I
3.10 3.15 3.15
4.94 4.52 3.89
30.30
30.30
28.60
28.20
J1_. ..._--1 ..--_. -
3/,6
,
'..
GEC.RGIA CROP. 'REP"ORxf'NG' 3liRV"lCE;
:i, -<~,
.
,t,gt!ict:4tu~'al ixtens ioli Service ' '.
. : "U:. ,'5. bep.{~tm~nt~ of Agri~u;1tur~
University of Georgt,a and 'the '.. : .
: ' . Agricultural Mark;:eting Ser~ice
State Department :of Agriculture
319 Extension Bldg. , Athens~ Ga: .
. >:. :-- G_E-O-R--G-I-A--G-r--H--C-K~-H-A-T--C-~-E--R-;--~--E-P~C-R_T:'_--'-_':',.---~--0 --.-:." -" --"--- _._L-v-1-a-rc-h~-'1-1-,'~, ;-1-9-5~9-
,
Athe~s, Ga., Nlarch' 11 - - P. total of 6, 888, 000 broiler chicks were piaceh
with: producers in Georgia duril)g tl;1e week ending 'March'7,: according to the' Georgia Crop Reporting Ser.v,i:c~.' This 'compiiies witn the 6,626, 000 piaceq.,the
previous week i=l-nd is 9 percent. mC?~e tl'tan ~he (1,,3D7, 000 placej th~ same weiek
last year. .
, .".
i
..
;.
, '"
':, .
' .'
I
Eggs set by Georgia l),a.t~qeri~s,~raouritedtG'~l.O, 143; 000 compa're~ wit~
10,0'82,:'000. the previous week 'and i.s 2?:. per.cent mo!e than the 8, 003, 000 for'
the corresponding 'Week last-year.
, ...
.,
, .'
;,
The majority of the prices paid for h<t~(:hing eggs wera r'eportad within: a \
range of 45 to 60 cents with an average of 5'5; cents compare'd with a range of
50 to 65 cents and an average of 57 cents per dozen last week. Most pr~ces .
charged for chicks were report3d within a range of ..li8. 00 to $9.25 with ~n '
average of $8. 75 per hundred compared wJth a.r:ange. of :;;8. OO,to '~10.'OO'with an '.
average of $9. 25 per hundr.ed last week: :the .~y.erag~'prices last year were;
j
".
80 cents for eggs and $14. QO' for chicks: . .
.. ,
,J
Weighted average price s from the ,iTedera1-State Market New~ .'Service for
broilers during the week ending Mar!=h.7 a~e as Jollows ,Georgia b~oile~s ~':
Z 3/4 - 3 3/4 pounds, at farm~' 15: 54'f;"FOB plants 16: 52f.
.
./ .
.'.
, : .: , , ; ,; . ,(:,1
:
~
GEORGIA EGGS SET. r-tATCHINGS, AND CHICK PLACEMENTS
I'
t
~ ~.' ,
BROILER TY~E ,'. -' ':'"
EGG TXPE,
!': '.
Week' Ending
Eggs Set 1/
tn Chi'c'ks"Pla'ced for
'Broiler's Georgia
IEggS :Chi'C,~s Set H~tche.d ',..
I"
1958
10f 1959
j1959 0/0
l~ 5'8 .,
1.95~,;:'. . '_;t~59
1959 .n/" 0", I, of 1958-: '.19:59
19.~9:,.,':,',.
-.
p.
...
...
:
-
thousands
percent
tho\J,satids '.. percent I' t~ousa.nds'i ,'; '-':
I Jan. 13 7,361 ,7,619
104
5,.401 . ..?,J~6?,. 109
I
..'
' ~ J
!
,
;
:
Jan. io ,,' 7,,599'. ,7,904 ,. 104
Jan. P .-- 7; 859 8,081
103
. ~: :~~~ ~:~i;
104" 105
.,532 : 403'''' ,,' 659 ;494.. '
Jan. 24 8, 199 8, 351
102 6, 041" 5, 742
95
6i2: 462
\, ,.....
Jan. 31 8,278 8,390
Feb. 7. ..-,c' 8,.43) . .... 8,854
Feb. 1,4 8,411 9, 175
Feb. 21 8,302 9,615
,lebo l~ 8.291 10,082
Mar. '7 :. 8, .003 1~, 143'
i
1_
101 105
6,
6,
142 1'65 ..
~,
0';
.2934'33
..
.. 97", 10 1
109 6,'108 6,270
103
7_l:3 _.;4.53-r.~
66:3: 57 1 : 6513 t 545 !
:
116 122 127
6, '132 6,419 . 105
6 244
I
.
.6~ ~'()7.
.... 6-. 626 .
~ .. .
.. 6~ 8'88
,
.106 . 109
'
732 '746'.
'558910~:,
'807'~;i 53~:";
'"
"
,
I'
,
.,
!.! Includes eggs set 'by hatcheries produCing chicks for hatchery supply flocks:.
.
i
~
.
. ARCHIE LANGLEY
Agricul tUl"a1 Statistic,ian In Charge
.....,
... - -' - -- . ~: - .' ,- ... """
..;..
W. A.~ WAGN~R :
.' ".'
AgriCult~~al ?t,i\ti't>rCl~~
_ _ ,~._.,,;.&I'''''
''''~4~~'.' __ '';'''''''--: ..'' .. _''''''''_
. ..oJ _,..
.., .
.-
.\"110'"
.....
... ~ ,
. ... ..
,
.. " ",
,
. -or-
-..........~
..
. . ,_.,,-- ,..... ,.' ....................., ... -
MAR; 7 '59
..'
:~
.. ,at ~ (
i
:', :{: '-
. . ........ '
, '.
.'
"
STi~TE
Maine Conne ctic ut Pennsylvania Indiana Illinois Missouri Delaware Mar ylanG. Virginia West Virginia North Carolina .3outh Carolina GEORGIA Plorida Alabama Mississippi Arkansas
.Loui~ia"1.a
Texas Washington Oregon Cali.lornia
TOTAL 1959
T~TP_L 1958
1959 "10 of 1958
*Revised.
EGGS SET AND CHICKS ~LACED IN COMMERCIAL AREAS, BY WEEKS - 1959
Page 2
Week Ending
~eb.
~~eb.
Mar.
Jan.
Jan.
Jan. , Jan.
Jan.
~-eb.
Feb.
Feb.
Feb.
21
28
-7 ,
3
..
"
..
EGGS SET - TH(lUSANDS
"
.
10
:17
: 24
"
31
,
7
14
21,
.,., 28 .-
' ..
,-
,..
"
'"
..
" , '-CHICKS, PLACED - TH.O.... USANDS
-
"
1,614 1,226
1,547 ',' 1,121'''
I, ~53 ..- 1, 216
1'; 211 " ., 669
1, 18q 531
1., '25:1
'53~
1,274 ',607
1,280 ' 1, 2-86 576 " '648-
,..
1,27,2 668
1,229 " 1, 154
606
601
1,574
1,356 ',: 1,,308
873
784
570* "753
709 '.. 778',
724
737
843
2,045 415
1,955
1, 913 341:.-
2,046,
2,268 " 331 2., 126
772
- 149
685
737 136 765
657, ,182 , 73'2
'730 109
"
,,' 639, 174
.. ,6,13"
,. 120
' 72~,
738 ,800
744 130 848
877
' 816
168, 0" 176
865
829
2,245
2,074
2, 158
.. 2,046 1,8,80 . 1,797 : L 978' 2, III " 1, 837 2,06'3 1,769, 1,927
2, 860
2,909
2,; 852
1, 840 1,838 1, '~88 1,746 1,741 '1,902' 1,776 .. 1,967, 1,814
2,612 353
3,953
2, 594 336
4,055
2,728 '377
4.029.
: 1,011 1,092 1, ,0 1,6 f,"058 ' i, 101 1, 094 - 1, 1~8 1, 1,,29
':
601 '
557
; 437
537
532 .. ,512
580 ' 58,6
. " 2; 578 '2,4f)7 . Z, :207' 2, 34~, ~, 2, 681 : . 2,'721 2,87,0 :. 2,9,03:
~, 269' 700
3,021
609 9,615
384 3,988
597 10,082
357 4,210
.614
10..; '143 ,' .. 366 ,
"
4,-398,
324
323
5, 862 5,744
" 2'98 " 2;5
",
2, 871 " ,2,904
1320 '
, 5,:825' 205
i,766,
',' 290
316 , 36~ "
"
,5,74Z 5, 943,,~ , 6" 233 "
: ' 19~, , 178
' 236--:
2,' 884 ,,2,964 3,104
404 '., 6,210,,:
205 ' 3, 26'3
313' 6,4.19
239 3,202
, , ',360
"
6,626
246 ' 3,228
3,Q96 4,511 763
3,253 4, 541
745'
3', .141
4; ,583
:783 '
r, 999 2~ 051 1,944
3,306* 2,881 3,073 471* 440,' 430
~,-'025 ,,2,059 : 2,,046
2"',998, 3, 172 ' 3, 0.~4
"
397
..
433
'3,96
2, 109 2, 3,02
3,276, 3,371
412,
511
2,308 1, 392
50,9
2,911 '415
2,984'-' 415,"
3,'052', :",
>'
'480
2,277 ,2,223' Z,079: 2,'227
269
3-10, .. 284
342.
~, qI> 2,'127' 2,21.4 ' 2,l42
3~,5 '
339 . 382,:
393
2, 178 ' 343
494
437 '
;370
236
300
309, '274
20.5 '. : 240
215" 234 " 283
1,544
1,764
L:818 " " ,
,~ 1,052 1, 196
.... -.
1,226 , 1, 118 1, 108
-
i; 0'74' , 1,163 1, 13Q
: ,.
1, 1~,4
49, 182 49,680 5Q,694
:
31,409* 30, 534 2?, 530* 30,356 ' 31, 18L 31-, 573' "32,756 : 33,~58 33,787
.. :
41,573 118
40,956' 40, :969
,,
121 ; 124
"
,
.
2,6,,741
,27,Q33
"26,816,
!
28', 539 ,28,826,
" ..
"
29,209 :,
;29,49'5.'
..
30, 25~
30,210
I
117
-
"
113
110,
106..,
10~8 "
i08
11.1'
110
,
112
\
,Mar. ' 7
.
1, 194 501 835 765
. 19~ 849 1, 9'64 ' 1,941 1,295 68'0 : 2,,959,
357 ", 6,888 ,
263 3,278 2,469 3,580 ' : 450 , 2,471
345,' 267 1, 176
34,722
'30,406
114
" ..! .
.3
MAR 17'59
'~JE((J)~(GllA C~(())IP ~[n(Q)~1rllWG [~vnceIE
AGR IC ULTURA L EXTE NS tON ,SERV IC~
, U. S. OE'PARTME'-NT'OF "GRICUt':TURE
UNIVERSITY OF GEORGIA" ANO THE.. STATE OEPARTMENT OF 'AGRICULTURE
AGRICULTURAl.. MARKETING SERVICE i '" .3.19 EXTENSION BLDG., A'rHENS, GA.
,- " '.A.thcil-l's, ':Georgia, " :
" " ,"
March 1'2, 1959
, 'VZGETABI.E'S'''FOR -~REsi(h~CET' ''',''
1 . .J";. .',
,
MARCH 1, 1959
UNI~D, S~ATES: production of winter vego~ables fPT the 195~ season 'is'now ~s~~ated,to' b~ 3
~.
, , ' 'percent' larger th.m in ,1950 but 7, ,percent' below average', the Crop' Itcpo!'t~ng
Board announoed'today.' The current forecast i~ 4 percent'under a ITtonth a!o., 'Redu~ed pros;Jects
in Flo~ida ac'C~unt fOI: most of ,the decl,ine. Co,ns,:i.derab~y'laE1tr.,rPJ;'.ocl-.c.tion of' tOlhatbe's,' snap
,,1?!il,im~, gr,e.en, pepper,s-and. sw~t oorn' 'is" e?cpc'o't-ed' thiS' year l;hi\n. last ", T1lese, were ,practically a
f!.~lure,last ye~r ~n F3,Q,;r,.ida." "Mater.ially. ,le'sll' than last ye~l'" s'production is indic'ated' for- car_
. ro'\;s; 'l'et''tuoe, cabbage, and caUliflower., ,Of tho,early spring crops for which'forecasts ,have
been mp.de, orily onions are expeoted to be'less ,th!l.n last ~rear. Early, spring, tomatQ acreage is
cor-sidor-ably less than in 19':i8. Cirow'3r~~:'repo:r1;e,d intent:i,ons point, to a 12 pero~nt inorease in
the ~ summer onion acreago and a 12 peroent:,rcdllction :i,n, early summer w~tennelons. '
(.
'. I
~:.
.
'
"
~
I
'"."
~ .~
, .. " Eve~ though Februa:r:y weather,was generally'favorable ip:Florida~' some crops did not over-
-a come tlle,effec'ts of the January f-r9.,l?t,'p-S .:t'i~ll .. .a.s'.sx.p.ec:to4,-a mon,th ago. ,Lower y1'elds are,now in
.. 'pro speot 'l!iIld" $'c:llt1'o 'a<ldi"tio,ii.a'1. oreage - has ',been aoandoned. 'Untoaaona'Q:(y, ;:rarm, '"rea.ther ha8' rorced ,ro.pj..d gr,o'vrth, and, ~rored 'qual itY" o'f mo S't 'w'in'tcY crop's'. HtUnici' 'vroather, morn lng fog, and heaV".f
dews made it difficult to control insects and disease. Spring orops which will .'b~ginharvest
about April 1 are in much better oondition. Plan'j;ing is ~,otiv:e in l-joI:tb FlCU'ida and' prae>ti_ oally oompleted' in the ~entral and South areas.' In other SouthecsteI:n ,Staxc$"heav.y February
rains ~ve hindered planting of vmtonnelp~s and other early spring crops.', . '
'
CABBA~; The',prel~inarY" est~t'e' of ,ca~~~1 sp~~~' ~-oreaa~:''1~: 'plac~~:'~t 16~90~ 'ao;.es,~ This
',,.,is s;I: ightly b610w the acreage har-vE::steaJ.ast year and 14 peroent' ll'lss ,than' aver'a:;e.
Aoreage -declines, in Mississippi 'ahd Geor~ia. more than offset inoreases iJ). Louisiana, California
,and .Sq'J.1;p ..Car.Qlina.. ,.Th~, So~th, Carolina" crop"is i'epprteii -to' have"baEm 's'oriously burt 'by' cold
,vrea.ther i.t;l mid_F<.:brua:r:y." In Ge0l.:g,~,a,--~)Cc~s,si ve., mo,isture, has" 'retarded develO1>rtlc:mt. :,"Harvc st fs
expected to 'be' about 10 'days la'te. Cold, wet weather in ~f.ississippi has delayed transplanting.
Growers normally fininhed setting plants to the field about March 1 but ,were only ,about half,
through by~th~t d~te this year. Planting'will cont~u~ tnto March, if weather is favorable.
The Louisiana" crop ,is genC'I'a'lly in--1>oor concfit'iciri." Cold wet weather during mo st of ,.F:'ebr).lary
prevented cultivation and retarded orop progress. Harvest is e~pected to start ill ~he' ~portant
Breaux,Bridge~area in late Baroh or early,April. "The California crop'is'iri good conqition.,
ONIONS: ,', The first, foreoast of the early sprin~ ,onion crop in ,Texas plac,e.s production' at, , ,~
, 1,788,000 cvrt., 30 percentl::ess~tl:iiti'"Ta.st,yearand 21'pcrcent belo;'/' avera,.ge ...Based on indication~,as of 1~roh 1, prospective ,yield est~ted at 55 ovrt. per ,ac~e, compares with the high yield of Q5.owt. last year. The Texas crop ~~s boen pla~ued with exc~ssive 'rain ~nd cold weather since planting. Blight is prevalent in 'all areas but more pronowlced'in tne COastal Bend and Lower yalley. Efforts to combat ,blieht hav~ not been very effeo:tive' l:iecaus,e of rain and misty weather but growers are oontinuing ~rith their oontrol efforts in ~be hopes of, getting some production fr'om as many fields as possible. Blight is more severe 1.."1 the' older. onions and the mor~ advano.e~ fields are not e~eoted to show any ~~~~y~e~t. Grass bas' taken a few fields an!i this, .acreage has, been -aba.ndoned. ,. Top 'growth in bo t'h th~ intennedj,ate and. late crops' has
been retarded in all areas and in general stands are 'not good. A few fields in, tI,e' Lower
Valley ,'rere pulled in"lat~ 'February but conditions vrere unfavorable for ,curing. To!,\n,age ,from' mature fields "rill be light and production from later plantin~s is depend,ent, upon development during Maroh.
\':ATERMELONS: In Florida, wann weather has favored rapid growth of the spring crop. Most fields in the TImnokalee_Fort Myers area are vining and a f~7 have set melons. In cen_
tral Florida, earliest plantings are developing runners. Gummy stern blight is beginnin~ to show up in some fields. Planting is nearing completion in north Florida and is in progress in west Florida.
"
,B~s~d,on g,rowers', reports, they intend to plant 285,200 acres of watennelons for early surrmer harvest. This expected acreage is 12 percent belo;'r last year's large aoreage but only
2 pErcent smaller than average. A small increase is in prospect in California, but all other
States expect smaller aoreages than in 1958. Georgia, Texas and South Carolina account for most of the decrease. Lo;'r prioes for the 1958 crop 'Tere partially responsible for growers planning to reduoe their acreage this year. 1"eather conditions in the Southeast haye not been too favorable for planting and only a small acrea~e has been put in to date. Considerable acreage in the Falfurrias area of Texas was planted around mid-January but most stands were poor as a result of cold weather. Replanting continued into late February. In other areas of south Texas (Pearsall, Pleasanton, Stookdale and the Winter Garden) very little acreage had been planted before late February, and seeding will continue active in early 14arch. Planting will start in central Texas in mid.....l.,:arch and later in the month in east Texas. Seeding continues a.ctive in Arizona. Early fields there have made good progress. In California, preparation of land for the summer crop is now underway.
TOMATO~S: Lcreage for earl sprin~ harvest is'e~peot0d to total 47,500 acres, 12 percent less than ,the ~cro~ge harves ed'lact year und:13 percent below avernge. Florida with
26 peroent fcver acres than last ye~r accounts for most of the deoline. The spring crpp in
o()ntral and south Florida has generally good, pre spect s. In the OxfoTd-Dellevic-vr_L07rell area,
tho crop j.s trowing ra.pidly. Thinning and tpnsplanting are'eotting underv::J.y. In Texas' Lo,'er Valley, cool damp weather has~.retarded plant growth. A cold spell in early Janua:r:y caused some loss of plants but stands are generally good. Early fields are startina to blocm
and little production is expeoted before mid-April. Harvest oontinues active in the Dnperial Valley of California. Supplies from this ~rea will remain at about present levels through March. Harvest will extend well into June.
(OVER)
l:.CREAG: .AND EST:n,!A'E~ PRODUCTIOH lEPORTJ:D TO DATE, 1959 T:ITH CQ?,:PARISONS
CROP
AND STATE
;
tila. :
lI.CIBAG: FOR HA.EV::: ST
:Xverage : 1958 ;
:1949_57 :
: 1959
;
:
YJELD ~R .itCR:: :
PRODrCTION
: Av. : 1958 : Ind. : Average: 1958 ; rna.
;49_57 ;
: 1959 :1949-57:
:1959
_ Aores _
CABBAGE: 1/
Yrinter: -
Florida : 16,540
Texas : 19,610
. . . Arizona : 1,080
California
: 3,610
15.500 16,500
900
4,400
Group Total 0 : 40,040
Early Spring;
I
South Carolina : 2,090
37,300 2,400
Georgia. 0 0: Alabama 0 ;
i.iississippi 0 0: Louisiana ;
California 0 ~ ;
5.340 1,080 4,360
3,960 2,910
4,200
900 2,900
3,000
3,600
Group Total : 19,730 17,000
- Cwt. -
18,000 198
130
170
16,000 113
150
90
700 226
245
240
4,700 213
315
240
39,400 160
163
147
2,500 139
4,100 112
900 107
2,200 105
3,400
91
3,800 217
16,900 125
85 '
100 105
85 100 225
122,
_ 1,000 O'\'rt. -
3,288 2,217
243 769
6,517
2,015 2,475
220 1,386
6,096
3,060 1,440
168 1;128
5,796
288
599 116 447 366 635
2,451
2C4
420 94 246
300 810
2,074
Apr.l0
LETTUCE;
Early Spring;
North Carolina 0 ; 1,620 1,000
800
74
80
South Carolina. ; 1,130
600
600
60
45
y . . : Georgia .:
New Uexioo
570 , 200 520 2,100
280
84
90
1,900 155
170
Arizona,S.R.V. : 14,210 28,500
30,000 148
160
C~lifor~ia : 29,?10 15,200
18,500 119
130
:
Group Total : 47,160 47,'600
52,080 124
147
TTATERMELOlJS;
75
119
80
60
60
68
27
36
95
49
18
27
180
86 357 342
150
2,096 4,560 4,500
130
3,469 1,976 2,405
142
5,818 7,018 7,370
V Late Spring:
; 88,230 102,700
92,600
84
101
7,441 10,386 1,fay 11
Early Sumner: 3/
North Carolina. : 11,160 15,000
13 ,500
50
60
South Carol L"la ; 41,890 42,000
35,000
54
60
Georgia : 54,000 63,000
50,000
78
85
Alabama ; 17,460 21,000
19,500
91
95
Mississippi ; 11,040 16,000
13 ,600
70
65
Arkansas ; 10,320 13,000
10,90C
85
85
Louisiana : 4,430 4,200
4,000
77
80
Oklahoma ; 14,520 11,500
9,500
54
65
Texas .: 109 ,220 119,000 110,000
47
50
Arizona 0 ; 5,170 7,400
7,200 146
95
California ; 10,480 11,500
12,000 140
150
Group Total :289,690 323,600 285,200
65
69
555 2,264
4,190 1,577
773 874 342 946 5,096 757 1,464
900 2,520 5,355 1,995 1,040
1,105 336
748 5,95,0
703 1,725
18,836 22,377
.Tun.10
Y. ;rnoludc s pro ce s s ing
~ Short_time average. ~ 1959 prospective acreage.
ARCHn: LANGLEY Agricultural Statistician In Charge
L. H. HARRIS, JR. Vegetable Crop Estimator
.
---.----...
3/5
G :s 0 R G I A C R O' P:: REP 0 R TIN G S E R V ICE
Agricultural Extension Service
U. S. Department of Agriculture
JJniversity of Georgia and the.',
Agricult~ral Marketing' Se17vi~e .
!;ta~e
-----
Departmeht
----,-----~--
-o-. f-A--g-. -r-ic--u-. l-t-u-r-e-. -' --.
-
-
-
:
-
-
-
-
-
319
-_.
Extension 51dg.
---------_._--
,
-
Athens, Ga
---- ---. ----
.
-
-
GEORGIA CHICK HATCHERY REPORT'
March 1'8, i 9 59
. Athens,' Ca':; March 18 -~ A total of 7,094,000 broiler chicks were placed
with pro.::1ucelZ:~ in Ge~rgia duri~g the week ending .Marrh 14, .according to the
Georgia. Crop R;eporting Servi.c~. 'This c<;>mpares with the 6,.888, 000 p~ac~~ t~e
previous 'week' and is -,18' percent more than. the 6,' 015, 000 placed tl}e same week
last year. : I
,
'
.
,
E'ggs s:et py Georgia hatcheries amo~nted to 10, 030, 000 compar~.::l with:
10, 143,.000 the IprevlCiuS: we'Eik :and 'is 18 percent more than th~ 8,474, 0'00 for the
co~respond.~ng,we~~..1~st' yea.r.' . '..
..,
'.
T,he maj<;>rity of the prices paid for hatching eggs were reported within a
range of 40 to 6'0 cents with an average of. 51 cents compared with, ~ range of i
45 to 60 cent.s and'a~ aVi;:rag.e pf ,55 cents 'per dozen last weel<. Most prices !
charged for. chicks were reporte.d within a range of .1t'7~ 00 to$9 ..00:with an ;
sci. average of $8. 26 pet- ~Uhd.re;d.compa:red.'with a range 6f $8;00 t9
25'with ail
average of $6. 75 per hundred last week. The average prices last year
;
were 81 cents for eggs and $14.25 for chicks.
, ,
.
,
",
....
,
~..
.
:
~ .J, . . .
,:
_. " .'
,
Weighted average prices from the Federal-State Market News Service fbr
broilers during ,the week ending.M.~rc~ 14 are as follows: Georgia broilers
2 ~/4. - .3 -3/4 pounds,! .~~ f~~.r:ns 16,' 51; ZOB pla~ts i 7. 49f ...'
.
I
"
'.
'.
:
GEORGIA EGGS SET, HA'TCIDNGS, AND CHICI< 'PLACEMEl\fTS .. ,
,
BRqIJ;..ER. TYf'~ . .,
. , ; ":EGCr TYPE:
Week End1 ng
' " . Eg'g~ f5et 11 .", :~.' :.:, ..... . . .C~~.ck~. ~laced .f~~:.~ ; E.,ggs. Chick~
. ''", : '... , , .-.' . " ' " .
B.r.O"Ilers 1n G.e.org1a : Set . Hatched
. 195'8
.
. ..
,t
'i959 I 1959 '/0 1958
1959 1 1959 %: 1959' 195;
'019-58 .
. . . / . of 1958'
,
,
~
I
.
: Thou.' .T~o~.
\
",
P'.., e~c.en. ~ .Th. ~J ..:" )'.r.ho,.u~:. .;:P.eTc'~nt, Thou. . Thou:
Jan. 10 .
Jan. 17:', Jan. 24 Jan. 31 : Feb. 7 Feb. 14 ,
Feb.21 ~~eb. 28' , Mar. 7 :
Mar.14
,
7,599
7,,859 8,199 8~ '278
I
7,904
104 5,519 5,744
104:
8,081.' .103: . ".?' 52~ .',:5/825, ..' 105 ~
,.8,351" .t02 ~ .b.... 041, 5., 7.42 ._ 95
8.,. 3'90 .. 10} .', '6; 142 . "5~ 943
97 I
8',433 8, 854 8.4~L 9,175 8:,302. :9,.615
105 6, 165 6,233 109 ..6,'108 6;270,
,1-16 ...6,.:u~....6;419.
101: 103 105
8,'291.:' lO,:08Z' ,l2Z: .6;'244:.' 6.,.626.. 109
I 8~ '003 10', 143
8; 4~4 10,030
.' i2.7 ' 6,'307' '6; 888'' 118 6, O~,~ 7.094
109 118
532.
659 672,. :713 '663 653'-) .. 732. '''746 807
864.
I
403' ~94:
~62
453:
571. 545' 590~
'~87
530.
670:
-1/ ,Includes egg1s :set by1'l~tcher.ies prod~cing chicks for hatchery~supp-lyflocks.
:.: :
'~'.,
., .
"
. : ARCHIE LANGLEY
Agri.cu1tural Statistician In Charge':
~
~~_~
~~_J~_~
,
. . . . ~.
: ';'. .
__ : ' _ Wi. A. WAGNER
Agricultural Stati.stician
~~~,~~._~~~._~
~
~
'. .. ..
".'
w
,.: ..,' '''
..,' ,'
I
\
...
"
"- '~J ~~:: :>., :'... ~ ;, .'. '..-.',:'
~: '-'I
.. ' ~
.. ;:'
.
.1 , .; ',_
;r . "
'.
'.J
, ,,-, , ,J
"
,. I. '-UNIVERSITY OF GEORGiA
MAR 1-9 '59 . ,I
..' ~
./
,,',
.;...
, ...'.U.S. RARIE, S. I .: I
~ .-
~; ,~. ". ,.
- - - -- -- - -- - - - . -
- - - -
-
--
. - -- ~ -- - - - --------- - - - - - -------
-.
.'
- ..
--
'0
:
,
,-
ST /: TE, ..
'Maine'
Connectic'ut
..
Pennsylvania
Indian'a
Illinois
Missouri:
Delaw'are"
Marylana
Virginia ..
West Yirginia
North' Carolina'
South 'Carolina :
CiE:.o.RGIA ... ,
.7eb. 28
Mar, ; Mar.
" .7
. 14 ..
.
"
EGGS SET;. THOUSANDS
.
1, 547
1; 553
1,601
1, 124 " 1,216
1, 169 "
1,356
I, 308 . 1, 360
1, 913
2, '2~8
Z,084 .
341
. 331 : , .' : 3.94 ..
2,046 , 2,074
2,'126 .. .2,223 ..
2,1'58
2,2.05 :
2,909 .' 2~ 852_ .2,lnO
. 2,594" 336
2, 72a" '~ .2, 544 . .:
.377,
. 354 :
4,3Z9* 597:'
4::328;;' , 4,266
'614"
620 . ,~,
10, 082: 10, 14~ 10,030 " ..
F1ori,la
Alabama Mis,sissippi .
'A ~ .<a.Il,sas
Louisiana
Texas WashingtV.l .
..
-
.
,
..
..
..,
357.',
4,2,10 3,253' 4,5!U
745 2,984
415.
366
457
4,.398
4:, 504 .
3,: 141 .' 3, 148 .
4, 583
4:, 643 "
783
823
"
3,052 . 3;072
.480
426 .'
Oregon California
4371,764.
370
,.437
1,8'18 ' r; 781
. :We ek Ending
,
.. .
Jan..: . :Jan. ' Jan.
Jan.
Feb. '. .?e.b,
Feb.
.10
, 17
;
'.
, . 24 . .
31
7
14 . .
21
,
.
CHICKS' PLA C~'D -,THOUSANDS
:
1; 180 , .1,251 1, 274 1,280
: 53'1 : 532 .. 594>1<'
576
1,286' .. 1, '1.7.2
648
668;
: 784 : ,5-70*
753
,709
778.. 724 :
137 ; ',657 '. '130., .. :_ 639 , '. '613:
744 :
141* , . ' 7{,:5
189* 732
114* 723
181';' 738
120; ::. 130 .
800,
848
1, 229 606 737 877 168 865
1; 880 ;I,797 . 1,'978 ' :2; III 1,837' 2,063
L 83.8 ,1,688 1,;746 ,1,-7.41 '. 1,902, 1,776 :
1,09:2:: .1,016 . 1,05:8 ;1, 10 I, l,.094! ' 1, 168'
55.7".
4:~ 7
537
532
572,
580
,2; 68,7* '. '2,446*." 2, 659~ ,,2.,.846>:<, ?,,932O:< 3, 084':~
331>:< .: 305*: 290
316'
363' 404,
.'5,744',
:5, 'a25
.
'
5,'742:~- .:5, 943
: '6,-23J:
.
6, 270 ;
'. 25:5 : 205
198
178
236: . 205:
'2~ 90'4 , 2, -,766 2,884 2,964 3, 104 '. 3,263;
.2 1 OS;1' ;1.; 944 " 2, 025
~; 88:1 .' ,3,.073 2,99~
2.,059, :3,172 ..
2, ,046, . 2, 1Q9 ; 3,04{ ,. 3,216 :
1440
430 . 397
433
396, .. 412'
'2; 223 2,079 . 2. 227 2,136 2,127' '. 2,214'
. 310 . 300
1:. 19:.6
; 28~ ,
342
-309
'274,
;I, 22~ . 1,'118
..
375':' 2,05:
1, 108,
339
382'
240: : 215:
. 1, :074' : I,...16.3
.
1,769 1,967 I, 129
586 :",070';'
373 6,419
239 3,202 2,302 3,377
Sl1 2,242
393 234 I, 130
.iTeb. 28
Mar . 7
1, 154 601 843 816 . 176" 829
1,92"1,8'14:"
1,269 700
3,214* 360
6,626
246 3,228 2,308 3,392
S09 2, 178
343
283 1, 164
1, 194 501 835 765 197 849
1,962 1,941 1,295
680 3, 143*
357 6, 888
263 3,278 2,469 3, 580
450 2,471
345
267 I, 176
Mar. 14
1,255 596 962 783 197 821
1,851 2,046 1,326
625 3, 164
437 7,094
232 3,708 2,408 3,713
S75 2,419
363 301 1,068
TOTAL 1959,
..
49,954>:< 50,993>'.. :50,951
..
30; Si7',:< l.9,761* 30,661>:< 31, 34~*. 31,784'*.32; 970>1< 33,425>'.. 33,980* 34,906>:< 35,944
.. .
P..
~.
.
TOTAL 1958
40,956 40,969 43,773
27;467 27,092 29, 153 29,477 29,640 29,975: 30,777 30,808 30,943 29, 863
1959 % of 1958
122
124
116
112
110
105
106
107
110
109
110
113
120
*Revised.
/
<GlE(Q)~CGllA CfRi(0)}P ~IEjp)(Q)~1rllNCG S)IE:lFRVllCIE
,Ii AGRICUL.TURAL. EXTENSION SERVICE UNIVERSITY OF GEORGIA AND T'HE .' STAT'" DEPARTMENT OF AGRICULTURE
' ':", '. ....,. !..: ,. .....
. ; . , .,
:, " U;. S. DEPARTMENT OF AGRICUL.TURE
..' AGRIC!JL.TURAL MARKETING SERVICE
319
'.
EXTENSION
.,'
eL.'~11',EARISRITEYNOSF .GGEC~'I..G.IA
.. Ma rch 1;;,' '1'95'9'
MAR 2'1 '59 .
,
PROSPECTIVE PLANTINGS REPORT
.' LlBHAHlts
f .'
\
....
The Cr.op Reporting Board of the Agricul'~1Jr~l Marke'ting S~rvice makes :the, fol10w- ..
ing r~port.for the United States, on th~ in~~cated acreages of certain crops in
1959 'based"upon reports from farmers, i:.n~)I~pa~ts.pf the country on or about
March 1 regarding thei r acreage plans fqr., t,he .1959., season. The, acreages for 1959,
are inte'r'pretations of reports from growers and are based on paSl: relationships
between .such
\
"
reports
and.
acre.age.s,~ctu~.I,ly"p.laf1ted.
,<.,
The pu'~pose of this rep~i-t' i~'t~ ~;,:~.:js\"g~ow~rs generally ,in making such:furthe,r
changes, intheir acreagep..lan.s as m~y,;app~~.r desir9bl~:~ The acreages actlJa'lly
planted' in 1959 may turn out to be.. large.r or smalle,r.than indiG:ated, .by reason
of weather conditions, price changes, labor supply, financial conditions, the
agricu.ltura' program, and ,~he effect qf . this r~port. iitself upot:!'fa.rmefS l ac.tl~~s.
~ ". _ fROSl'tCT I VE_ pLANtiNGS. FQR J 959 "
.'
: _ : _' __ f L 8'~' J, E'D 8 C B E 8 Gf:S'
_
CR0 P
: Average .
.
. 1~59 as 'a per- ,
- - - - - - _. -, ... - - - - - - - ."
. - - .. - - - : 1948-57 : 1958
_. : 1959 : cent of 1958
~~
~
.
~" ~
Thousands Thousands: :'Thousands ',' Percent' . :.'.,
j." .-',.
". ,
,
.'
UN! TED STATES
'.' ,~, .
,
.!
;.I
..
J"' . , - - -~: ~.- - - - - - - -.~ - -
1 t' Corn, 'a
4 .'
All Spring "'heat
-8~ -7'~-5' - .~ -7~ ~5'~'~"~'~3'~9il- -
I
J . ' . ' :,
18,603' 12,343 "
J
1'3,405
-
-
!' - -
I) 2.4
108.6 ','
Du rum OtheP Spr~~g
Oa t 5 }~: ~
.
Sa r1ey .
Sorg~u.~s~ All
Potatoes' J/
.
n 2,485 ' .. 9,47
,16, 118 ; . ,396
44,028 ' .. '38,430
12,924 '.' '16,Z~8
iI ~484
2l,176"
1,507'
f .498"
I ,,273
12 '. 13 2.
35,~98 1},O'9 20',4.~0
1 ~'3'9Z '
.1f0364.'.54.. .
. 9'1.7.
. , ~ I0,5 . 1
.96~5
92,,9
, .'
.'
:' t':
Sweet Potatoes 3/ ..
361
272'" 275
101. I
Tobacco II .. :
.
Soybean.s .?'/ ...,..
peariut s '~/ ....
Hay 11 ........... ;'
'.
1, 561 16,822 2.269 74,081
, 1,081
I , 161
'24;900 ' ....23:f7i'
1 ,7-55 . " " I ;7o.~
'7J,03J. ',. 70,!-+99
I
I.
'0\
107.4 " 9') ~:I
97.0
96 .. 5
",
GEORGIA .
.. .
.... "
".
-..
Corn J ' "l,I.! .. .., , ;
3,015
'2,733"
2,'870
. 105
Oats ": .':
" ; ' . 758 : :" . 5'39
496,
9i'
.8a r Iey. ' : ,
.. 9.... .." 12 '
l2''
.. 100
'.
,
Irish Potpto'es" All
: " : 6.7'
.; . 4.8 '.
"4.5
94
Late Spring 3/
Early 'Summer' J/
Sweet 'Potatoes' .., /
Tobacco~ All U J
3.0
2.0
" . 'oj .},'j'"
.... ,.:,'..2~8 .
.', ,,29 ." ." '., '1 t: . ~
':" '95'~9' :';,' ':--; 59.1'
1.8
'2.1'
12 . . I 72'.1"
90 97: ": 10'0 '122' ,.'
Sorghums, All .Soybe~ns, Alone 2/ Peanuts 2,/
Hay, All 1/ .
54 .' .89 .1'. ,-749:.. . j:
,', .' 96]- ~ ..... ~:
69
65
-15921;'~5,~.,
117 "'574
:.....
:',.:63. 9. "
~'.'59.'4,
..
";'
94' 10.2 97. 94 ..
1/ Acr~ag.~ Harvested .2/ Grown alone:,for.all: purpos.es: .. '3/:'1949:"57' Average.
Georgia farmers have indicated they plan to plant about 2,870.000 acres in corn i:Iuring 1959. If current p.l.ans material ize, the 1959 acreage wi 11 .be a~9ut; five percent larger thC)tl die 2'.733.000 planted in 1958 b,u.t .fl,ve p~rcent.smaller t.h~n the 1948-57 average plantings of 3,015,000 acres. The"increase for 1959 is attributed
to the el imination of acreage restrictions in 28 heavy producing counties and
Jncreased interest in the production of corn for feed and as a cash crop.
I
SMALLER OATS ACREAGE: Seedings of oats made last fall and this spring indicate
,
Georgia farmers have planted 496.000 acres In oats for 1959.
This represents a decl ine of 8 percent from the 539,000 acres seeded the previous
year and is 35 percent below the 1948-57 average seedings of 758,000 acres. The
1959 seedlngs are the smallest for Georgia since 1935 when only 462,000 acres were
planted.
TOBACCO ACREAGE UP SHARPLY: Plantings of tobacco in Georgia are expected to reach 72,100 acres for 1959. This will be an increase of
13,000 acres or 22 percent from the small 1958 plantings of 59,100 acres. The indicated 1959 acreage although up sharply from 1958 is still 25 percent below the average 1948-57 plantings of 95,900 acres.
PROSPECTIVE PlANTING REPORT 'FOR GEORGIA AND UNITED STATES (eonld)
GEORGIA: The State's allotted acreages for 1958 and 1959 are virtually the same. Hence~ ihe larger acre~ge reflects a reduction in influence of the
Acreage Reserve Program.
PLANTING OF PEANUTS EXPECTED TO DROP: Peanut growers in Georgia will plant 574,000 acres of peanuts alone If they carry out
their current intentions. This acreagQ would be three percent smaller than the 592,000 acres planted last year and 23 percent smaller'than the 1948-57 avera9~~' plantings of 749,OOO'acres. The',1959 expected plantings include 'peanUts alone for hogging off and for: other: purposes as well 'as for picking arid threshing. ,;',1 "
SMALLER SOR-GHUM ,PLANTtNGS:.Georgia farmers have expressed intentions to plant six percent fewer acres in sorghums for all purposs'in .
1959. The March I Indicated acreage for all purposes is 65,000 acres compared ,. with 69,OQOl,Bcres:planted in 1'958. However, the 1959 Intended 'acreage is 'still', 23 percent larger than: the 1948-57 average plantings of 53,000 acres.
MORE SOYBEANS, EXPECTED: Farmers i'n Georg i'a, report they intend to p Iant 117,000
.... ,
acres of soybeans alone1for all purposes duri,ng 1959'. '
This would be an increase of two percent compared with the 115,000 acres planted
in 1958 and is ne~!ly a ,third larger than the .J948-57' average plantings of
89,000 acres.
,\
UNITED STAT'ES:, ,Crop plantings for 1959 now,'seem likely to be about 2 percent
- above the low levels of the past 2 years but about 5 percent below the early 1950's~ 'Corn acreage may exceed last year by over 9 million acres for the largest planted acreage since 1949. Inte~tions for planting oats, soybeans, sorghums, and'cutting tame hay show substantial reductions from last year
i
CORN: Farmers ani planning ,torJplant the largest 2!!! acreage s'ince 1949. The
intended p-l'a"tings of 83.9 million a~res are 9.3 million above plantings
last year and 2~2 'million above average . The large increase from last' year
results largely' from the removCll of corn allotments in the commercial area and
from the expiration of the Acreage R~serve ProgrClm, wh'ich accounted for 6~7 mill~
. ion acres of corn' allotment in '1958. ,
", . >,.
OATS: The acreage of oats seeded last fall and intended for this' spring totals 36.0 mllHo'n acres. This is a reduction of slightly more than 2.4 mil1ion
acres, or 6 percent from 1958 plantings, '18 percent below the average, and the
smallest of record'which begins with 19i6.
PEANUTS: 'Peanut growers 'expect to plant 1,702,000 acres of peanuts alone, accord-
ing to their expressed intentions about March I. This acreage would be about 3 percerit'''les's than that plante'd last year and 25 percent below the 1948-
57 average of.2,269,OOO acres,. These acreages include peanuts to be grown alone for hogging off ~nd for other purposes a~ well as for picking and threshing.
TOBACCO: As of March I, tobacco growers expressed intentions to plant 1,161,000
acres of tobacco. If this acreage materializes, it will be 7 per~~nt~
abov~ the 1,080,800 acres harvested Isst vear, but excluding 1957 and 1958, th~
smallest since 191 I.
';,:'
.. ,,'I
Acreage of flue-cured types Is expected to total 698,300 acres -- 9 percent above
the 638,400 acres harvested last year. Excepting 1957 and 1958, this yearls
acreage would be the lowest since 1934. 'Using the 5-year average yield of flue
cured and this year's Intended acreage, a pro~uctio~ of 1,053 .million pounds. is
de rived. ".
',
I\RCH IE LANGLEY: " 1\ Agricultural, Statistician In Charge
"
....
,,
WILLII~ E. KIBLER
"
.. AgrIcultural Statistician
"I,
"
',
I~
"
:r
""
.,
....,; :;':.r'.
....: .. ,....
:;'
. . - ~
, ..
"
, ;:
. , , I , ,'
,I
.. I'
"
. , I,,
I ., "l
. t. ,.,'
:~' ... : . "~ ~.,
..' ".
,', -" \ l; ;
,~
': " .. : ':
:.,'
~.' , .' ! : :",
:J. 1, t
. :J;. . ~' j 1
.. . -,-
..... \".
.,1
:t
".',' ,
j ~ r ."
',.:'; :
'.
3/5
~lE(Q)~GHA C~(Q)IP> JRiJEiP(Q)ImTHNCG S[~VnCJE
AGRICULTURAL EXTENSION SERVICE UNIVERSITY OF GEORGIA AND THE STATE DEPARTMENT OF AGRICULTURE
Athens, Georgia
U. S. DEPARTMENT OF AGRICULTURE AGRICULTURAL MARKETING SERVICE 319 EXTENSION BLDG., ATHENS. GA.
March 19, 1959
PULLET CHICKS FOR BROILER HA TCHERY SUPPLY ,t"LOCKS February 1959 - United States
The indicated placement of pullet chicks for broiler hatchery supply flocks
by leading primary breeders of broiler replacement st'ock totaled 2,414,000
chicks during -,:<"'ebruary 1959 .. This was 6 percent more than in .February 1958.
Of this tota~ 2, 256-, 000 chicks were domestic placements. Pullet chick place-
ments during January 1959 totaled 2, 108,000 of which 1,940, 000 were domestic
placermnts.
'
The totals in'clude pullet chicks eold during the month, plus the number of pullet chicks expected from eggs sold during the preceJing month. The conversion from eggs to expected pullet chicks was made on the basis of 125 pullet chicks per case of hatching eggs sold. The primary breeders included in this report account for a very large percentage of total supply of replacement pullets fer broiler hatchery supply flocks. Sales of replacement pullets by these breeders provide an indication of'the potential number of pullets available for addition to hatchery egg supply flocks several months before the pullets will actually move into the flocks.
Pullet Chicks 11 Placements for Broiler Hatchery Supply !~locks (Reported by leading breeders)
Month
:
1957
1,000 chicks
:
1958 .' 1959
:
1, 000
1, 000
chicks
chicks
1959 as percent of 1958
percent
January............ : ~""ebruary. . . . . . . . . . .: March...... , ...... : April ..............: May........ , ...... : June ....... , ....... : July............... : August. ............. : September ..........: October ............ : November ..........: December .......... ;
Annual Total. ....
1, 886 1,997 2, 538 3,033 2., 899 2.,060 1,676 1,410 1,935 2, 2.97 1, 92.6 2,2.38 2.5,895
1,982 2,2.70 3, 118 3, 320 3,623 3, 390 3,054 2., 646 2., 700 2,568 2., 141 2, 147 3.2,959
2, 108~-'
2.,414
106~/
106
11 Includes expected pullet replacements from eggs sold during the preceding month at the rate of 125 pullet chicks per 30-dozen case of eggs. ~ Revised.
ARCHIE LANGLEY Agricultural Statistician In Cnarge
W. A. WAGNER Agricultural Statistician
UNIVERSlri (IF ([Uf-Gli'.
MAR 24 '59
LIBRARIES
.~
..
;:< ~::,t.Ti '~"., ;":~~.'
" t ;'!;
~.- .4 ,
; .. 't. :: .~~: ~
'.~
,.
.'. CHICKENS TESTED
_.1,
I
.
,.
H : ~ I ;
I~ Georgia 482,212'chi~kens for supplying broJler;~atchrng eggs 'were' tested
for pullorum disease dur.ing.february 1959--75 pe'r'c'cnt"rl,ore than the '27:i,75()..
tested in February 1958. Testings of egg-type chickens for Febru.:3ry were' 5,20
only 3~ percent of the. nUll1bef":_t~.st~~ in. February. 1a~~ .year.
!. :. . ~ .~. 1 I. :
. 'I
.
,. ,
In the states for which comparisons are 'ava'i'ltlble 2,363,505 chickens for 'suppiylng 'broi ler hatching, ~.gS;w~r~. te;;ted d.urin.g ,February 195~--up 84 percent
frorr:'February. 1958 . Test.i~.9S).-~4~Y,J9~a ~hr~gh. f'etlr.u'ary 1~59 totaled 19,7,00,088
up' 2'6 pe'rcent from .this per,ipd;;f3 y,~r earJi,~r ..:..;rtle :ovmber of thickens fo.r other'
pu'rposes (egg-type) te~tE;d,'9~rLn9.,'Fe.bruarY J~59..to't.a)~d 756;079--66 percent 'more
tha:n the, numbe r tested; j i.n f~i?r~ r;y 19$1> j' The .ru"?b~r'{ ~r' *;19,- type 'ch i.6kens t.es:ted
July 1958 through February I~59 totaled 11 ,893,848' dOWn aMy slightly, from' the ..
~.cJmc'~ri'Od'~'-ye~r 'oad i~...
. . '. '., '.'
~I ~
~
I'i' ; ,
. I'"l
rJ
'"
Thi s report I s ,made P~~siple. thro~gti \~e 'co6p~r~t ion of the Nat ionaFPoul try
Impr6~ement Plan offici.;;I...st<Jt~, a9'en,i,es',' ,d,e':At,irriaf Husbandry Researah Di'\ijs';on,
Agricul itural Resea'rchServi~~" ~nd the Agr(C;'l"ltur:~'f'E's'timates Divis'ion; A9ri.~.,..
)\ .'cultiJral Marketing Scrvd.c~.,:.: ".- : . ~ . . ' . ' .
: ! . ~'f i,'
"~ (. .'-"1
" l;
" : '. . .; " . . ' . . . . . '. " I
, ."J'/ .:_"
, .: '~"_'-.' ,':l:~; ~,!
~ I,.:',.
c.
Georgia .'_ .ChiqkgQ$; Tested by.Official".State Agencies'
;. - .~i, ;.
!. \: . . I
I.
~. . ~.
:.
I
J. ' I ) j \ I I .
,I
:
. ;
~; ')' .
F'o~ 'B~~'i'le''''''Pr~d~ction''' ., .... ',: ,; E99 Type Chicken~. :;;;'
Month :
. " ,', :. e = ..
, " '). ';
.: "..
,,"
'I 'J. '~. c' .) j" " _ ; .. ,. : :.
:
..: ., ". By Monthsc::; :.'; 'J. . , ,Cu~ul'atl've:I'-!.:"'; : . By Honths ..
" ....' !1957- 58 : "T95tl~'59"- ": "1'95'1'- 58:' 19:58-59. ,:,,'. ~ . 1957 - 58 : 1958- 59
July.' .:.; "'202',194
'. . ",' 253,865
"202 ~ 194
,. -1~U'9 ;.:. .' ...:: . 2JO , 292 . ..2.40 ,jQ2 ...... ;3?.f.~86
253 ;.86:5 . 494, I 67
17.274 47,736
S~P.t.. : 334.522 . 41),264 <767 .008'" 907.,;43 r :- 18,286
Oe'C ' . ,:.: 306,795' , 458,442 ). ,0.73 ,803 I ,36$ ;873.
27,242
Nov.. : 254,554
388, 136 1.328,357 1,754,60g'
. Dec. : 252,517 ',: . '432,318 1;580,874 2,186.-327
Jan. : 414,416
564,491 1.995.,290 2,750;.8)8 '
8,325 .14,836 61,618 .
Feb. Mar. I\p r. May June
: 275,750 : 255, 111 : 211.093 : 254,024 : 185.343
482,212
2,1.7l,040 2.5~Q, 121 2 ..737,244 2.,991,268
3, -.;.176,611
3,233',030:
... I,.. ,
."
... ':{' "
{ ...... ,
" 'j
13,675 . 12 ~086
. . 57,426 10,849
1'7,445
,'. ". ,
,,
..
30.299 '42,581 35.6.52. 41,043 26.186 84,778 34'., 194' ::-
5,280:;'~',
' ; J : /...
.: . '; ( ; .' ~
, ... ~'1' IJ
C.! i ' l :
.. '--
, I'.:' , I
. : ": I ' : ~. '.
~~~ _ United States - Chickens'Tes.ted by Offlc.i.a'CSt:ate Agencies
.' '" j ..... !-
~".:
- -" ... _......
H.Mont~.
. For Broiler Production ..... . ~y. Mont'hs' '1/'" .~.
For Eg9 Type Chickens'
, -' ,j.~
~ ..by' Month's 7.1 .~.
Ir
'~. '_L __
1.
.,
1957 .. ' '58; :, .,1958... 59. . : : ' 19Si ,. _5'8 _; . 1'958,- 59, ..1 '.~
,
r: .. !
)- 'Jd'l Y
.1,310,378
.J -'Atig;' I . -:. 1.600.805
1.628.129
3~3~753
1,596,792 .., , 6 76;;1'62,"', .
500,558 . '599,607
Sept.
2 .310,549
2,643,740
,'. "1' ,'Z'5'l ~)7b' '. I. I -: .. 1 ,'243,658.> '.,
Oct.
2,723,936
3,119,754
2,379,471
2,316,782
Nov.
2,225,580
2,951,368
2,483,280
2,342,596
Dec.
2,208.307
2,794,873
2.586.456
2,485,747
Jan.
2,014.868
2,601.927
1.741,051
1.648,821
Feb.
1.282,382
2.363,505
454,617
756,079
Ma r
1,587,391
485, 136
Apr.
1.701.022
245.750'
May
1,554,643
276.008
June
1.310,490
289.142
1/ Al I states except Mont., N. Mex Ariz., Nev. 2/ All states except Ohio, Del Okla Mont., N. Mew., Ariz Nev.
GEORGIA CROP REPORTING SERVICE
gricul tural Extension Service
U. S. Department of Agriculture
University of G~orgia and the
Agricultural Marketing ServiCe
State Depart.mentof Ag:-.iculture
319 Extension E1G-g., Atliens r Ga.
-----------------_._----~-------------------------------~-----------------
GEORGIA CHICK HATCHERY REPORT
lviarch 25, 1959
.
Athens, Ga., March 25 -- A total of 7, 305, 000 broiler chicks ;.were placed
with produce,rs in Ceorgia during the weelc ending March 21, according to the
Georgia Crop Reporting Service. 'This compares with the 7,094,000 placed the
previous weel, and is 25 percent more than the 5, 840, 000 placed the same week
last year. .
.Egg.s set by Georgia hatcheries amounted to 9,925,00'0 compared with!
1.0, 030, 000 the previous week and is 16 percent more than the 8, 586".000 for the
carre s.pq.rlding week last .year. ' . . '
'.'
,
..
i
\
,
I
The'majority of the price s paid for hatching eggs were reported within a
r~nge: of 40 to 55 cents with an average of 49 cents compared \fith a range of
40 to 60 cents and an average of 51 cents per dozen last week.' Most prices .
charg~i for chicks were reported within a range of $7.00 to ~;9. 00 with an
a'trerage 'o~ $8. 00 pe'r, hundred compared with a range of $7.00 to $9.00 with an
average of $8t 25 per hundred last week. The average prices last year were
82 cents for .eggs and $14.25 for chicks.
:
Weighted average prices from. the _;'edera1-State Ma~icet News Service for broilers during the week ending March 21 are as follo'ws: Georgia broilers
2 3/4 - 3 3'/4 :pounds, at farms 16.66f; FOB plants 17.51.
GEORGIA EGGS SET, HATCHINGS, AND CHICK PLACEMZNTS
.i
.I
BROILER TYPE
:
I'i . EGG TYPE
!
W'ee~ ' .. Ending'
..
i
Eggs Set !!
' 1958
1959
I
1959 'Yo of 1958
Chicks P1ac.e j for
,Eggs Chicks
. Broilers 'in Yeorgia. I Set Hatched
1958
1959
1959 %
. of 1958
1959 1959
,:
Ja.~. 17
Jan. 24 Jan. 31 i'eb. 7;
Thou.
7,859 8, 199 8,278 8,433
Thou.
8,081 8, 351
8,~90
8,854
Percent Thou. :Thou. Percent
...
"
.'
103 5, 524 5, 825
105
102 6,041 ~, 742 . 95
101 6, 112 5,943 . 97
105 6,.165 . 6,233 ' 101
:Thou.Thou.
659 494 . 672 462
713 453 .
663 571
iTeb. 14
8,411 9, 175
109 6,108 6,270
103
Feb.21
8,302 9,615
116 6, 13~ 6,419
105
?eb.28
8,291 10,082
122 Q,244 6,62.6
106
653 545
732: 590 746 587
Mar. 7
8,003 10, 143
127 6,307 6,888
109
807 530
Mar.14
8,474 10,030
118 6,015 7,094 '" 118
864 610
Mar.21
8, 586 9,925
116 5,840' 7,305
125
923 702
I
-1/
Includes
eggs
set
by
h.atcheries
producing
,chicks ,
.fo.r.. .ha.tchery
supply
flocks.
ARCHIE LANGLEY Agricultural Statistician In Charge
---------_ ..... _...
W.' A. WAGNER Agricultural Statistician
:)
...
UNIVE'RSITY OF GeoRGIA
MAR 26 '59
LIBRARIES
I'
3TATE
,,
.
.
Maine
.,
Connecticut
Pen~1sylvania '
In.:iian::i
Illinois
1v:issouri "
Delaware
Marylanq' Virgini~ ,
. ''
West 'ii'rginia North Carolina,
30uth Carolina
GEORGIA
Florida'
Alabama
Mississippi -
Arkansas
Loui.siana
Te;{as
,
Wasuington
Cregon . California
EGGS SET AND CHICKS PLACED IN COMMERCIAL 'AREAS. BY' WEEKS - 1959 .
Mar. 7
Mar. 14' .
.
Mar. 21
EQGS S2T - :rHOUSAND3.
"
W. eek Ending ,
-
I Jan-,
Jan.
17
-24
"
.
Jan'. 31
"
,. ~.
"
','
Feb. , .2eb.
Feb., ' ~eb.
7
14
~1
,28
"
eHrel,s PLACED - m,OUS-,,\NDS
1; 553
1,216
1, 308
2, 26,8
331
2, 126
2, iS8
2,852
: 2, 728 .-
377
4,328*
:
614
10, 143
1~ 691 1, 169 1~' 3'60 2,084'
394. 2,22::1,
2,205 2,810' 2, 54Lj,
354 4,266
620 10,030
'1,4,87 ..
1, 113 ,-
1,464 ", :
2; 389
410
2,210
2, 126-
2,800
"
2,463
.-
365' , '- '
4, ,286, 616
9,925'
.
,
1,251 1,274 " 1,280
532 , 594*
576
, '57'0* " 753
']09
657
730 ' _,63.9'
189* . 1>14* , 181 >:c
' 732
723
738
i,79'1 '; .1, 97 8' ~ 2, 11.1
1,688 1,746 ,1,741
1,0.16 1,058 ' 1; 10 l'
,437 \ 537
532
2., 44Q* '2,6.59* 2,816)(:
-305* '_' 290
316
5,825 '5,742 5,943
1,286 - 1,272 1,229
648
668 ", 606
"778 ' ' 724
731
. 61.3 ' ' ,744- , 877
12,0
130 ' 168
800
848
865
1,837 2,063 1,769
1,902 - 1,77,6,' 1, 967.
1,094 -I, 168 1, 12:9 ,
572
580
586-
Z,-93Z* 3;084;:< 3.070*
363
404
373,
6,233 6, 270 .- -6,419
.1,: 154 601 843 816 176 "829
1,927 1,814 1,269
700 3.Z-14*
360 6,626
366 4;398 3, 141 4, 583
457 4, 504 3, 148 4,(>'43
: '%05 .. 4,545 ' .
3,295 : 4,675' '
205
2; 7'66
1,944' 3,0'73 '
198 2,' 884 2,'025
2,'998
178
236
2,964 3, 104
,.2,059 2,046
3, 172 , 3,044
205 3,263 ' 2, 1'09 ' 3, 276
239 3,202 .
'2; 302,
3, 377 '
246 3,228 2,308 3,392
783 3,052
480
370 1,' 818
823 3,072
426
437 1, 781
801 , 3,005
421
485 1, 772 '
430 2,'079
284,'
'30~'
1,226
397 2,'227
,342
274 I, 118
433' 2, 136-
375* 205 1, 108
396 ' 2, 127
339 240 1,074
412
511 ' 509
2,214 2, 24i ' 2, 178
382
393'
343
215 ' ~ 234'
283
1, 163 ' 1,130 ' 1, 104
Mar. 7
1, 194 501 835 765 197 849 "
1, 9621,941 :. 1,295
680 3, 143
357 6,888
263 3,278 2,469 3,580
450 2,471
345 267 1, 176
Page 2 ~
Mar. 14
Mar. 21
1,255 596 962 783 197 821
1, 851 2,046 1,326
625 3,164*
437 7,094
232 3,708 2,408 3,713
575 2,419
363 301 1,068
1, 243 519 787 873 154 883
2,051 1,886 1,219
731 3, 384
377 7,305
239 3, 514 2,593 3, 822
493 2,271
356 257 1, 165
TOTA.L .1959 TOTAL 1958
1959 % of 1958
*Revi se ....
50, '993* 50, 951
41,805 43,773
122
11~
51,'055 45,493
112
29,761* 30, 661* 3~~ 343* 31,784* 32,970* 33, 42~* ,33,9&.0>:< 34,906* 35,944
: 27, Q,92 29,'153 29,477 29,64:0 29,975 30,777 '30,808 30,943 29,863
-,
1-10
1:05
106
107
11'0 :
,
109 :" 1.10
113
120
36, 123 29,291
123
0,
GJE CO) ~ cG llA
ce ~ O.J
~1E JF.OJRT.liN.G
JE IPl Vll.ce IE
.' AGRICUL TURAL EXTENSION SERVICE
" UNIVER~ITY OF GEORGIA AND THE"
- ...- .
STATE DEf?ARTMENT OF AGRICULT.UR'E .
Ath.eri:s; "Georg'ia
: _.,
.'... . .' .
. .. ,-
I). S. DEPARTMENT OF AGRICUL TURF:. .-".... 'AGltlCtll;TURAL MARKETING SE.,NICE
..': ; .3'$ EXTENSION BLDG., ATHeNS, GA.
March 1959
- .Oata from Georgia' 19'58 We~k1y. Hatchery Repo'rts on Broiler Chicks ...............
r (ReV'ise'd March 1959)
(
Week Ending, ( .1958
1'_ '10
Ja.L 4
Eggs Set:.
1, 000 7,361
,. Hatcliings and Cross State Movement
Total' :Hatcl:ied 1/ :Shipped: i:ota1 H t h d :for Local : into :
ace :Placement: State Placed
1,000
1,000
1,000 1, 000
Prices'
:Paid'for :Received
'Hatching :for Broiler Eggs : Ch.icks"
(f)
(~) .
5,353
5,052
429
5,481
~7f:>
13.50
Jan. 11
Jan."; l'a'-
7, 599 7, 859
5.347 5.313
tl,948 ".k,922
571
5, 519
.76
13.50
602
5. 1524
.77,
1'3. 7'~Y: '.'
Jan:',25i 8,19'9
5,689
5; 353
Feb. 1
.. . . l
Peb. 8 ?eb.' 15 Feb'.: 22'
8,278 8,433 8, t.?ll 8,3'02
5, 884 5,945 6,000" 6,115'
5,.543 5. 564 5; 570
S. 580
688 . 6,041
599
6, 142
601
6, 165
538
6, 108
552
6,'132
;78
.79
"
.79
','
eo'
:80
1'3'.75
..;1 ,',
13.75
l"
=': .
13.75
f
f4. 00'
13 1.75""
Mart... 1:
Mar. 8 Mar~ "15:
Mat.. 22:
8,291
,
8.003
8,47<1
8, 586
6, 129 6. 136 5.'9"97'
5.759
5, 642 5.636 5,,474
5,309
602
''', ("
6,24
80
671
6. 307
80
541
6.015:
81
531
5.040'
.82
14.00 14.25' :,"'1 14.25'
Ma r ..- 29 ' 8, 7j 3
5.981
5,476
627
6. 103
.82
14'.25
Apr. 5 Apr. 12
8.954
9. 141
6. 297
6, 568
5. 75S
6.088
t
_
713
6.,468
..8.2\
14.25
607
6,695
.82
14.25
Apr. "19' Apr'. 26:
9,265 9, 544
6, 567 6, 787
6,055
6,' 2.33
65'4
6,709
.82
593'
6,,826
.82
14.25' 14~ 25' ' \'
\",
May 3
I
May '10"
May' '17
May 24
May 31
9,428 9; 204
9,.~89
9,766 9,668
6, 883 6,949 7, '1'01' 7.090 6,958
'6: 6.~68
589,
6, 857
6,'40'4' ~ - '''5'30'' ...... "9"34
.... ; ';
,;.
..
6. '563 .': ." 6i4' ... , '1.237"
.
;.....:..:" ', ..
6, 541
572
7. 113
.82
1~.25
.... 82
14."i5 .!
.S2 . , .' i4:Z5." ....
.81
14.00
6,469
682
7, 151
.80
14.00
June 7 June 14 June 21 June 28
9,616
9.360
9,082 8,658
7,278 7, 178 7,094 6,928
6,691 6,587 6,600 6,397
420
7. III
.80
13.75
476
7,063
.79
1:;.75
553
7, 153
.79
13.75
481
6,878
.79
13.50
July 5 8,741
July 12 8.771
UM:f&\SyTY or ~IllRGIA$. 560
~k~ '59 $. 254
6.848 6,650 6,336
6, 337
6,325 6,240 5, 898 5,908
399
6,724
.78
13.25
629
6,869
.78
13.00
442
6,340
.76
12.50
421
6.329
.74
12.00
Data from Georgia 1958 Weekly Hatchery R~ports on Broiler Chicks (Revised March 1959)
Week Ending 1958
Eggs Set
1, 000
; Hatchings and Cross State Movement.
Prices
T t 1 :Hatched!.! :Shipped:
H:t:hed :for Loca,1' : intd :
pT ~ta1 d
:Paid for: Received !Hatthing: for Broiler
':Placement ! State:
ce! Eggs ~ Chicks
1, 000
1,000
1,000 1, 000 (~)
($)
Aug. 2 8,302
6, 333
5,800
393
6, 193
.72
11. 50
Aug. 9 8,010
6, 189
5,612
357
5,969
.70
11.00
Aug .. 16 7,448
5,968
5,443
425
5, 868
.68
10.75
Aug. 23 7,294
5,828
5,323
337
5,660
.67
10.50
Aug. 30 6,968
5,695
5,214
279
5,493
.66
10.50
pept. 6 Sept. 13 Sept. 20 Sept. 27
6,971 7',298 7,319 7, 141
5,318 5,113 4,996 4,963
4,849 4,738 4,673 4,622
330
5, 179
.66
10.50
285
5,023
.66
10.75
200
4,873
.67
11. 00
230
4, 852
.67
11.00
Oct. 4 Oct. 11 Oct. 18 Oct. 25
7,110 7,248 7,234 7,239
5,291 ?,277 5,263 5, 222
4,907 4,815 4, 827 4,704
245
5, 152
.67
11.00
302
5,117
.67
11. 00
250
5,077
.67
11.00
330
5,034 .67
11. 00
Nov. 1 Nov. 8 Nov. 15 Nov. 22 Nov. 29
7,394 7,549 7,595 7, 524 7,832
5,316 5,271 5,2.64 5,386 5,486
4,768 4,712 4,692 4,861 4,983
353
5, 121
.67
11.00
383
5,095 .67
11.00
324
5,016
.67
11. 00
335
5, 196
.67
11. 00
337
5,320
.67
11. 00
Dec. 6 7,420
5, 582
5,059
329
5,388
.67
11. 00
Dec. 13 8, 146
5, 529
4,954
301
5,255
.67
11.00
Dec. 20 8,092
5,853
5, 273
461
5,734 .67
11. 00
Dec. 27 7,844
5, 306
4,944
460
5,404 .64
10.50
TOTAL 427,108 311,946 286,864 24,233 311,097
!J Total hatched less outshipments, breeder replacements, destroyed, etc.
."
__, ...,-ro"'.... . . , "",-.r,~:,..-.""'"
I-:r'\rt ""'''':
~-O~~ IJ ..... " ....-:.; ........~ "'''"r..---l!.~_~.; n 'li''''''''m'I''''\~Q 4l""\n~,",,,,ol")rf
G E 0 R G I A C R 0 n-', REP 0 R
~gricultural Extension Service
Iqrq University of Georgia and the
": tI State Department of Agriculture
-----------
4
GEORGIA CHICK HATCHERY REPPRTIBRARIEs
G SER VICE S. Department of Agriculture
ricultural Marketing Service
9 Extension' Bldg. , Athens, Ga.
-------------------
April 1, 1959
Athens'. Ga., April 1 -- A total of 7,440,000 broiler chicks were placed
with producers in Georgia during the wezk ending March 28, according to the .
Georgia Crop Reporting Service. :This compares with the 7, 30~, 000 placed the
previous week and is 22 percent more than the 6, 103,000 placed the same week
last year.
,.'
Eggs set by Georgia hatcheries amounted to 9, 979.000 co:npar'ed with 9,925,000 the previous week .and is 14 percent more than the 8, 733, 000 ~or the corresponding week last year.
Beginning with this release two prices for Georgia produced hatching eggs were obtained;. one for all hatching eggs, the other for eggs purchased at. the farm from flocks with hatcheTy-cwned cockerels. The averag~ reported for all eggs was 48 cents and the ".verage for eggs purchased at the farm from flocks with hatchery-owned cocke:rels was 48 cents. The majority of tre prices reported were within a range of 40 to 55 cents a dozen. This compares with a range of 40
to 55 cents and an average of 49 cents per dozen last week. Most prices charged for chicks were reported within a range oi $6.00 to $9.00 with an average of
$7. 50 per hundred compared with a range of $7.00 to $9.00 with an average of $8.00 per hundred last week. The average prices last year were 82 cents for
eggs and $14.25 for chicks.
Weighted average prices from the Federal-State Market News Service for broilers during the week ending Mar.ch 28 are as follows: Georgia broilers 2 3/4 - 3 3/4 pounds, at farms 15.42; FOB plants 16. 35.
Week Ending
GEORGIA EGGS SET, HATCHINGS, AND CHICK PLACEMENTS
,.
BROILER TYPE
I EGG TYPE
Eggs Se,t !!
Chicks Placed for Broilers in Georgia
Eggs Chicks Set Hatched
1958
1959
j 1959 %
of 1958
1958
1959
1959 '"10 of 1958
1959 1959
Thou. Thou. !percent Thou. Thou, iPercent Thou. Tho~.
Jan. 24
8,199 8,351
102 6,041 5,742
95
Jan. 31
8,278 8,390
101 6. 142 5,943
97
Feb. 7
8,433 8,854
105 6, 165 6,233
101
.r""eb. 14
8,411 9, 175
109 6. 108 6,270
103
Feb.21
8,302 9. 615
116 6, 132 6,419
105
Feb. 28
8,291 10,082
122 6,244 6,626
106
Mar. 7
8,003 10, 143
127 6,307 6,888
109
Mar.14
8,474 10,030
118 6,015 7,094
118
I Mar.21
Mar.28
8, 586 9,925 8, 733 9,979
116 5, 840 7,305 114 6, 103 7,440
125 122
672 462 713 453 663 571 653 545 732 590 746 587 807 530 864 670 923' 702 793 764
1/ Includes eggs set by hatcheries producing chicks for hatchery supply flocks.
-
ARCHIE LANGLEY
W. A. WAGNER
Agricultural Statistician In Charge
Agricultural Statistician
',-' ~
...
"'''\ -.' ';, ! ..- "(_::
T
STATE
Maine Connecticut F enl' sy1vania Indiana Illinuis Missouri Delaware Maryland Virginia West Virginia North Carolina South Carolina GEORGIA ,tt""'lorida Alabama Mis sis sippi Ark2.OlSaS Lot..isiana Texd.::i Washington Oregon California
- . .... '
:
i
.. .~
'Mar.
l4
EGGS
S"~'-' T
AND
CHIC,KS
!
PLACED'; IN
~
:
COMMERCIAL
A-RE.'A~.:>,
- - ,
,
-
:
.V! eek ~~ding
"
"
. Mar.
Mar.
: Jan.
Jan. . . Feb.
.feb.
21
28
24
31
7
14
-
- BY WEEKS 1959' ,- '.
"
..
Feb. 21
Feb, 28
Mar. 7 ..
Mar. 14
EGGS SET' - .THOUSANDS
I
'.
CHICKS PLACED - THOUSANDS
,
,. age 2 ,
Mar. -21
,
Mar . 28
1,601
1,487
I, 169
1, 113
.1,360
1,464
2,084
2,386
~94
2,223
410 2,210
2,295 ;. 2, 126 2, 810 .2,800
2, 544 35~
4,29'6.
62.0
2,463
365 4,'286
- 616
10,030, 9,9l5
4 !?-;r
4, 50~.
1, 148'.
405 4, 545 3,295
" 4,64'3:
- " 823-
i. 072"
,~ 426-
~~ 4.3 7
4,675 801
:3,005 42.1' 485
1"',.'7-81
1,772
1,565 1, 107 1,370 2, 183
414 2,075 2,065 2,606 2,427
335 4, 279
603 9;979
382 4,601 3,262 4,725
797 3,235
478 469 I, 731
~1, 274 1,280 1,286 1,272 1,229 1,15,4 1~ 194 1,25~ 1,243
594* 576
648
668
606
601
501
59~
5i.9
753
709
778
724
737.
843,
.835
962
787
730
639
613
744
.877
816
765
783
873
114*
181*
120
130
168
116
197
197 .. 154
..
. 72~:
1 , 9. 7 8 ;,
: ~.. 73B :2.:; III
. 800. '" 8.48 J,837. ~2j, 063
.86'5.
8l9.
~,.76_9 ., 1,927.
8~9 , 82l:
I, 9B2 '.. 1, 851
88~
2,051
-
'" 1, '74h: J~' 74) 1,902".
1,058' ... '537'
1.,
.. :'
10'i 532
1,094 : 572
i,659* : i; 846* . 2, 932*
'f,776 'I, 9~7
I, 168 ~, 129 -
580
586 :.
3, 084* . ~,070*"
1,814-
1,269 7"00,
3, 214:>:<
1,94 1 1, .295
.-
'2,046 '.~, 326'
680
625'.
3, 143 3, 164*
1, 88.6 I, 219
731 3,384
290: . 316." ~ 363
404
373
360
351
437:
377
5,742~ 5,943' 6,233 6,270 6,419 6,626 6,888 7,094 7,305
-
.'
198
178
236
205
239
246
2.63
2'32 . 239>:
2, 884
2,964
3,104
3,263
3,202
3,.228
3,278
3, 7'p.~ ':
:-3514 J ....
2,025 2,059 2,046 2, 109 2,302 - 2,308 2,469 2,408 1 .'2~:593.
2,998 , 3, 172 3,044 3,276 3,377 3,392 3,580 3,71-3 3,822
397
433
396
412
511
509
450
575
494
2,227 2,136 2, 127 2,214 2,242 2, 178 2,471 2,419 2,271
342
375* 339
382
393
343
345
363 ,356
274
205
240
215
2.34
283
267
301
257
I, 118 I, 108 1,074 1, 163 1, 130 1, 164 I, 176 1,068 I, 165
I, 231
496 690 961 183 845 1, 931 2,084 1,273 678 3,376 379 7,440
216 3,661 2,609 3,761
505 2,475
350 246 1,213
TOTAL 1959 TCTAL 1958
1959 "/0 of 1958
*Revised.
,
50,951 51,055 50, 688
43,..773 45,493 46,057
:116- " .... ,.
112
, . 110
. --. ; , ~, ."'
-.'
"
30,661* 31,343* 31,784>:< 32, 9-.70* 3'3,.425* 33,980* 34,906* 35,944* 36, 123 36,603
29, 153
,.
105-
,"
29,.477 ;106
29,640 29,975 30,777
,
-v
107 I'
- ,.; -,
,
,.
."11 0- ..~
109
,.
30,808 110
30,943. 29,86.3.
113
120
29,291 123
30, 134 121
(GIE(Q)~CGllA C~(Q)~1rlllNJCG E~VllCJE
AGRICULTURAL ~)(Te:NSION SH~VICE UNIVi::RSrrV OF G.EORGIA ANO THE
STATE DEPARTMENT Or- AGI!I' ;ULTURE
Athens, Georg~a
U, S. DEPARTMENT OF AGRICULTURE A<..;RICUI..TIJRAL MARI~ETING Sl!RVICE 319 EXTENSION i'!L.,CG., ATHENS, GA,
April 7, 1959
\ OEORGIA: The All Commod:.ty Index of Prices Received by'Georgia Farmers increased
one point to 2';9 percent of it~ 1910-1914 average during the month ended March 15, 1959. I1creaseG in the prices received for corn, lespedeza seed,
milk cows, beef cattle, calvcs,u~nd commercial broilers were primarily responsible for the increase. Partially offsetting w~re lower prices for wheat, oats, cottonseed, all hay, hogs, all'milk wholesale, and eggs. The March Index was approY~ ~ately one percent below a year earlier.
UNITED STATES: The Index of Prices Received by Farmers rose 4-tenths of one per-
cent (1 point) during the month ended March 15, to 244 percent of its 1910-14 average. Most important price increases were reported for cotton,
peef cattle, onions, tomatoes, c\lcurnbers, corn, and wheat. Partially offsetting were lower prices for milk, e~rs, lettuce, and strawberries. The March index
yfaS nearly 5 percent below a year earlier~
Th~ Index of Prices ,Paid 1~ ~armers for Commodities, Interest, Taxes, and Farm Wage Rates rose one-third of 1 percent (1 point) during the month. With the
Parity Index and farm product ].rices both.up slightly, the Parity Ratio was 82, the same as in February, but 6 percent lower thml a year earlier.
Summary Table for Qeorgia and the United States
Index
: March 15 : February 15: March 15:
Record Hlgfi
1910-14 = 100: 1958 : 1959 : 1959 : Index : Date
UNITED STATES
Prices Received:
256 .
Parit;y Index 1:7-: -----293
Parity Ratio
:
87
2h3 ' :
2g-7
:
82
:
244 : 313 : Feb. 1951
298 :-~>'o-- ---:-27Ja.n:-1959
8 2 : 1.~3- --:- DeC J..9h6
GEORGIA
Prices Received
All Commodities:
262
258
All Crops
274
275
Livestock and
237
222
Products
259
310
Mar. 1951
275
319
Mar. 1951
224
295
Sep. 1948
II Prices Paid, Interest, Taxes, and Wage Rates based on data for the indicated
- dates.
,gl Also March 1959.
ARCHIE LANGLEY Agricultural Statistician In Charge
RAYMOND R. HANCOCK Agricultural Statistician
PRICES REi~IVED BY F.AlM:RS MARCH l,?, 195~ WTm COMPARISONS
------
COWmDITY AIm UHT
Vfbeai,- bu.
Oats, bu.
Corn, bu
Barley, bu.
Sorghum Grain', cwt.
GEORGIA
i
~
i
Average Mar. 151 Feb. 15
1010-14 1958 1959
1.23
$
.67
$
.91
$
$
2.071 1.97 .91 I .89
1.431
1.25
I '2.15
1.28 1.20 2.20
UNITED STATES
i
.-
I is I Mar. 15
Aver~g;
~r.
i 1959
1910_14: 1958
Feb':lS -r;~';:i5
1959 ~959
1.96
I. .884
1 :96 ,I-!-J,=-."""7,...,.4-.j: 1.76
.87
I .399 I
.62 rJ
.60 I .59
1.30
I .642 i 1.00 II 1.04 I 1.06
I
.
! '1.20 I .619
.85 I
.92 I .90
2.15
1.69
;t .75
1~76
Cotten, lb.
12.1
32.0 I 34.0
34.0
12.4
26.0
28.3 I 30.2
Cottonseed, ton
$ 23.65 50.00 I 51.00 50.00
22~55
51.20
43.80 I 45.40
Soybeanfi, bu.
$
2.15 I 2.10
2.10
2.1C'
2.05 2.07
Peanhts, lb.
5.2
10.5
4.8
10.1
1l.0 I 10.7
Sweetpotatoes, cwt. $
.84
5.50 I 5.50
5.55
1.60
5.58
4.36 I 3.83
Lespedeza Seed,All,cwt.$
1l.60 I 12.80 14.90
9.05
10.00 I 10.30
Hay,baled, per ton
All
$
Alfalfa
$
Lespedeza
$
Soybean & Cowpea
$
Peanut
$
Wool, lb.
I 3268..5300
27.80 37.00
30.30 e.9.50
30.20 31.00
23.10 23.70
M . O' 39.0
27.40 37.00 29.00 31.00 23.00
39.0
18.3
18.50 ; 18.20 . 23.40
29.90
I 22.60
! 41.7
I 19.30 18.80
I 19.90 19.50
21.60 21.00 28.40 I 27.90 20.90 I 20.40
I
35.1 35.1
Milk Cows, head
$ I 33.85 14~.DO 1165.00 1110.00
Hogs, cwt. Beef Cattle, ~~n.
$ I 7.36 $ I 3.96
19.50 I 15.70
I 18.00 20.40
15.50 20.90
Calve s, cwt.
$
22.30 25.90 26.50
Milk,Wholesale,mvt.: F,luid Mkt. Manuf. All
$
$ $ I 2.43
5.951 6.05
I 3.30 3.55
I Y5.90 !/6.00
!/5 .75
Turkeys, lb.
29.0 27.0
25.0
Chickens, per lb.
:F:'aJ;"lll Com'l Bro il.
. All
if. I 13.3
18.5 21.0 20.9
14.5 16.5 16.4
14.5 17.0 16.9
Eggs, doz.
,. 21.4
46.7 47.2
43.0
_~
0
i
y Revised. !/ Prelimbary Estimate.
.,.-.--..---
7.27 5.42 6.75
I1200.00 20.30
I 21.70
i 24.00
212.00 1235.00 15.40 15.40
I 22.80 23.30
I 28.40 J 27.90
1.60 14.4
I
!! !/4.1
II 27.1
11.4 21.5
16.7
1j
21.5 ?0.8
I
40.8
I 4.78
,-I 3.19
. 1/ 4.22
Y4.06
I. 24.9 .I.
. II 13 .1 17.2 I 16.6 I 35.4
23.6
I 13.3 17.3 I 16.8
33.8
,_..._._. __.. _ _' t... .
,i
_ ..... . _ ... _ _......_ ._ ._ ... _
! I PRICES PAID BY FARMERS FOR SELECTI:D FEEDS MAHCH 15, 1959 WITH COMPARISONS
.- .- -_. ---'--1 -T:-iSW~.r;l'TFeb715JMar. _._ ----,-------_._---_. .._..-. ---_. <lND OF PEED
GEORGIA Mar. 15IFeb
19~119 59
- - - :-. UNITEDSTATES- - - - - -
SJ
15
1959I
1958 1959 1959
--
Mixed Dairy Feed
Dollars Per 00 Pounds
All Under 29% Protein 165~ Protein 18'}~ Protein 20 Pro~ein
24% Protein
3.90 3.80 4.20 4.05 4.30
3 ,95 3 ,85 4 ,30
4 ,10 4 ,50
I
3.90 3.80 4.20 4.10 4.40
3.65 3.60 3.56 3.88 3.97
3.81 3.75 3.72
4.04 I
4.14
3.81 3.74
3.70
4.01 ;;'.10
High Protein Feeds Cottonseed Meal Soybean Meal Meat Sera!,
Grain By_Pr~ducts Bran Middlings Corn Meal
Poultry Feed Broiler Growing Mash Laying Mash Scratch Grains
3.80 3.85
3.25 3.45 3.45
5.10 4.80 4.30
4 ,10 4 ,05
.
3 ,;;'0 3 ,55 3 .30
5 .00 4 .75 4 .15
4.10 4.05
-
3.90 3.95 5.54
3.35 3.55 3.30
-
4!~.5_, 4.75 4.20
2.86 2.90 3.20
4.91 '-4.38
3.93
4.36 4.39
-
3.10 3.15 3.15
4.94 4.52 3.89
4.29
-4.25
3.08 3.13 3.17
4.90 4.49 3.89
Hay (Baled) lUfalfa All Other
l! As reported by feed dealers.
CI 52.00 ~~ .00 45.00
45.00
.00 35.00
30.70 30.30 29.90 29.70 28.20 27.90
! ,';)
.' ,GE ORG:IA GR OP ~EPORTING SERVICE:.
;
P:ogri'cult\lral'Extensioft Serv.ice
U., S. Department 'of A>gr:icu1:ture
lfniversity of Georgia and the State Department of Agriculture
Agricultural Marketing Service 319 Extension Bld~. , Athens,!, ~a.
G~I -E-O-R--G-i-A--C-H--IC--lc-'H--A-T-C--H-E-R--Y--R-E-P--O-R-T---------------------A-p--ri-l-8-,--J-9~$-9---: -" ---
.
I.
,
A~hens, Ga~, April 8 - ~ A total of 7, 173, 000 broiler chicks' we~e placed
with producers in Georgia during the week ending April 4, according to 'the 1 Geo.~gia 'Cr~p Reporting Serv~ce. This compares with the 7,440,000 .p1aced. the
previous' weekand is 11 percent more 'than the 6,468,000 placed the !?'ame week
last year.
;,
,
I
...
4
I
, Eggs 'set by Georgia hatcheries amounted to 9, 900, 000 compared with:
9, 9.7'~, 000 t~e previo~s week and is 11 pe'rcen~ m'ore than the 8, 9~4, .00; for-the
corresponding weC7k'last year.
!
.~
.
The majority of the prices paid for Georgia produced hatchipg eggs wre
rep9rte~ within a range of 40 to 55 cents with an average of 47 cents for all .'
hatching eggs and 46 cer.ts for eggs purchased at the farm from flocks with' '
hatchery owned cockerels. This compares with a range of 40 to 55 eents 1as.t week arid an average of 48 cents for both classifications of eggs last we~k. Most pri~es charged for chicks ~e~e...reported within a range of $6.00 to $8. 0:0 w~th an
~ve!"age. of $7.00 per hundr'ed c0r!?-pared with a range of $6.00 to $9. qo with:~n
average of $7. 50 per hundred last week. The average prices 1asf year were' 82
eents for eggs and $14.25 for chicks.
.,
Weighted average prices from the Federal-State Market News Ser'vic~,for
broilers during the week ending April 4 are as follows: Georgia broiler.s ~.j/4-
33/4 pounds, at farms 15.91; FOB plants 16.40.
.;' . ,
.. - .
GECRGIA, EGGS ..
SET, HATCHINGS, BROILER TYPE
AND
CHICK
PLACEMENTS EGG TYF,E
Week Ending:
--
,
Eggs Set !!
1958
19-59 . 1959 %
-
of 1958
Chicks Placed for Broilers in Georgia
1958
1959
1959 0/0 of 1958
Eggs ~hickj;
,Set Hatched "
1959 1959'~'
,I .
..
Thou. Thou. percentl Thou.
,
".
:Jan'; 3f' 8,278 8, 390 . 101 6, 142
:Feb. 7 . 8,433 8,854
105 6, 165
;Feb.14
8,411 9, 175
109 6, 108
Feb, a1
i~b: i8
'
.,
.
8,3029,615 8,291 .. 10', 082
' ,116 122 '
6,132 6,244
Mar. 7 !Ma;r.1~ ..
8,003 10, 143 8,'474 10,030
127 6,307 118 6,015
:Mar.2l: .8,586 9,925 ' 116 5,840
Thou.
5,943 6,233 6,270 6,.419 6,626 6,888 7,094 7,305
Perce'nt
'. .
97. 101' 103 105 106 .
109 118 125
Thou. ThQu~
"
713 453 663 '5,71' 653 545. 73~. 590 746 587: ' 807 ' 530.. 864 .. 670. --.' 92.3 '702'.~
iMar.28: ,Apr. 4 ,
8,'733 8,,954
9,979
114
I 9,900
III
,
6,103 7,440 6,468 7, 173
122'
III
I; 793 ! 764 . ~ 706 : 706:
i
"
!.! )nc~~des eggs set by hatcheries producing chicks for hatchery supply flocks.
..
'I
, ,ARCH;IE LANGLEY
.Agricultur~l ~tatistician In Charge
.
W. A. WAGNE;R Agricultural Statisti'c;ian
UNIVERSITY OF GEORGIA
, .. -.: ....,
.
.'I
\',
".' ,-.,
,
.J
..... ,.,
APR- q '59
L1eAAftiES
,.. " .~
J'
3TATE
Maine Connecticut Pennsylvania Indiana Illinois Missouri Delaware Maryland Virginia West Virginia North Carolina South Carolina GEORGIA Florida Alabama Mississippi Arkansas Louisiana Texas VTashington Cregon Califorcia
TOTAL 1959
TOTAL 1958
1959 '/0 of 1958
*Revised..
Mar.
21
EGGS S>.J;.J;,T AND CHICKS PLACED IN COMMERCIAL AREAS , BY WEEKS - 1959
-
,
:.week El1ding
"
,,
.,
-
.
Mar.
Apr..
Jan.
Feb. ' Feb.
Feb .. ~""eb;
Mar.
28
4
31
7 '. " : t4,
21
28
7
"
"
"
Mar.,
14
EGGS SET - THOUSANDS
CHICKS PLACED - THOUSANDS,
1,487 I, 113 1,464
2,386 410
2,210 2, 126 2, 800 2,463
365 4,286
616 9,925
405 . 4, 545 " 3; 295 '4,675 " 801
3,005 421 485
1, 772
.1, 565 I, 107 1,370'
2, 183 414
2,075 2,065 2, 606 2,427
335 4,279
603
9,979 382
4,601
3,262 4,725
791' ,
3,235 478 ,469 '
: I, 731
1,629 'I, 131 1,412
1,979 363
1,863 2,,108
2,494 2,458
3534,235
600
9,900
393 4,680
3,375 4, 590
829 3; l79
455 491 " I, 711
1,280 1,286 1,272
576 , 648
668
709
778
724
639
613
744
181
120
130
738
800
848
2, III , 1,837 2,063
1,741 1,901 1,776
J, ,101 1,094 I, 168
532
572
580
~,846 2,932 3,084
316
363
404
5,943 6,233 6,270
178
236
205
2,964 3,104 3,263
2,059 2, 04-6 2, 109
3, 172 3,044 3,276
, 433
39'6
412
2,136 2, 180*, 2,21~
,375
339
382
205
240
215
1, 108 1,07'4 1, 163
1,229 606 737
877
16~
865 1,769 1,967 1, 129
586 3,070
373
6,419
239 3,202
.2,302 3,377
511 2,288*
393 234 1,130
I, 154 I, 194
601
524*
843
835
816
765
176
197
,8,29.' :" 849
1,927 1,9'62
1,814 1,941
1,269, 1, 295
700
680
3,214 3, .143
360
357
6,626 6,888
246
263
3,228 3,278
2,308 2,469
3,392 3,580
509
450
2,267* 2, 471'
343
345
283 ' , 267
I, 164 I, '176
1,221* 596'
962 783 197 821 I, 851 2,046 1,326 625 3, 164 437
7,094 232
3,708
2,408 3,713
575 2.,419
363 301
1,,068
-.
-
Mar.:'
21
1,243 519 787 873 154 883
2,051 1,886 I, 219
731 3,384
377 7,305
239 3,514 2, 593 3,822
494 2,271
356 257 1, 165
P-age 2
-
. .'
Mar;. Ap~,.
28 ' " 4
- '.
-.
1,231
496 690
961 183 845 1,931 12,084 :1,273
678 3,376'
319 7,440
216 3,661
2,609 3, 761
505 2,475
350 246
1,213
I, 229 597 985 877
198 885 I, 914 ' 2, 021 1,356 637 3,307 413
7, 173
264 3, 712
2, 540 3,745
559 2, 558
232 268
1,207
51, 055 45,493
112
I
50, 688: '50; 228
.4..'.6
,.
,
057
,'
110
.
"-
-:
"-
46, 808
: 1()'7
' ..
,
, 31,343
29,477
.,
'106
31,837* 32,97,0
29,640 29,975
I 107 '" ':
"
UO
33,471*
34,069*
34,929*
35, 910* -
36, 123 ,
.
36,60-3
3'6,677
30,777 30,,' 808 . 3'0,,943 29" 863 2,9,/1.91' 30,134 31, 793
-
:-'1. 0'9 ,-
III -, )
- ': ,.
'...
113-
."
"
"
( '.
,.
120
;
:
I
.;. 1.~3:1
- "
:
'. :
,I
."
.-
. . .121 ,.
115
.19~ CGIE(Q)~(GllA ceIRi Ip>J{lE.)~ 1rnNCG IE~VllceJE (3 It' 3
CO)
tS: I9 ~
r f,......,.
1'3
AGRICUI.TURAI. UNIVERSITY OF
GEEXOTERNGSIAIO~NNSDETRHVEICE
~lrY fu I.r OF CEO!\GtA
U. S. DEPARTMENT OF AGRICUL.TURE AGRICULTURAL MAHKETING SERVICE
STATE OEPARTMENT OF AGRICUL.TURE
APR 1 l) '59
319 EXTEN:iION BLDG., ATHENS, GA.
Athens, Georgia
. LlBPARI-,S
April 13, 1959
" QENERAL CROP REPORT AS OF APRIL 1, 1959
GEORGIA: Freguent rains during March delayed land preparation and planting
operations throughout most of the State. Pfogress in transplanting tobacco and planting of corn, cotton, and other spring planted crops is well be~ hind usual schedule for this time of year,
Ample moisture supplies and above normal temperatures during March were favorable for growth of small grains and pastures. Pasture condition on April 1 was well above last year and slightly above average for the date. The condition of wheat and rye was also well above a year ago and slightly above average
. Prospects for peaches in Georgia on April, 1 were nearly as good as a year
ago. Although a forecast of production will not be made until the 11th of next
month, the average condition of this yearls crop as reported by growers on
April 1 has been exceeded only three times in the last 20 years. The current con-
dition of 84 percent of normal is one point below the record high c0ndition for
the date reported in 1945, 1953, and 1958. 1'otal production depends not only on
condition but also on the number of trees of bearing age which changes from year
to year.
'
Georgia's 1959 wheat c~op is expected to be more than 500,000 bushels above last year's short crop. Wheat conditions on April 1 indicated a crop of 2,163,000
bushels which would be 32 percent above production last year and three percent above average.
Milk production in GeQrgia during March is esti.1l1ated at 99 million pounds,
an increas~ of Bmillion po~nds over last month. Hens on Georgia farms laid
an esti.1l1ated 139 million eggs during Harch. The average number of layers on hand
during the month totaled 7, 446, 000, a decline of 98,,000 from the previous month,
but ~he highest average number of record for the month of March.
PEACHES - SOUTHERN STATES: TheApril.l condition of peaches in the Southern States,
reported at 84 percent, was one point below the near-'
record figur.e, of last April but 24 pointG above average for that date. The con-
dition was reported slightly better than last year in South Carolina, Alabama,
and Mississippi; the same in Louisiana; slightly'below last year in North Caro-
lina and Georgia; and significantly lower in Arkansas, Oklahoma, and Texas. Frost
damage to'Apri1 1 was ~eport~d light in all States except North Carolina. The
87 percent condition reported for that State does not reflect fully the damage
from the low temperatures of March 28. In South Carolina most varieti'es 1-Jere
past full bloom by April 1. Slight frost damage ...ras reported in Orangeburg County.
Excessive rains have hampered spraying 9perations in both 'South Carolina and
Gecrgia. In both of these States the heavY set will require thinning in order to
secure desired fruit size. In Alabama practically all varieties had bloomed by
April'l with a minimum of cold damage. Arkansas reported a heavY bloom and
amlndant moisture supplies. In ~ouisiana a light frost 'on March 13 apparently
caused no losses and a hea~J thinning .job is in pr~5pect. Light March freezes.
thinned out some of the buds in Oklahoma but Apri1; 1 prospects,were still substan-
tially above average. In Texas low tomperatures Garly in March .and again on
March 21 -resulted .in only very ligl').t damage.'
'
,:
P.EACH CONDITION AS OF' APRIL 1 BY STATES (Percent)
, State: :Av'erage 19h8-57:
1956
:
'1957
.
1958 :
:
N.C.
66
57
88
89
.C. :
61
50
83
83
3a.
:
Ala.
61 56
42 50
71
85
78
83
:1iss. :
52
53
47
67
.'.rk. :
61
79
86
94
..Ja.
:kla.
59 52
48 64
80
81
77
84
'.:'cxas
46
43
64
82
-
3tates:
60
53
78
85
1959
87 86 8!+ 84 72 88 81 7h 74
8L~
ARCHIE LA.NGLEY Agrir.ultural Statistician In Charge
CARL O. DOESCHER Agricultural Statistician
UNITED STATES - GENERA.L CROP REPORT AS OF APRIL 1, 1959
Winter wheat prospects have improved since December in the heavy producing Central Great Plains'which outweigh poorer prospects in some other' areas. A' cool, wet March hampered farming operations over the eastern third of the count~J and in the Central Plains, but open weather permitted rapid progress in the South~ west, and field work started earlier than usual in the north~n Plains. Spring vegetable production is expected to be about the same as last year. Citrus fruit prospects were maintained during March and other fruits generally escaped any serious freeze damage. Western mountain snowpack is still light in southern portions, but resevoir storage supplies are adequate. Feed grain stocks remaining on farms on April 1 were 8 percent above a year earlier, and farm-stored food grains were over a half larger than a year ago.
Food grain stocks on farms were about 60 percent larger than a year earlier and a fourth above average. Wheat stocks show an increase of 60 perca~t over last year following the record 1958 production, and nearly a fourth more rye was farm-stored on April 1 than a year earlier. An unequalled volume of soybeans was still farm-stored on April 1-- 6 percent above last April's record and nearly double the average. Flaxseed stocks were double those on April 1, 1958 and the fourth largest of record for the date.
Farm stocks of feed grains on April I were 8 percent above last year in total tonnage and nearly one-third above average. Compared to a year earlier corn stocks were 8 percent higher,. sorghum up 5 percent, oats up 9 percent, and barley up 1 percent. Bountiful harvests last year provided ample feed supplies to maintain the necessary feeding schedules for the increased livestock numbers during the winter which was long and relatively severe in many sections of the Nation.
WINTER WHLAT: The fall seeded wheat crop fought through a relatively hard win~er but emerged with some minor gains. Conditions on April I
indicated a crop of 966 million bushels. This would be 9 million bushols above the December 1 forecast, 18 percent less than the record 1958 crop of 1,180 million bushols but 19 percent a bove average. Increases since December 1 have been largely confined to the Central Great Plains. Such increases more than offset reduced production prospects in the oastern Corn Belt and the Southwest.
MILK PRODUCTION: flilk cows on farms produced an estimated 10,667 million pounds of milk in March. This was 1 percent less than in' the same
month last year, but 6 percent more than the March 1948-57 average. Milk production advanced soasonal1y about as rapidly as in 1958, but about 3 percent slower than usual from February to March. Totc~ output in March was sufficient to provide 1.95 pounds of milk daily to each person in the United States. This compared with 2.00 pounds in March a year earlier and the 10-year average for the month of 2.05 pounds. Milk production in tho first 3 months totaled 29.8 billion pounds comparod with 29.9 billion pounds in January-March period last year.
POULTRY AND EGG PRODUCTION: Farm flocks laid 5,952 million eggs' during March-9 percent more then in March 1958. All regions
showed increases ,over last yoex. Tho sharp increase in egg production is attributed to several factors. This year favorable weather prevailed over most of the country in contrast to the vary unfavorable weather of February and'rfurch last year. Also tho proportion of pullets in the laying flock is back to normal and much higher than it was a year ago when, in an effort to maintain flock numbers, farmers retained a larger numbor of hons than usual. The trend continues toward larger, well-managed flocks and improvGd laying strains. Total egg production January through March 1959 was 6 percent above the samo period last year
. "
,q
-- ......... -"'-
" -I ~
6"
CGIE(Q)~GllA ce~(Q)1P ~IEl?'((J)If~JrllNG ~IE~VllCIE
AGRICULTURAL EXTENSION SERVICE UNIVERSITY OF GEORGIA AND THE S.TATE OEPAR!fo1ENT QF A,GRIClJl':.ToUPtE
-.'
"'
U, S. DEPARTMENT OF AGRICULTURE
:' A1 AGRICUL rURAL MAt~KETING SERVICE '~ '~~:gt;:~rr',EtF'~~ BL~~~. HENS GA. '.:
!,thens, Ge~rgia'
~
.
," ':.'
.:......
" ... ",
:'
,:,' {... ...
, V'SGBTABL1!S' FOR FR}~F(}1.A~KET
April 14, 1959.!.
R ,1-
UNITED $T/.TF"s:
,,',
Spring
,'.
'., "; ~
.
,.... ~,
...'.;.Apr'il-"l;
1959 .,
,.~
.
vegethble 'production this y'ear
i:", i''
... ,'I .,1-:_
is '''expe~te,d." to
total
cibout,
. ",
..... , the pan'1e as ilast. y~ar an<:). .slightly' ab'dve' average,. tho, Crop 'Re- .,
porting .Board announced -today. 'Estimated prociu'ction of vegetables ~hich rri-ak~ 1;lP
about thre.e ...fourths ()f the spring' 'crop, excluding melons" is one percent .bo;Lo'
the 1958" C.r')P "and two percG11t abdve avora'go. Crops with substantially smaller
production than last year are t'omatoc's, onions, cucumbers, and snap b'C~il;;~' Less
sweet corn, green peppcrs, beots arid eggplant are also 'forccnst. Thosc reauc-
tions .are p:artly offset by a large incTEJase'in celery. More letthc'o;, \cabbage, .
,'cauliflower, broccoli, spinach, green peas, carrots and' shaJ,lo'):.s i~ also expected.
In addition to those crops for which forec~sts have bean made, proliminary acre-
age estimptes have been pr.eparod for a number of other spring c~ops. The sp~ing
acr6agEJ estimated to date is 2 percent less than in, 1958. These' crops usually,.',
account for about four-fifths of the total spring acri:Jage. ' ':
'
hbove normal t&mperaturGs advanced the harvest o~ most vogetablcs in Cali-
fornia one to three weeks and bunching of supplies of'many crops'resultod . Cori~
sequently, ,harvest of somo crops is nearing completion and overall production is
ata s64sonal low. Marketings are expectod to gradually increase as harvest of
major. I?pring crop,s get underway. Harm weather "alGO speeded m~turity of 1110st'
crops in JuoizoI;la and TLxas. Lottuce Shipments 'from "'.rizona contin~e {wavy. :Blight
has been quite troub~esomc to Te~as, oniohs, carro;ts and tomatoes, but tho rec-ent
dry weathr has .brought about' improved"conditions' of th~se crops. : Some acreage losses 'ocourred in Florida as the result of heaVy ,rains. Crops in "th~ harve.sping
stage gene:rally suffered'most. Planting of tho :spring cr9ps was also dolayed~ ..'
HowevfJr, crops rospondDd well to the dryer weathor near the, end', of the ~onth~.
Heavy rains and cold woathcr'~n tho othor Southeastern States havo dcl~yod $~raw
berry. harvest. These conditions have also r,etarded devtlopment and 'delayed"
plantings,of other spring vugctables. Planting of spring vegetables was ~lso' de-
. layed
in
the
Nort1'1oastcrn
St3tes
because
of
h.
c
a
'
v
y
r
.
a
i
n
s
and,snQw.,
SNf,P 'BEJ~NS: Tho acreage of mid:" spring ,snap beans is 'estimated a:t '14,459 aeres"
'1 '
6 percent 'below las:t year and about one-fbur-th be1'0W' avorag'e. ' .:";'
Compared with last year, 811 States have"less acreage, except Louisiana. " .'-:
,
"
~
",
:; I
, .. "
'
ChBlli,GE: 'Production from the early spri~g crop is oxpected tbt~t~l 2,224,000
cwt., 7 percent mor8 than last year but 9 percent below average. De-
crGases from tho 1958 production in Georgia and Mississippi arc more than offset
by oxpected increases in South Carolina, Louisiana and California. In South
Garolina, cool Vleath8r in Fubruary and excessive rains in March causod some
damage but the crop is generally in good condition. It has greonod up well and
harvest is expected to start tho latter part of April. Unfavorable weather has
placed the Georgia crop two to three weeks behind schedule. Heavy rains have
~Gached fertilizur and prevGnted growers from getting into the fields. Harvest
~as becn very limit<;d to date. PGak harvcst is expected in latG May. Cold, Het
n~ather in Mississippi has retarded growth, but hoads arc beginning to form.
\ith favorable growing conditions during J..pril, hQrvest is oxpected to start
aOQut May 1. The Louisiana crop made good progress during March. In California,
cOuditions have been favorable for harvGst and supplies arc expected to continue
at aoout present lovels during most of J..pril.
"
-2-
LETTUCE: . Early spring production is now forecast at 7,337,000 cwt., 5 percent
above last year and more than a fourth above average. In North and South Carolina, cold, wet weather has retarded growth. However, the crop is in generally good condition. Light harvest of early fields in Georgia is expected to start the second week in April. Above average quality and yields are expected.
In New Mexico, cool temperatures have slowed development and the crop is 10 days
to 2 weeks late. High winds the latter part of March destroyed some acreage in Dona Ana County and the Chavez-Eddy area. Peak ship~ents are expected about midMay from Dona Ana County and about a week later from the Chavez-Eddy area. In Arizona, shipments from the Salt River Valley are hea~/ but the Theba deal is nearing completion.. Harvest in the Aguila-Salome area should be underway by
April 15 and is expected to start in the Wilcox-Bowie area early in M~. Wind,
birds and rabbits cave caused some d~lage at Wilcox-Bowie but condition and quality are generally good. The California spring crop is in generally good condition. Harvest has begun in the Kern County, Santa Maria-San Luis Obispo and Oxnard areas. ~upplies from the Santa Maria-~an Luis Obispo area s10uld increase during April. The important Salinas-Watsonville area is expected to start harvest early in April. Harvest in the Brentwood-Patterson district should be underway before
~pril 15. Total supplies are expected to remain light until the latter part of
~pril.
ONIONS: The late spring onion acreage is placed at 12,400 acres, 18 percent below the acreage harvested last year and 16 percent below average. Cali-
fornia is the only St;Jtc in the group having a larger acreage than in 1958. In
North Carolina, acreage for harvest is less than half of last year. This acreage usually provides production beginning in May. The Georgia acreage is three-fourths of last year. The excessive rains in March caused no damage. Harvest is expected to start in early May reaching a peak late in the month. North Texas growers did not plant the acreage they intended to because of unfavorable weather conditions early in the planting season and a shortage of plants later on. ~crGage for harvest is two-thirds of last year. Early planted fields made slow growth because of cool weather and high winds caused some tip burn . Plants are in fairly good condition but additional surface moisture would be beneficial.
In Arizona, growers planted more than intended but 7 percent less than last year.
Harvest started at Yuma about April 1. Acreage for harvest in California is 11 percent over last year. Increases arc reported in Stockton, Perris-Hemet and Los ll.ngcles areas. Harvest started in the Imperial Valley late in March (much earlier than usual) and will be in volume late in April. Harvest is expected to start in the Stockton district in IGte Ilpril but it will be wall into May before appreciable supplies are available. 1.11 tho acreage in the Kern district is in very good condition.
.. ,.
_3 _
AC~AGE AND ESTlMATED PRODUCTION REPORTED TO DATE, 1959 WITH CCMPARISONS
CROP
AND STATE
ACREAGE FOR HARVEST
:Average: 1958 :
:1949_57 :
I
Irid. 1959
: YJELD PER ACRE
: Av. : 1958 : Irid.
:49_57:
I 1959
I PRODUCTICN
I
:Average: 19s8 iInd
,i949~57:
:1959
SNAP BEANS
Mid-Spring: South Carolina Georgia Alabama. Mississippi Louisiana
Group Total
C.ABBAGE y
Early Spring: South Carolina Georgia Alabama Mississippi Louisiana California
Group Total
y ONIONS
La.te Spring: North Carolina Georgia Louisiana Texas llrizona Ca.1ifornia
Group Total
- Acres _
I 7,720 : 4,890 : 1,200 : 2,780 : 3,360
: 19,940
:
:
5,800 3,900
850 1,900 3,000
15,450
: 2,090 : 5,340 I 1,000 : 4,360 : 3,960 I 2,910
:. :9 t130
I
:
2,400 4,200
900 2,900 3,000 3,600
17,000
I
800
: 1,000
: 190
: 7,690
I 1,280
: 4,470
: 14,710
2,300
-800
4,700 2,700 4,700
15,200
_ Cwt. _
5,600 20 20 3,300 17 19
750 21 23 1,700 24 28 3,100 24 28 14,450 21 22
2,500 139 85
145
3,500 112 100
100
900 107 lOS
105
2,000 105 85
120
3,400 91 100
95
3,800 217 225
225
16,100 125 122
138
1,000 75 75
- - 600 85 90 47 3,100 32 25 2,500 313 270 5,200 291 265
12,400 139 154
- 1,000 crwt. _
157 116 83 74 26 20 May 11 65 53 81 84
412 347
288 204 599 420 115 94 447 246 366 300 635 810
2,451 2,074
362 350
94 240 323 855
2,224
60 172
85 72 9
253 118
397 729 1,259 1,246
May 11
2,010 2,337
!/ Includes processing.
ARCHJE IJlNGLEY Agricultural Statistician In Charge
L. H. HARRIS, JR. Vegetable Crop Estimator
".
;"
,.
i
., ~ ~ G!EORGIA .C.ROP
A~ri~u1tq.l-a1):;xt~n~.i,~nSe1"vic~
niversity of Geprgia and the S__ta_t_e_D_e_p_~_l_r_t_m_e_nJ~ of Agriculture_
REPOR.TINq. SERVICE .. I . U .. 5" Department of AgricI:i1tur~.
Agricultural Marketing Service;. 319 Extension Bldg. , Athens, G~..
GEORGIA CHICK HATCHERy'R
" ...."
April 15, 1959
,
l
Athens, Ga., April 15 -- A total of 7, 382~ 0'00 broiler chicks were p~aced,
with producers in Georgia during the week ending April 11, according to tHe I
Geor.gia .Crop Reporting Service. This compares wi.th. the 7, 173, '000 ;p1ace~ the;
prev'i.Qus yveek and is 10' per.cent,more than the 6, 69~, ,000 .p1aced the same Weekj
last year. '
.
. . ":, I i
.'
.,'
,.:
' .\
l
I
Eggs set by Georgia hatcheries' amounted to 9, 710, 000 compared with
9,90.0, oa.o t\1:'e previous w.e,ek and is 6 percent more than the 9, 141, 000 for :,the
corr'esp<?hdiI1g week last year.
Th'e major'ity of the prices paid for Georgia produc,c.d ha.tching eggs were
reportedwithin a range (')f 40 to 55 cents with an average of 46 cents for all
hatdiing'eggs and 44 cent~ [0;<" eggs. purchas'ed at the farm from flo.cks with
hatchery owned cockerels. This compares with a. range of 40 to 55 ~ent.s and :'
an average of 47 cents for all hatching eggs and' 46 cents for eggs purchased at t
the farm, from flocks w~th hatchery owned cockerels 1aGt week. Most prices
charged for chicks were' reported within a rang~ of $6'~ 00 to .$8.00 with an aver.-
age of $7.00 per hundred compared with a range of $6. 00 to $8. 00 with an aver?-ge
of $7.00 per hundred last week. The average prices last year w~re 82 cents fqr
eggs and :J;l4. 25,for chicks.
,
,.
.
': Weighted average prices from the 'Federal-State Market News Serviqe 0*':
broilers during the week ending April 11 are as follows: Georgia broiler.s2 3/4 '-
3 3/4 pounds, at farms 15. 75~, FOB plants 16. 65~.
,"
GEORGIA EGGS SET, HATCHINGS, AND' CH!CK PLACEME:NTS' i
Week Ending
BROiLER TYPE
Eggs Set 1/
Chicks Placed for Broiler s in Georgia,
EGG"TY.PE 'Egg~s Chicks : Se~ I-!at:ched..
1958
1959
1959 70 of 1958
1958
. 1959
195.9. J'O of 1958
, 1959,:' i959,:.
Thou. Thou. ercent Thou. Thou. IPercent : Thou. Thou,
Feb . :... 7 .' 8,433 ,8,854 . 105 0; 165 6,233
:~o 1: '
663 .. ' S1.1
Feb. 14 '. 8,411
Feb.21:~ 8,302
F_eb~ 2.~; .. c..... ~k291
Mar. 7
8, 003
9, 175
9,615
.,lQ, 082
10, 143
109 116 122
127
6, 108 6, 132 6, 244
6, 307
6, 270 6,419 6,626 6,888
103
653
105
73'2
'':' 'i10096'"
.... ,
746 807
5.45 '''' . 590 .
587
530
Mar.14
8,474 10,030
118 6,015 7,094
118
864 670
Mar.21 Mar',28 Apr: . 4 Apr. 11
8,586 9,925
116 5,840 7,305
125
~, 733 9,979. 114 6; 103 7,440
liZ
923 702
.\ \
793 , 764
8,954 9,900
Ill' 6,468 7',.1 7 3
'111
70'6 - .706
9, 141
9,710
106 6,695
I
!
7,,'382 II 11'0 . ,I 685 723
l-/ IIfcluc;le s egg:s set by hatcherie s producing chi<;:ks for. hatc.herr supply flocks: ~:
-
.
I
.
I
ARCHIE ;LANGLE'Y. .-
. W, A.. WAGNER
.
Agricultural Statistician In Charge
A,gricu1tural: S,tati's.tician' ..
I
t
-'
.
.
, ..
"
I ..~
'.
..' ...... ",:." ,
,.
... 1 ,-
STATE
EGGS SET AND CHICKS PLACED IN COMMERCIAL AREAS, BY WEEKS - 1959
Week Ending
Mar. 28
Apr. 4
Apr. 11
EGGS SET - THOUSANDS
Feb. 7
,
.r~eb.
14
Feb. 21
Feb. 28
Mar. 7
Mar. 14
Mar. 21
Mar. 28
CHICKS PLACED - THOUSANDS'
Page 2
Apr. 4
Apr. 11
Maine Connecticut Pe'l.nsylvania Indiana Illinois Missouri Delaware Maryland Virginia West Virginia North Carolina South Carolina GEORGIA
Florida Alabama Mississippi P.r kansas Louisiana Texas Wa shington Oregon Cal ifornia
1,565 1, 107 1, 370 2, 183
414 2,075 2,065 2,606 2,427
335 4,279
603
9.979
382
'.
,4.601 3,262
- 4,725
797
3,235
478 469 1, 731
1,629 1, 131 1,412
1,979 363
I, 863 2, 108 2,494 2,458
353 4, 2~,5
600 9,900
393 4.680 3,375 4, 590
829 3, 179
455 491 1,711
1, 517 1, 178 1,412 2,201
348 1,933 2,099 2,408 2,461
363 4, 157
489 9,710
331 4,494 3,301 4,601
826 3, 185
452 447 1, 616
1,286 648 778 613 120 800
1, 837 . 1, 902
1,094 572
2,932 363
6,233
236 3, 104 2,046 3,044
396 2, 180
339 240 1.074
1,272 668 724 744 130 848
2,063 1, 776 1, 168
580 3,084
404 6. 270
205 3,263 2, 109 3,276
412 2,214
382 215 1, 163
1,229 606 737 877 168 865
1,769 1, 967 1, 129
586 3,070
373 6.419
239 3, 202
2,~02
3,377 511
2,288
393 234 1, 130
1, 154 601 843 816 li6 829
1,927 1,814
1,~69
700 3,214
360 6,626
246
3,228 2,308
3,392 509
2,267
343 283 1, 164
1, 194 524 835 765 197 849
1,962 1,941 1,295
630 3, 143
357 6,888
263 3,278 2,469
3, 580 450
2,471
345 267 1. 176
1,221 596 962 783 197 821
I, 851 2,046 1,326
625 3, 164
437 7,094
232 3,708 2,408
3,713 575
2,419
363 301 1,068
1,243 519 787 873 154 883
2,051 1,886 1,219
731 3,384
377 7,305
239 3,514 2, 593
3,822 494
2,271
356 257 1. 165
1, 231
496 690 961 183 845 1,931 2,084 1,273
678 3,376
379 7,440
216 3,661 2,609
3,761 505
2,475
350 246 1,213
1,229
597
985 877 198 885 1,914 2,021 1,356 637 3,307 413 7, 173
264 3,712 2, 540
3,745 559
2, 558
332 268 1,2(n
1, 187 578 865
911 182 882 1,833 1,904 1,247 676 3,332 375 7,382
214 3,640 2,657
3,618 488
2,473
329 280 1,245
TOTAL 1959 TOTA..L 1958
1959 % ,of 1958
50,688 46,057
110
50,228 46, 808
107
49. 529 . 47.462
104
31, 837 32,970 33,471 34,069 34.929 35.910 36. 123 36,603 36,677 36.298
29,640 29.975 30.777 30.808 30.943 29. 863 29,291 30. 134 31.793 33. 156
107
110
109
III
113
120
123
121
115
109
,GEORGIA CROP .gricultural Extension Ser.vice _ University of Georgia and the State Department of ~gricultqre
GEORGIA CHICK HATCHER Y REPOR
SER VICE
.'
Department of Agriculture
- -'- - - - - - - - -.- - - - - - - - - - "'!- - - --
A?ril 22, 1959
Athen's, Ga., April 22 - - A total of 7,477,1)1)0"broiler chicks were placed with produc~rs in Georgia dll.ring the week ending April 18, according to the Georgia Crop Reporting Service. This compares with the 7,382,000 placed the previous week and is 11 percent more than the 6. 709. 000 placed the same week last year.
Egg.s setby Georgia hatcheries amounted to 9.778. 000 compared wit4
9, 710, 000 the' previous week and is 6 percent more than the 9. 265, 000 for the
corresponding week last year.
.
The majority of the prices paid for Georgia produced hatching eggs were reported within a range of 35 to 52 cents with an average of 45 cents for all hatching eggf3 and 43 cents for eggs purchased at the farm from flocks with hatchery owned cockerels. Last week the range was from 40 to 55 cents and an average of 46 cents for all hatching eggs and 44 cents for eggs purchased at the farm from flocks with hatchery owned cockerels. Most prices charged for chicks were reported within a range of $5. 00 to $8.00 with an average of $6. 75 per hundred compared with a range of $6.00 to $8.00 with an average of $7.00 per hundred last week. The average prices last year were 82 cents for eggs and $14.25 for chicks ..
Weighted average prices from theFederal-State Market News Service for broilers dllring the week ending April 18 are as follows: Georgia broilers 2 3/4 ':' 3 3/4 pounds. at farms. 15. 35f; FOB plants. 16. OOf.
Week Ending
GEORGIA EGGS SET. HATCHINGS. AND CHICK PLACEMENTS
i
BROILER TYPE
Eggs Set'!!
Chicks Placed for Broilers in Geor ia
II EGG TYPE Eggs Chicks : Set Hatched
1958
1959
1 1959 %
of 1958
1958
I 1959
i 1959 %
of 1958
1959 1959
Thou. Thou. !Percent Thou. Thou. Percent Thou. Thou.
I
Feb. 14 Feb.21 Feb. 28 Mar. 7 Mar.14 Mar.21 Mar.28 Apr. 4 Apr. 11 Apr. 18
8,411 8,302 8,291 8,003 8,474 8, 586 8,733 8.954 9. 141 9,265
9, 175 9,615 10,082 10, 143 10,030
9.925 9,979 9,900 9,710
9,778
I 109 116 122 127 118 116 114 111 106 106
:
I 6. 108 6, 132 6,244 6,307 6,015 5,840 6, 103 6,468
6,695 6,709
6,270
103
653 545
6.419
105
732 590
6,626
106
746 587
6.888 I 109
7,094
118
807 530 864 670
I 7,305
125
7,440
122
923 702 793 764
7. 173 I III
706 706
7,382
I
I
110
685 723
I
7.477 I III
725 669
!
-/
1/
Includes eggs set by hatcheries ARCillE LANGLEY
prod.uci.ng
chicks
for
hatchery W. A.
sllpply flocks. WAGNER
Agr',j cultural Statistician In Charge
Agricultural Statistician
'.
STATE
Maine
Connecticut
Pennsylvania
Indiana
Illinois
Missouri
Delaware
Maryland
Virginia
West Virginia
North Carolina
South Carolina
GEORGIA
Florida Alabama
.
Mississip~i
Arkansas
Louisiana
Texas
Washington
Oregon
California
TOT AL 1959 TOTAL 1958
1959 % of 1958
Apr.
4
- - EGGS SET AND CHICKS PLACED IN COMMERCIAL AREAS, BY WEEKS .
1959
Week Ending
:
, ..
,
Apr. '11
Apr. '.
18
Feb.
' '14
'Feb.
~.~.
Feb.
28
Mar.
7
Mar.
14
Mar.
21
Mar.
28'
Apr.
4
p a,2e
Apr.
n
Apr.
18
EGGS SE T ~ THOUSANDS
1, 629 1, 131 1,412 1,979
363 1,863 2, 108 2,494 2,458
353 4,235
600 9,900
393 4,680 3,375 4, 590
829 3, 179
455 491 1,711
I, 517 'I, 178 1,412 2,201
348 I, 933 2,099 2,408 2,461
363' 4, 157
489 9,710
331
4,494 3,301 4,601
826 3, 185
452 447 I, 616
..
1,'601" I, 124 1,277 2,062
G85 1,730 2, 136 2, 577 2, 504
341 4, 197
525 9,77,8
364 4,411 3, 158 4,310
6573,OiO
405 451 1,459
50,228 49,529 48,362
46,808 107
47~ 462,
104
:
48,47~
100
'.
I
CHICKS PLACED - THOUSANDS
1,272 1,229
66S-
606
724
737
,744
877
..
130
168
-. ,,848'
865
2,063 1, 769
" 1,776 1,967
" I, 168 1, 129 580 - 586
3,084 3,070
404'
373
6,270" '6,419
205
3,26) 2, 109
3.. 276 412
2,214 382 215
-I, 163
.239
3,Z.C2
2,302
3,377
511 2,288
393 234 1, 130
1, 154 601 843
' 816
176 829 f,927 I, 814 1,269 700 3,214 360 6,626
246 3,228 2;,308 '
3,392 509
2,267 343 283
I, 164
I, 194 524 835 765 197 849
1,962 1,941 1,295 ' 680
3, 143 ' 357
6,888
263 3,278 2,469 3,580
450 2,471
345 267 1, 176
I, 221 596 962 783
~97
'821 I, 851 ,2,046 1, 326
625 3;164
437 7,09.4
?,32
3,708 2,408
3,713 575
2,419' 363 301
I, 06-8
1, 243 519 787 873
. 154
883 2, 051. 1,886 I, 219
731 3,384
377 7,305
239' 3, 514 2; 593 3;822
494 2,271
356 257 I, 165
I, 231 496 690 961 183 845
1,931 2,084 1,273
678 3,376
379 7,440
216
3.,661 2,609 3,761
505 2,475
350 246 I, 213
1, 2,29 597
,,985
877 198 885 1,914 2,021 1,356 637 3,307
413 7, 173
'264
3,712 2,540 3,745
' 559 2, 558,
232 268 1,207
' I, 187 578 ' 865 911 182 882
1,833 1,904 1,247
676 ' 3; 332
375 7,382
'214
3;640 2,657 3,618
488 2,473
329 280 1,245
I; 21'5 598 927 871 21-8 748
1,985 1,7?'9 1,072
681 3,287
390 7,477
220 3,600 '2,633 3,625
sob
2;600 326 279
I, 173
32,970 33,471 34,069 34,929 35,910 36; 123 36,60~ 36,677' 36,298 36, fS4
29,975 '30, 777 30,808 30.943 29,863 29,291 30,134' 31,793 33, 156 3.3, 291
110
109
111
113-
120
123 ' 121
115
109
-109
,
3(5
GEo)~GllA C~((J)IP ~E1P(Q)~illlWG JEJRiVllCC[
AGRICULTURAL EXTENSION SERVICE UNIVERSITY OF GEORGIA AND THE STATE DEPARTMENT OF AGRICULTURE
Ath~ns, Georgia
U. S. DEPARTMENT OF AGRICULTURE AGRICULTURAI. MARKETING SERVICE 319 EXTENSION BLDG., ATHENS, GA.
April 28, 1959
GEORGIA ALL CORN - 1958 COUNTY ESTIMATES
ACREAGE, YIELD A}ID PRODUCTION
(Preliminary)
.
District and County: Harvested Acres:
Yield Per Acre: Production
-- --- -- - - - ------- ------ - --- - - - - ----- --
Bushels
Bushels
c
DISTRICT 1
Bartow
Catoosa
Chattooga
Dade
Floyd
Gordon
Murray
Paulding
Polk
Walker
Whitfield
12,600 3,800
;L0,60o
3,250 11,200 .'13,600
9,000 8,350 9,000 9,550 9,050
: 31.0 37.0 32.0
37.0 38.0 29.0 38.0 31.0 29.0 38.0 31.0
390,600 140,600
339,200 120,200
425,600
394,400 342,000 258,800 261,000 362,900 280,600
Total
100,000
33.2
3,315,900
DISTRICT II Barrow' Cherokee Clarke Cobb Dawson De Ka1b
Fannin
Forsyth Fulton
Gilmer Gwinnett Hall Jackson Lumpkin
Oconee Pickens Towns Union Walton lrJhite
5,800 6,650 1,580
5,580 2,550 2,000
3,750 7,300 7,600 4,290
9,500 7,800
7,900 2,970 5,300 2,340 2,290 4,820 11,500
3,480
26.0
150,800
38.0
252,700
29.0
45,800
28.5
159,000
36.0
91,800
28.0
56,000
44.5
166,900
30.0
219,000
33.0
250,800
48.0
205,900
27.0
256,500
28.0
218,400
27.0
213,300
47.0
139,600
31.0
164,300
33.0
77,200
48.0
109,900
47.5
229,000
30.0
345,000
47.0
163,600
Total
105,000
33.5
3,515,500
DISTRICT III Banks Elbert Franklin Haber:?ham Hart Lincoln l'iadison Oglethorpe Rabun Stephens Hilkes
Total
5,400
5,500
8,350
.-
4,480 7,350
3,460
7,450
6,790
2,720
3,250
5,2 ?O
60,000 UNrvERSITY OF GE'ORG''''
"'~~ 2 '59
LlBK'''\\C.'
27.0 27.0 26.5 35.0 28.5 25.0 24.0 23.0 45.0 27.5 27.0
27.6
145,800 148,500 221,300 156,800 209,500
86,500 178,800 156,200 122,400
89,400 141,800
1,657,000
GEORGIA ALL CORN - 1958 County Estimates Acreage, Yield and Production
(Preliminary)
District and County: Harvested Acres:
Yield Per Acre: Production:
------ ---- --- - -------------------- ---
Bushels
Bushels
DISTRICT IV
Carroll
Chattahoochee
Clayton
Coweta
DougJ.,as
Fayette
Haralson
Harris
Heard Henry
,
Lamar.
Macon
Marioh
Meriwether
Muscogee
Pike
Schley
Spalding
Talbot
Taylor
Troup .
Upson
27,300
790
3,020
12,300
4,890
6,100
8.,250
4,670
8~250
10,400
4,500
.
30,000 15,800
15,400
960
r 7,400
13,500
2,770
5,200
20,700
6,600
5,200
31.0 24.0 25.0
33.5 30.5 \ 24.0 27.0
2i>.0
27.5 30.5
, 31.0
39.0 29.0 33.0 24.0 32.5 32.0 38.0 25.0 37.0 29.0 34.0
846,300 19,000
75,500 412,000 119,100
116,400 22'2,800 121,400 226,900
317,200 139,500 1,170,000 458,200 508,200
23,000 240,500 h32,000 105,300 130,000
765,900 191,400 176,800
Total
214,000
32.1
6,877,400
DISTRICT V
BaIdWil\
Bibb
Blackley Butts Crawford Dodge
Greene Hancock Houston Jasper Johnson Jones Laurens Monroe Montgomery Morgan Newton Peach Pulaski Putnam
Roc\<dale Taliaferro Treut1en Twiggs Washington
Wheeler Wilkinson
10,000
4,300
22,500
3,100
7,050 38,500
4,740 13,800 19,400
3,340 32,200 1,760 88,500 2,970 20,900 8,500 7,700
9,200 18,700
2,430 3,560 1,790 17,060 11,700 35,300 23,700
14,300
24.0
36.0
32.5
32.0
30.0
30.0
20.0
24.0
47.5
28.0
28.0
25.0
32.5
24.0
27.0
26.5
.. ,
27.0 49.0
29.5
27.0
32.0
.. 21.0
. ' , '
27.0 '25'.0
27.0
24.0
25.0
240,000
154,800 731,200
99,200 211,500 1,1$5,000
94,800 331,200 921,.500 93,500 901,600
44,000 2,876,200
71,300 564,300 225,200 207,900 450,800 551,600
65,600 113,900
37,600 460,600 292,500 953,100 568,800
357,500
Total
427,000
29.9
12,775,200
GEORGIA ALL CORN - 1958 County Estimates Acreage, Yield and Production
(Preliminary)
- - - - - - - - - - - - - - - - District and County:
- ----
- - Harvested
A-cr-es-:
-
-
-
Yield
-
Per
-
Acre:
--
-
Production
-- --
Bushels
Bushels
DISTRICT VI BUlloch Burke Candler Columbia
Effingham Emanuel Glascock Jefferson
Jenkins I1cDuffie Riclunond
Screven Warren
77,000 58,000 26,800
3,990 18,200 49,000
9,770 35,000. 33,500 9,400
4,740 56,500 12,100
32.5
2,502,500
30.0
1,740,000
30.0
804,000
22. 0
~ 87,800
29.0
527,800
31.0
1,519,000
21.0
205,200
31.0
1,085,000
33.0
1,105,500
24.5
230,300
26.0
123,200
36.0
2,034,000
24.0
290,400
Total
394,000
31.1
12,254,700
DISTRICT VII Baker Calhoun Clay Decatur
Dougherty Early Grady
Lee Miller Hitchell Quitman Randolph
Seminole
S},ewart SUmter Terrell Thomas Webster
25,600 17,900 14,100
54,500 12,200
53,500 52,000 21,000
40,100 60,900
5,500 22,600
27,700 17,200 36,500 26,400 55,200 12,100
28.0
716,800
33.0
590,700
27.0
380,700
37.0
2,016,500
33.0
402,600
35.0
1,872,500
34.0
1,768,000
31.0
651,000
28.0
1,122,800
33.5
2,040,200
27.0
148,500
29.0
655,400
34.0
941,800
27.0
464,400
34.0
1,241,000
30.0
792,000
36.0
1,987,200
30.0
363,000
Total
DISTRICT VIII Atkinson Ben Hill Berrien Brooks Clinch Coffee Colquitt Cook Crisp DEcohoo~s Irwin Jeff Davis Lanier
L01~'lldes
Telfair Tift Turner Wilcox Worth
Total
555,000
17,400 14,900 44,200 53,000
2,600 62,500 66,,00 29,100 33,200 3~,,690000 39,800 23,500 12,400 33,200 31,900 27,700 19,300 26,300 56,000
638,000
32.7
18,155,100
32.0
556,800
31.0
461,900
31.5
1,392,300
34.0
1,802,000
28.0
72,800
36.0
2,250,000
37.5
2,493,800
35.0
1,018,500
35.0
1,162,000
37.5
1,496,200
26.5
121,900
38.0
1,512,400
28.0
658,000
26.0
322,400
27.5
913,000
27.0
861,300
36.0
997 ,200
32.0
617,600
28.0
736,400
36.0
2,016,000
33.6
21,462,500
GEORGIA ALL CORN - 1958 county Estimates
Acreage, Yield and Production
(Preliminary)
- District and County: Harvested Acres:
-------- ---
Yield Per Acre: Production:
Bushels
Bushels
DISTRICT IX ppling
Bacon Brantley Bryan Camden Charlton Chatham
Evans Glynn Liberty Long McIntosh Pierce Tattnall Toombs Ware Wayne
28,100 21,600
5,600
5,350 330
1,4ho 1,580 15,600
320
2,330 4,760
290 26,200
38,100 29,600 15,700 21,100
31.5
885,200
29.5
637,200
26.0
145,600
33.0
176,600
30.0
9,900
30.0
43,200
26.5
41,900
30.0
468,000
32.5
10,400
30.0
69,900
29.0
138,000
31.0
9,000
29.5
772,900
32.5
1,2)8,200
31.0
917,600
30.5
478,800
33.0
696,300
Total
218,000
30.9
6,738,700
STATE TOTALS
2,711,000
32.0
86,752,000
..
.' III
.. ~
6
............\
.. ----~-:.-r:;. #
..., "r.' I~ .\.
i'
"
I'
~ "':.
I' )
,Y.*' ~"' '.
(,,:-) ':'
__ ,
?, \ ... r' .\ I
~ ~\\\ ~ I~ ..;:~ ',. "I
.,:""",4"1(.. ": '''1-._. ,I
/,.y
., _' I .. I 'trI" .; \. ,I
J\.~~.J'/I.I./"._.I-~~,J'"~J.tL'~~~,."I
~.I ,,~,\,\,,~,~ _.
.t
~;_ ,
\
.~ ~ ',~. . __
\\\
of"
." ....
....
11, , ,
,'.\. '...
"
';' . ' ,"
:;.
~''',:. 'f~ 1,4~\< 'II.. ./-::.cs:.
,~::\.. {};:~;- '. ,;
,'d".
I' ,'" T'Y ,.:.f~C..'.,:..
,~-
k JI'i~"I I t. 1
"1',l111/,1 ',~1,)I ~'I ..'...
~.~
'> ,
G E qR.G.IA ,:'C.R 'OF' RE'POR T ING SERVICE',
''\\/ -IJ~-:J.~J1<,"~'I\" '
JI J )'-\\~rf:r~,-' I
r rl\/
~J\J
APRJ "\"59 , I 'R~)~~s;; 472'9159
G~URGIA CHl~K,; HA TCHER Y, B.EPORT:
L~E.RA11S' ,
Athens, 'Ga., April 29 -- A total of 7, 319,:,000 broiler chicks were placed
with producers in Georgia du,ring the week ~nding April 25, according to the
Georgia Crqp Reporting Service. 'This compares with,the 7,477, O.QO 'placed the
previous' week arid lS 7, pereent"rrJ.0re' th'an the 6; 826,,000 pi'ate:d the same week
last year.
' , " , ' .. " ,', , , : ,
" :'
'
, Eggs set by Georgia hatcheries amounted to 9,480, 000 compared with
9,778,060 'the, pr-evious '~eek,and I.s:l p'ercent less than the 9:,544,000 for the
. correspbn'ding week last ye~r',' , ' :...
!,
'
"
:', T~e majority; of the prices paid for Georgia produced hatching ~ggs were
reported within a range of 35 to 50 cents with an, average of 44 cents ;for all
hatching eg'gs':and '43 cents for eggs' purchas-ed a,t the far1;n from fioC;ks with ,
hatchery owned cockerels. Last week the range was from 35 to 52 c'ents' and an
average Qf 45 cents for all hatching l eggs an,d 43- cents for eggs purchased at:,the farm frorI:l flo,cks with hatchery owned cockerels. Most 'p.rice s charg,ed for thic~s, were'reported witQ.in a range 'o,f $5. aO'to $,8~':OO with an average of $6. 75 per hun-
dred G'ompare'd with a range of $5. 00 to $8.00 with an average of $6. 75 per 'hun- '
cited last week. The average pric~s,l~st year Were 82 cents for eggs and $14.25
for: ch, lcks,.I ,',
'"
'"
....
.
.
..
'.
. . . . . . . ',' "
'.'
'
J'
/'
W~ighted average prices 'from the Fe'derai";'State 'Mar'ket, News Service fo~
broilers during the week ending April 25 are as follows: Georgia broilers 2 3/4 -'
3 3/4 pounds,: at,fa;rms, 15. 96~;, FOB pl&,nts',16. 62~.
'
GEO~GiA' EGGS" SE:j,:' ~~t2~nNGS,'" A~b CH:IC~:PL;'C~MENTS -
BROILER TYPE ;
I EGG TYPE
W~ek
En:ding ,
U " , !' Egg~ S.et
Chicks Placed for
,..' '
Br,0iler,~
,.,:
in,G'.e.orgia,
~ggs Chicks Set ,Hatched'
1958
I
1959
1959 1.of 19
5%8
1958
, 1959 0/0
1959 of 1958 1959 1959
, " 'Thoi,l., Th~u,';:''lpe,~c,~~~,?'h~,~., .:, T}l~ui '~'l~e!,~.~n~JTh~u., Thpu.
F~b.21:
Feb.28 M~r. 7: Mar.14,
Mar.2f Mar.28 Apr. 4 Apr. 11 Apr. 18 Apr.25
I 8,302 9,615
116
6,132 6,419
8,291 : 10, 082 I 122., 6,2.t14 , :6,6,26
~,003, 10, 143., l2t: :6, 307 " 6,,8,88,
8,474 10,030 .. 1',18, 6,; 015 ',7,0'94
8, 586; 9,925
116 '5,'840 ':7',305 "
8,733 9, 979
114 6, 103 ,7,440
8,954 9, 900
III 6,468 7, 173
9, 141 9,710
106 6,695 7,382
9,265 9,778
106 6, 709 7,477
9, 544 9,480
99 I 6, 826 7,319
105 106
109 118 "
Y25 122 111 110 III 107
732 590 7:46 ' 5S7 8'07' 530 864':, 670
923 702 793 764 706 706 685 723 725 669 559 588
I
1/ Includes eggs set by hatcherie s producting chicks for hatchery supply flocks.
ARCHIE LANGLEY Agricultural Statistician In Charge
W. A. WAGNER Agricultural Statistician
U. S. Department of Agriculture
Agricultural Extension Service
Agricultural Marketing Service
State Department of Agriculture
319 Extension Building, Athens, Georgia
--------------------------------------~----------------------------------
STATE
EGGS SET AND CHICKS PLACED IN COMMERCIAL AREAS. BY WEEKS - 1959
Week Ending
Apr. 11
Apr.
18
Apr.
25
Mar.
21
Mar.
28
Apr.
4
Apr.
11
Apr.
18
Page 2 ~
Apr.
25
EGGS SET - THOUSANDS
CHICKS PLACED - THOUSANDS
Maine
1, 517
1,601
1, 553
1,243 1, 231 1,229 1, 187 1, 215 1,350-
Connecticl:t
1, 178
1, 124
1, 071
519
496
597
578
598
602
?ennsylvania
1,412
1,277
1, 516
787
690 - 985
865
927
735
Indiana
2,201
2,062
1,958
873
961
877
911
871
930
"
Illinois
348
285
280
154
183
198
182
218
173 -
II
Missouri
1,933
1,730
1,723
883
845
885
882
748
711
Delaware
2,099
2, 136
2,048
2,051 1, 931 1,914 1,833 1,985 1, 720
Maryland
2,408
2,577
2,373
1,886 2,084 2,021 1,904 1, 729 1,914
Virginia
2,461
2, 504
2,497
1,219 1, 273 1,356 1,247 1,072 1,025
West Virginia
363
341
365
731
678 - 637
676
681
-694
North Carolina
4, 157
4, 197
3,835
3,384 3,376 3,307 3,332- '3,287 - 3,313
South Car olina
489
525
526
377
379
413
375
390
338
GEORGIA
9,710 9,778 9,480
7,305 7,440 7, 173 7,382 7,477 7,319
lorida Alabama Mississippi Arkansas Louisiana Texas Washington Oregon California
331 4,494 3,301 4,601
826 3, 185
452 447 1, 616
364 4,411 3, 158 4,310
657 - 3,oio
405 451 1,459
386 4,444
3, 150 4,371
610 2, 864
373 435 1, 552
239
216
264
214
220
193
3,514 3,661 3,712 3,640 3,600 3,767
2,593 2,609 2,540- 2,657 2,633 2,690
3,822 3,761 3,745 3,618 3,625 3, 567
:
494
505
559
488
500
468
2,271 2,475 2, 558 2,473 2,600 2,627
356
350
232
329
326
418
257
246
268
280
279
250
1, 165 1, 213 1, 207 1,245 1, 173 1, 188
TCTAL 1959 TCTAL 1958 1959 Vlo of 1958
49, 529
~7,462
104
48,362 48,478
100
47,410 49,461
96
!
36, 123 36,603 36,677 36,298 36, 154 35,992
29,291 30, 134 31,793 33, 156 33,291 33-,667
123
121
115
109
109
107
------ ~-- _.
lI
"
II
JI
I "'
3 J!::J-
CGIE(Q)~GHA C~(Q)Ir ~lEIP(Q)JR{llllN(G [~vnceIE
AGRICULTURAL EXTENSION SERVICE J,lNIVERSITY OF GEORGIA AND THE STATE DEPARTMENT OF AGRICULTURE
J~thens, Georgia
U. S. OEPARTMENT OF AGRICULTURE AGRICULT'JAAL MARKETING SERVICE 319 EXTENSION BLDG,; ATHENS, GA.
II/lay 4, 1959
GEORGIA CASH RECEIPTS FROM LIVESTOCK SET~ ALL TI~~ RLCORD IN 1958
Cash receipts from livestock and livestock products on Georgia farms set a
new high record of $412,7321.000 in 1958. This is 16 percent, or ~53,047,000 above the 1957 receipts of $359,685,000. Commercial broilers accounted for $164,521,000, or 39.9 percent of the total, for all livestock and was followed
in rank by cattle and calves l-lith $69,748,000; hoes, ~;;68,807,000; eggs, $53,128,000; Dairy products $49,466,000; farm chickens, ~5,328,000; turkeys, $1,185,000; sheep and lambs, $431,000 and'wool $118,000.
Cash.receipts from crops for 1958 will be available in September 1959.
LIVESTOCK CASH RECEIPTS FOR GEORGIA
1954
195,
1956
1957
1958
'(Thousand Dollars)
Hogs
59.,570
41,879
46,888
57,833
68,807
Cattle & Calves 28,276
40,795'
40,937
47,610
69,748
pairy Products 42,717
45,291
48,663
50,710
49,466
Com. Broilers
101,951
125,700
129,836
150,336
164,521
other Chickens Turke!,s
3,998 2,502
1+,171 1,912
4,536 1,845
.4,690
1,839
5,328 1,185
Eggs
33,152
40,891
42,115,
45,991
53,128
Sheep & Lambs .
27
42
245
509
431
W-o-ol- - - - - -- -- - - -'51- -- -- - - - 5-4-- - - - - 1--11-- -- -- - -- -16-7- - - - - -11-8-
- T--O-T-AL- A--BO-VE-- - - - 2--7--2,2-44- -- - -3-00-,73-5- - - - 3-1-5,1-76- - - -3--59-,68-5-- -- - --41--2--,73-2-
,
CARL 0. DOESCHER
Agricultural Statistician
.'
ARCHIE LANGLEY Agricultural Statistician In C&arge
MAY (, '59
LfBRft.RIC"
-------------------------------------------------------------------------
DISTRIBUT~ON OF 1958 CASH RECEIPTS FROM GEORGIA LIVESTOCK'
..0
~~
~I
~,
~
~~y~ ,Ql
'*
\
\
~
\
.~
\"
0
J.;;.9%'
\
\
,'\,\
\\
f\qo
) :0
~(J~CO
"" \ I '.'
I
;'
/
I
j
I
,I
~ en
to
r-l
g;Cf)
~
(.)
~~ ~
E-\
~
(.)
......~"
CO~tiliIERCIAL BROIlERS 39. 9%
\
~k OTHER. includes farm chickBns, turkeys, sheep and lambs, and wool.
." ..
II
."
'6-
,/.
~.
-i
J
. . . ..~-.... .I.]'t!A~...,......"
I
I
~::... . ' Ii" . /
-
"\,.',
",,". I
'i:" , , . ,. ~ ~,l
.I
.t '"~.)". ~~\~~. \": -~, '.,:'\"-,
/ III~J,
j ..... ~~J~.
'. '\"
"""..
~. ~ ~.':,' "~~.
I
I'~, .. k.', '- ".~.IW' \* . ~, ..." \ i~ _
J
~ :p) '" ....
. . .~\ ~t. .:.ilwJ.\~V'~ ~~_._.
GE0RGIA CROP REPORTING SERVICE
\!\j F 1<_ j \/ . -JrSJ.~J
PJ}-\~rcFfERY
Release 5/6/59
GEORGIA CHICK HATCHER Y REPORT
LleRARIE...c:.
:.Athens, Ga., May 6 -- A total of 7, 244, 000 broiler chicks were placed
with producers in Georgia during the week ending May 2, according to the
Geor~ia Crop Repo'rting Service. This compa.res with the 7, 319, 000 placed the
previous weels: 'and is 6 percent more than th~ .6,857,000 placed the same week
last year." "
,..
,
.
i
Egg,s set'oy Georgia hatcneries amounted to 9, 632, 000 compa'red with
9,480, ood the pre.)ious week and is .2 percent more than the 9, 428, ~O(): for: the
corr(~isponding week. la.s.t .y.e:ar. .
. The: maj~rity of the pric'e~ paid' for Georgia produce'd hatching eggs were
reported within a range of 35 to 50 cents with an average of 44 cents for all hatching ~gg~ and 42 cents for. egK~ pu:,:"ch?-sed at the farm from floc~s, wi~h h~tch.
ery 'owned coc~erels. Last week the range was from 35 to 50 cents with an aver-,
age of 44 cents' for' all hatching eggs and 43 cents for eggs purchase.d at the farm
from .flocks. with hatchery owned c.ookerels. ,Most prices charged for chicks
were :re'p6rted within a range of.,$5 ..00 to $8.06 with an' average of $6. 75 per hundred compared with a range of ,$5.'00 to $8.00 with an average o~ $6,. 7.5 pe'r hun- :
dred last 'week,. The average prices last year were 82 cents for eggs and $14.25; for c~ic,kl?
Weighted, av~rage.prices 'from the Federal-State Market News Service for
broilers during the week ending May 2 are as follows: Georgia broilers 2 3/43 3/~!pou~ds, fl.t f~rms 15. 48~; FOB plants 16. 38~ .
.';
GBORGIA EGGS SET, HATCHINGS, AND CHICK PLACEMENTS ~
BROILER TYPE
EGG TYPE ,
Week, Ending
_..
,.
Feb.~8
;
I
Eg~s Set !J
Ch~cks Placed for Broilers in Georgia
Eggs Set
1958
1959
1959 '70
of 1958
1958
' '1959
. ... . Thou. :
' t :.,
~
Thou.
Percent . Tho.u. ; " Thou.
., .
8', 2~ 1 ~ 10, 082 ' '., 122 . 6, 244 :.:' 6, 626
11959 0/0
of 1958 Percent
106
1959
Thou.
,
746
Chicks I Hatched:
i959 " I
i.hou. I
.
I
J
5.87 "
Mar:... : 7
8, 003 10, 143
127 6, 307 .6,888
109
Mar.l4
8,474 1.0, 030
118 ,6,0.15. '7,094
118
1aX:,21 i':: 8,586 9,.92~
116 : 5, 840 . 7, 305
125
.v1ar .28 : '8,733 9,979
114 6, 1'0-3', '7,440
122
Apr ..' 4
8,954 9,900
111 6, 468 ' 7, 173
III
807 530
I
864 670
923' 702
:
793 764 ~.
706 7'06 '. I
Apr. 11
9, 141 9,710
106 6,695 7,382
110
685 723
Apr. 18
9,265 9,778
106 6, 709 7,477
111
725 669
Apr.25
9, 544 9,480
99 6,826 7,319
107
559 588
May 2
9,428 9,632
102 6,857 7,244
106
574 513
I
,I
,
1/ Includes eggs set by hatcheries producing chicks for hatchery supply flocks.
ARCHIE LANGLEY Agricultural Statistician In Charge
W. A. WAGNER Agricultural Statistician
U. S. Department of Agriculture
Agricultural Extension Service
Agricultural Marketing Service
State Department of Agriculture
319 Extension Building, Athens, Georgia
STATE
EGGS SET AND CHICKS PLACED IN COMMERCIAL AREAS. BY WEEKS - 1959 Page 2 Week Ending
Apr. 18
Apr. 25
May 2
EGGS SET - THOUSANDS
Mar. 28
Apr. 4
Apr. 11
Apr. 18
Apr. 25
CHICKS PLACED - THOUSANDS
May 2
Maine
I, 601
1,553
I, 612
I, 231 I, 229 I, 187 I, 215 I, 350 I, 234
Connecticut
I, 124
I, 071
l,Oll
496
597
578
598
602
666
Pennsylvania
1,277
I, 516
1,443
690
985
865
927
735
819
Indiana
2,062
1,958
1,968
961
877
911
871
930
843
Illinois
285
280
286
183
198
182
218
173
191
Missouri
1,730
1,723
1,678
845
885
882
748
711
843
Delaware
2,136
2,048
1,992
I, 931 1,914 1,833 1,985 I, 720 1,986
Maryland
2,577 2,373 2,632
2,084 2,021 1,904 I, 729 I, 914 I,7ll
Virginia
2, 504 2,497 2,377
I,. 273 1,356 I, 247 1,072 1,025 1,220
West Virginia
341
365
330
678
637
676
681
694
601
North Carolina
4, 197
3,835
3,789
3,376 3, 307 3, 332 3,287 3,313 3,213
South Carolina
525
526
529
379
413
375
390
338
326
GEORGIA
9,778
9,480
9,632
7,440 7, 173 7,382 7,477 7,319 7,244
Plorida
Alabama Mississippi Arkansas Louisiana Texas
Washington
Cregon California
364 4,411 3, 158 4,310
657 3,010
405
451 1,459
386 4,444 3, 150 4,371
610 2,864
373
435 1,552
412
4,319 3, 160
4,~15
600 2,839
427
482 1, 391
216
3, 661 2,609 3. 761
505 2,475
350 246 1,213
264
3,712 2, 540 3,745
559 2, 558
232 268 1,207
214 3, 640 2,657 3,618
488 2,473
329 280 1,245
220 3,600 2,633 3,625
500 2,600
326
279 1, 173
193
3,767 2,690 3, 567
468 2, 627
418
250 1, 188
222
3,802 2,531 3,465
550 2,455
375 258 1,054
TOTAL 1959 TOTAL 1958 1959 -jo of 1958
48, 362 48,478
100
47,410 49,461
96
47, 124 50,'089
94
36,603 36,677 36,298 36, 154 35,992 35,609
30, 134 31,793 33, 156 33,291 33,667 33,930
121
115
109
109
107
105
CGIE(Q)~CGnA (C~(O)
s-
,tn~1rllNCG ~JE~VrrCClE
AGRICUL.TURAL. EXTENSION SERVICE
OF UNIVERSiTY GEORGIA AND THI::
STATE OEPARTMEI\:T OF AGRICUL.TURE
, . '(.A( T';';HENS' GEORGIA,.
MAY q '59
LIBRARIES
U.S, DEPARTMENT OF AGRICUL.TURE AGRICUL.TURAL. MARKETING SERVICE 319 EXTENSION BL.DG . ATHEI'S, GA.
HAY 7, ,19.59 ,/."
.,.
I.....
"j
FARM
,PRICK
REPORT ,
AS
OF
APRIL
15,
1959
','
:GEORGIA': ' The All, Commodity Index of Prices Recei~ed by Georgia farmers declined .'
, . '
.five po;i..nts to 252 percent of its 1910-1914 average during the montli', . "
ended April 15, 1959. Lower prices for cotton, All hay, hogs, All wholesale' " "
'm:i:lk, chickens and eggs were primarily responsible fo~ the de91ine. Partially."
,o:(fsettiI:1g the 4e~lir..e were higher prices for milk cows, beef cattle, and calves:
T,he April index of 252 wan 13 point's (5 percent) belo1rl a year earlier and ,is- '
below any' month during 1958.
Demand for beef cattle was good during the month. The mid-April average
price of, ~j21. 30 per cwt. for all boof cattle is th~ hiehe,st mid-month average
since Augu,st 1952, when the average price was S21.50 per cwt. The ~~27 .80 per
cwt. received for calves during April is above any month during the six,pre-
ceding years (1953-58) and is the highest price received/or calves since,M~
,1952 when the price was $28.00 per cwt. The averaee price of'S15.40 per cwt.
received for hogs during April is Below any month during 1957 or '1958 and is the
lowest mid-month average price since November 1956 when the average p~ice was
;",14.70 p'er C'lrlt.
"
'
UN~TED'STAT~S: During the month ended April 15 the Index of Prices Receiye~bY
Farmers"remained unchanged at 244 percent of its 1910-14 averagE'
During the month. egg prices droppe~ sharply, milk prices were seasonally lower,'
and mOpt vegetables we~e down. These were, however, approximately offset 'by ~he'
nigher' prices for' beef cattle, cotton, and corn.
.,
'
,
,I.'
I ,~ An ~nc.rease in the Index of Farm \vage Rate's; together with hieher pric'8s ' !
, for some items bought for production purposes,: notably feeder and stocker c~ttle,
raised the Index ,of Prices Paid by Farmers ,incl~ding Interest, Taxes, and Farm
Wage Rates one-third of 1 percent (1 poi'ni:.) to a neH high of 299.
",'r' ,", ,
. ',' .:,
~ ~t. '
.' ,
i'
Summary Table for Georgia ~nd the:Unite~ States
Index
':s, : April..
.lJ:arch 15, : April 15,: Record High
1910-14 = 100 UNITED pT,ATES:
Prices'Received:
Parity lndex ~7 :
1958 :
'257: 294:
.1959
2h4 298
: , 1959 :
: . 244 :
:
299':
Index
313 299
: 'Da:te" I,
.
I
: Feb. 1951
: Apr. 1959
Parity ~atio
:
87 ~
82
:
82
: 123 : Oct. '1946
~I I
GEORGIA
Prices Received
All Commodities :
\. All Crops
~
Livestock and , Products
265 : 2'1'7 ~
238
257
:"
2~
252 271
219
"
:
214
310
319
295
,
: }Iar. 1951 :2'(' Har .1951
: 'S:ep.: 1948
. 1/ Prices Paid, Interest; Taxe's', and 'Wage Rates based on data for the, il'1dicateo.,
- dates.
'
~/ Also April, 1951.
,
,
ARCHIE LANGLEY
Agricultural Statistician In Charge
RAYMOND R. HANCOCK Agricultural Statistic~~~
..... J '~ ".
I~
'\
,'\
(' , ,
!,
.,
.
"
, ' ..
,"
. ."
.:. -{.
PRICES ~CZIVED BY FARAERS APRIL 15, 1959 WITH COl,lPJ..RISCNS
--_._---.--
GEORGIA.
rI
lNITED STATES
C"".lODITY
Al'JD tNIT
Wheat ,bu.
Qats, bu..
Average 0 APr.1~ Mar. -~~APr. 15
191O-J.4 .1958
1959 1959
$ 1.23
2.03 1.96' 1.96
$ .67
~~o
.87
.84
i 151 .Average APr.
11910-141 1958
I
Mar.15 1959
r!A1P95r9'.l;
1 1~~.77 .894 1.95
I
.399i'
.621
.590 : . GO~ " ..
Corn, bu. Ba.rley, bu.
Sorgh\llIl GI:ain, ~. Cotton, lb.
$ .91 $
$
,I 12.1
1.49
1.25
'2.25
32.0
1.30 1.20 2.15 34.0
1,30
. 1.20
I
2.15
33.0
r .642
f
12.4.
I 1.12 .
I' .8~9,
. 1~06
",."
, ..'
9b5
1.13.
' . ' "t '
.' .898
1'.71
1.76 '1.80
27 .93'
30.11 31.28
Gottonseed, ton Soybeans, bu. Peanuts, lb.
Sweetpotatoes,cv~.
$1 23.65 $
I 5.2
$1 .84
50.00
I .2.20
I .
I
10.7
2.10
5.75
5~55
2.10 10 .2 : 5.60
22.55
4.~
1.60'
2.16 10.5
5.8S
45.40
z.cn
10.7
3.83
2.10 10.6
4.58 '
Lesped~za Seed,Al1,~~.$
~ay, baled, per'ton{
\ .All
$
Alfalfa
$
Lesp~de2;a
~
Soybean & Cav~~a
$
Peanut
$
Wool, lb~
Milk Cows, head
$ 33.85
1,1.50 I 14.90
I ~.SO 27 .40
37.70' 37.00 30.90 29.00 32..50 .: 31.00 24.00 '23.00
14.90
27.00 35.50 28.00 30.00 . 23.00
41.0 39.0
41.0
145.00 110.00' '1'175.00
9.30
10.30 9.57
18.3
18.20 18.CO 23.70 30.30.. . 22.70'
36.9
203.00
18.80 19.50 21.00 27.90 20.40
18.80 19.50'
21.00 .27.70-: 20.30
35.1
39.2' ,.., .
~6 ~OO I 235.00 .....
~ogs, ~.
~ef Cattle, owt.'
$ 7.36 19.eO 15.50 15.40
~
I 3.96, 'I 18-.90 20.90 ',I 21 ..30
7.27 5.42
20.20
15.40
22'.20' I..: 23.30
15.60 24.10 -
Ga1ves, om.
Milk,1~lesa1e,c,~.:
Fluid Mkt. Manu!.
All
'l'urkeys, lb.
$1 .
23.10 26.50 27 .80
,
.
6.75
'24.50
.. "'27 .90 29.00 '
$
:Ii
$
'il Ll I - :2-_.4~ I
.~ 53..1e6o
53..8350
5 ',71 .!I 5.60
_ 5.65
.~O 28
.25 ,,0 .. ;5. 0
II
I
- ~ _
l ! l -1.6'0
I 43..0339
3.88
43..5119
4.06 IY 3.87
!! 14.4 I 26.7 I 23.6 I 23.0
'.'
Chickens, per lb.:
.
.'
II
;.
I
I
Fam Com'l Broil. All
18.5
.
18.6
113.~ 1 18 6
14.5' I 13.5 17.0-j '15.5
16.9 115.5
I
_
j
-
.1 11.4
I 17.0 :, 13.3
19~4 j 17.3
19.2
15.8'
12.6 16.3
'15.9
mggs, ~oz.
l! Re~~s.ed.
~ I I ~.1- 2~~~:.;.... 21_.4 I 54.3 43.0
38.5 11 2;1..5 I. 38.5 I
..
I.
I
" ' ! I
I
rI, . '
?J ~;l~aryE;~te . --~--~~~.-=--=-~-==~_.~-=~.; ~.~~.-.--,-
PRICES Plill> BY F.A1l1E:RS FOR SELECTZD mDS APRIL 15, 19S9.VrrrH CC1'vIPARISCNS
=- iAPr9~5. ~5915'lr~5~1~:-+I! :APr9~5. -~591:' iA~i95~5'1: KlND OF ","D
-_..- .._ - GE:ORGIA :
--.-
i
tNITED~.g.
.
J: ~ner. Mixed Dah'y o Feed
~ All Under 29% Protein <
0: 0
0-0
.95 '-1 3.90",
Per 100 PoUnd.
3 .85 ,i II
3.70
3.80
3.79
1186lf~t
Protein Protein
2~ Protein
24~ Protein ,:.
' ....
Hith Protein Feeds.. ..
CO ton seed Ma81
-
I 3.85 I 3.80
4.25
4.20
I 4.05
4.10
I; 4.40 , 4040
3.90
4.10
',3.75 4.<:5
I 4.05
III 4.40 4,10
II
3.65 3.64 3.94
4.04
I 3.95
3.74 3.70 4.01
4.10
3.74 . 3.67
4.01
I 4.10
4.29
4.26 .'.
Soybean Meal
3.90
4.05
4.10
4.21
4.25
4.26
Meat Sorap
Grain By_Products Bran
_
_
I'
-
I
I
3.30 II 3.35
I
' I
3.35',
2.93
3.08
3.13
Middlings
3.50 I 3.55 I 3.55
2.99
3.13
3.21
Corn Meal
3.45 : 3.30 , 3,30 I 3.26
3.17
3.22
Poultry Feed Broiler Growing Mash
Laying Mash Soratoh Grains
II 5.10
4.85
4.95 4.75
4.30
4.20
I,
I
4.95
4.75 4.15
II. 4.97
I
."
"1.48 3.99
4.90 4.49 3.89
4.93 4.52 3.93
fHrl,:ted )
All other
_.
i 50.00 45.00
45.00 I 35.00
._.__ ._.~ __ .._.~._ _ .
I
I
Ii
45.00 35.00
'I 30.70 29.70
I
. _~.
I 29.90 27.90
l
I 29.50
I 27.30 .
.
---_.
-
!'; J~J11',r.l'I~t, ',:"
I :1,
j ~' '.~ ~\ '1"
L.'f.I \
V_"
- - - - ~"""'~---=--
__ ;""' ...._J ... "'~- l:'~: ..... ~ .... --, ...... /;.."".
" "f'
IS-
GEOaGIA CROP REPORTING,SERVICE
\/\/'Lr
Lr
J1<:~
\/
J
,'.',1
-f-C. ~I ~J~/\. ~,IrLJrJ''f\J \Jj
Release 5/13/59
GEORGIA CHICK HATCHERY REPORT
i
Athens, Ga., May 13 -- A total of 6,996, 000 broiler chicks were placed with producers in Georgia during the week ending May 9, according to the G~orgia Crop ,Reporting Service. This compares with the 7,244,000 placed the p~evious week and is 1 percent more than the 6, 934, 000 placed the same week last year.
Eggs set by Georgia hatcheries amounted to 9, 570, 000 compared with 9, 632, 000 the previous week and is 4 percent more than the 9, 204, 000 for the corresponding week last year.
The majority of the prices paid for Georgia produced hatching eggs were reported within a range of 35 to 50 cents with an average of 44 cents for all hatching eggs and 42 cents for eggs purchased at the farm from flocks with hatchery owned cockerels. Last week the 'range was ,from 35 to 50 cents with an average of 44 cents for all hatching eggs and 42 cents for eggs purchased at the farm from flocks with hatchery owned cockerels. Most prices charged for chicks were reported within a range ,of $5.00 to $8.00 with an average of $6. 75 per hundred compared with a range of $5.00 to $8.00 with an average of $6. 75 per hundred last week. The average prices last year were 82 cents for eggs and $14.25 for chicks.
Weighted average prices from the Federal-State Market News Service for
broilers during the week ending May 9 are as follows: Georgia broilers 2 3/4 3'3/4 pounds, at farms 14.93~; FOB plants, 15.48~.
GEORGIA EGGS SET, HATCHINGS, AND CHICK PLACEMENTS
I
BROILER TYPE
EGG TYPE
Week Ending
Eggs Set !!
1958
1959
1959 0/0
of 1958
Chicks Placed for Broilers in Georgia
Eggs Chicks Set Hatched
1958
1959
1959 0/0
of 1958
1959
1959
Thou. Thou. Percent Thou. Thou. Percent Thou. Thou.
Mar. 7
8,003 10, 143
127 6,307 6,888
109
M'ar.14
8,474 10,030
118 6,015 7,094
118
Mar.21
8, 586 9,925
116 5, 840 7,305
125
Mar.28
8, 733 : 9, 979
114 6, 103 7,440
122
Apr. 4' 8,954 9,900
III 6,468 7, 173
111
Apr. 11
9, 141 9,710
106 6,695 7,382
110
Apr. 18
9,265 9,778
106 6,709 7,477
111
Apr.25
9, 544 9,480
99 6,826 7,319
107
May 2
9,428 9,632
102 6,857 7,244
106
May 9
9,204 9,570
104 6,934 6,996
101
807 530 864 670 923 702 793 764 706 706 685 723 725 669 559 588 574 513 395 423
i
1/ Includes eggs set by hatcheries producing chicks for hatchery supply flocks.
ARCHIE LANGLE Y Agricultural Statistician In Charge
W. A. WAGNER Agricultural Statistician
u. S. Department of Agriculture
Agricultural Extension Service
Agricultural Marketing Service
State Department of Agriculture
319 Extension Building, Athens, Georgia
STATE
.
.
EGGS SET AND CHICKS PLACED IN COMMERCIAL AREAS, BY WEEKS - 1959
Page 2 ~
.,
Week Ending
Apr. ::. . May
25
2
Ma.,y .'
EGGS SET - THOUSANDS
Apr. 4"
"
Apr. 11
Apr. 18
Apr. 25
May 2
May 9
"
CHICKS PLACED - THOUSA.NDS ..
Maine
1, 553
1, 612
1, 619
1, 229 1, 187 I, 215 1, 350 1, 234 1, 240
Connecticut
1, 071
1,011
1, 123
611':<
596*
598
602
666 - 636
Pennsylvania
1, 516
1,443
1,256
985
865
927
735
819
73'6
Indiana Illinois
1, 958 280
1,968
.' 1., 947
.. .
286
220
877
911
871
930
843 . -873
198
182
218
173
191 ' . :106
Missouri Delaware
1,723 2,048
1,678 1,992
1, 756 1,962
..
885 1,914
882 1, 833
748 1,985
711 1,720
843 .. 702 1,986 1,996
Maryland
2,373
2,632
2,604
2,021 1,904 1, 729 I, 914 I, 711 . 1,649
Virginia
2,497
2,377
2,478
1, 356 . 1, 247 . 1, 072 1,025 1,220 . I, 197
West Virginia
365
330
345
637
676
681
694
601
633
North Carolina
3,835
3, 789
3,581
3,307 3,332 3,287 3,313 3,213- 3,300
30uth Carolina
526 .
529
.. 573
413
375 " 390
338
,326
320
GEORGIA
Zlorida Alabama
9,480
9,632
!
386 .
412
.-
4,444
4,319
9, 570
400 4,280
'7, 173
264 3,712
7,382
214 3,640
7,477
220 3,600
7,319 , 7,2,44
193
222
3,767 3,802
6,996
205 3, 506
Mississippi Arkansas
3, 150 4,371
3, 160 4,215
2,974 4, 149
-
2, 540 2,657 2,633 .2,690 2,531 2,267 3,745 3, 618 3,625 3, 567 . 3,465 3,527
Louisiana
610
600
605 .
559
488
485* 468
550 .: '485
Texas
Vv ashington -
2,864 373
2,839 427
2,995 391
2, 558 2,473 2,600 2,627 2; 455 2, 131
352* 329
326
418
315
'369
Oregon California
435 1, 552
482 1, 391
491 1,417
258* 280 1,207 1,245
279 1, 173
250 1, 188
:258 -: . 219 1,054 1,055
TOTAL 1959
:
TOTAL 1958 '
,.
1959 '10 of 1958 , I
47,410 49,461
96
*Revised.
47, 124 50,089
94
46,736 50, 110
93
36, 80.'1* 36,316* 36, 139* 3.5,9?2
31,793 33,156 ~3, 29,r . 33,.667
116
110
109
101
,
.
.3 5, 6.09 33,930
105
34, 148 ,.
34,910
98
(G1E(Q)~CGllA ce~(QJ1
13 ,e.GRICULTURAL EXTENS'ION 'SERVICE ' :.
UNIVERSITY OF GEORGIA AND THE
STATE DEPA-RTMENT,. OF 'AGRICULTURE
Athens, Georgia
", . '.' .
. .' ~
. S, DEPARTMENT OF AGRICULTURE GrHCULTL\RAL MARKETING SERVICE 319 EXTEHSION SLOG" ATllENS. ~~ . :.~
Hay 13, 1959;.-~\
.,
IF.. MAY 1,. 1959
:.. ,",'I, .i"
. . , j ,'" ,'\
...... p"~~a6on:ably cool:weather during April reduced gerniination of seed and re- .'
'tarded plant growth. Heavy rains in some areas, as well as severe hail storms in
of many local areas, damaged stands of tobacco, corn, cotton, and peanuts.
siderable replanting was necessary as a result the adverse weather.
Oon-.'
.
. . ~. P!lstures, small grains, and early hay' crops' mad.e rapid grmvth during April . )
desp?te the cool iveather. Pastures art: f~rnj.shing excellent grazing. 1iheat and
oats are well advanced even in northern districts.
. ..'.
INDICATED .lrJl-mAT YIELD EQUALS RP,CORD BIGH": Current indica.tions point to ~ ivheat
'.
yield of 23.0 bushels per acre~ "If
realized, 'this .will. be equal to the record high for the"State obtained for the first time in 1958. Total producti.on is forecast at. 2,346,000 bushe.~s"la.n:increas( of 44 p,er'cent from last year"s'crop of 1,63J.,ODO bushels ,~d 12 percent above' .,-
average." Acreage for harvest i's" estimated to be 102,000 acres compared ivith .
71,000: 'acres harvested last yeB!.
PEACH PROSPECTS DG\iN: Georgial's 1959 peach crcp is estimatGd at j;400,ooo, .
15 percent below last ye'ar' s crop of' 4,000,000 bush~J,.s..
The estimate of production includes both farm and commercial peaches. If current
prospects are realized, this year's crop will be the third J.ar~est in the l~st ".~'-:
10 yearp,.being exceeded only by the 1951 crop of 3,975,0.00 bushels and last'year'
when production totaled 4;000,000 'bushels. Picking is expected to start a little earlier. this year than in 1958 whEm first Shipments ~vere made on Hay 29.
'
I'
,
EGG PROD,UCTION UP: The number 'of eggs laid by hens on.' Georgia farms duri~g;.ApriJ....
is e's timated at 135 'million compared wi tli J,l9 milli0l?- ,for. the'.: same mQnth last year. The increase of 13 percent is attributed to 809,000 more ..~
layers on farms and to an increase of two ~ercent.in the rate of lay.
11ILK PRODUCTION SHOWS INCREA~E: Hilk production in Georgia during.. April. is es-:.: .....
tinia.t'ed 'at i06 million pounds, an increase of"
seven million pounds from last month. 'the increa'se was due primarily to a higbe-r .
rate of production per cow. bnproved pastu!es furnished excellen~. gr~zing in, .
most areas 'of the State.
.. , .
,<: .:'
,
- - - - - - - - - - - - - - PEACHES
..- - - - - -:- - - - - - - - - .- - - .- -ProductIon ~r
- ; - State :- ~~~8~~~
-1956 - ; - - ~957- - - ; - -1958 - - - ; -I~~9~~;d-
--------------------------------------~--
1,000
1,000
1,000
1,000
1,000
bushels
-bu-sh-e-ls
bushels
bushels
bushels
N. C.
5. C. Ga. Ala. Iftiss. Ark. La. Okla. Texas
1,050 2,931 2,101
50S
334 1,452
74 233
_ _ _65.5
950
L~,350
1,600 600
447 2,250
80
z2.70.0?
1,500 4,400 1,825
425
268 1,100
125
19320
1,350
2/ 5,300
2/ 4,000
- 960
443 2,100
145
350 11.120
1,200 5,000 3,hOO 1,040
420 1,850
120 170
820_ _
9 States : 9,308
11,052
10,463
15,748
14,050
I/-F-;;r-s~me Statesi; -;;e;t"ain ye"ar-;,-p;odu-;;tion in-;;l~d~s-s~m; qu;ntities-'- - --
0- unharvested on account of economic conditions. Estimates of such quantities I were as follows (1,000 bushels): 1956-Arkansas, 195; 1957-Georgia, 30;
1958-Georgia, 17S;Arkansas, 66. 2/ Includes excess cullage of harvested fruit (1,000 bushels): 1958-South - Carolina, 140; Georgia, SO.
ARCHIE LANGLEY Agricultural Statistician In Charge
CARL O. DOESCHER Agricultural Statistician
UNITED STATES - GENj<1?~:L, CRO!., REPORT AS OF f<~!.l, 1959
Winter wheat prospects deelined about 'one percent during April as lowered outlook in the Northeast and northern Interior more than offset gains in the central and southern Great Plains and the Southeast. A cool, dry April over eA~ensive areas held back plant grow~h, but favored farming operations. .Spring grain seeding showed good progress and corn and cotton planting ~~ the southern sections outstripped last year's laggard season. Corn, sorghums, and soybeans. advance toward the main planting season in the heaviest producing areas with preliminary land preparation showing near normal progress. Fruits suffered limited April damage. Southern peach prospects were not as bright as a year earlier but the outlook was exceptionally good in California. Spring vege~ables, excluding .. melons, are e~'Pected to be only slightly below las-l:, year, but a fourth less watenne10ns are indicated. Pasture and hay crops show aoout average growth nationally; but development in several areas was retarded by cool temperatures and short moisturo supplies.
WINTER WHEAT: Moderate to significant production increases in most Southern States and Nebraska helped maintain tho production level estimated
on April 1 against rather sharp losses in some major producing Northern States. Production on May 1 is forecast at 957 million bushels, 9 million bushels less than the April 1 forecast but retained the prospect of peing the fifth largest crop of record. This production would be 19 percent less than'the record 1958 crop of'1,180 million bushels but 17 porcent above average. Major losses since April 1 in Ohio, Michigan, Illinois, and Montana more than offset minor gains in most Southam States and significant gains in Nebraska and 9klahoma.
PEACHES: Prospectivo 1959 production in tho 9 Southern States, forecast from '. May 1 conditions at 14,050,000 bushels, promises to be 11 percent bo-
low last year, but otherwise the largest crop since 1947. Indicated prcduction is below last year in all of these States, except ~labama where the bearing acreage is up sharply in Chilton and Blount Counties, the principal commercial areas.' Oklahoma is the only State where ,the 1959 crop is expected to be below average.
MILK PRODUCTION: Milk production on farms du,ring April totaled 11,171 million pcunds--fractiona11y below, the same month last year, but 5
perqent above the 1948-57 average. The seasonaJ. increase from 11arch to April this year was about the same as a year earlier, but was less than usual for the period. Production this ~pril represented an equivalent of 2.11 pounds of milk available daily for every person in the United States. This was 2 percent less than in April 1958 and was 6 percent below the la-year average for the month. Cumulative milk' production during the first 4 months of 1959 totaled 40.9 billion pounds as com~ared with .41.0 billion pounds produced in January-April 1958.
POULTRY AND EGG PRODUCTION: Farm flocks laid 5,797 million eggs during April
5 percent more than in April 1958. All regions showed
increases over last year. Increases were 10 percent in the South Atlantic region, 8 percent in the South Central, 7 percent in the West, 5 percent in the East North Central, 4 percent in the West North Central; and 3 percent in the North
Atlantic' States. Total egg production Januar,y through hpril 1959 was 6 percent '
above the same period last year.
...
~EL
3/S-
'HD9tJ07
9~3 (GJE (Q)~(GllA CIffiJ) ]p) ~rrN~ E~VllC1E
'oJ /3 AGRICULTURAL EXTENSION SERVICE
I UNIVi::RSITY OF' GEORGIA AND THE
STATE DEP~RTMENT OF AGRICt,H.TURE
.." "~
'
i :';(,
.... :
MAY 1 j '59
UBRARfE$ ,J"
. S. DEPARTMENT OF AQRICULTURE GI1ICULTURAl. MARKETING SERVICE 31:) EXT~1'lSION BLDG., ATHENS. GA.
, ' 0, " May 13, 1959
VEGETABL E' CROP REPORT, FOR MAY 1J 1959 . I'
.1,
UNtTED -STATES: Pro~uction of spring vegetqblc:;s in 1959 is expected to.be 6 pel"-
cent below last year but, about equal. to avcr9ge" the Crop Reporting-Board an~o~nced' today. Estima~ed ~roduction, excluding melons, is only 1 percent below 1~5? Crops with substantiall,y, s"'!aller.expected pr<;>.du,ction ~tiaii,las't year tlre tomatoes, sweet corn, cucumbers', snap. beans al')d, onions~ ... Sizeable in
creases over last 'year are predic'td for celery and ,lettuce. 'The 'forecast for 'late ~L!ls ,watermelons i5 one-fourth below last ,year's record productlon. Hater!flelon acreage for'harvest in the summer p'r,oducing States is 15. percent below last year. Other ~mcir season crops with"Coris'i.derablY', less ~creage for harvest than
in 1958 are cabbage, cantaloup, and green ,peppers. A larger acreage is expected to be devoted to onioris.
'Weathe~ conditiorls in the vegetable producing areas of the nation were gener-
,ally favorable: during April. The first week of the month continued,the March
pattern witH above normal temperatures. Tempera~~r,s dropped below normal in most of the 'country durin~ the rema~nJer of April but continued above normal i~ the, far
West and Northeastern Stat~s. , Heavy precipitatipn occurred along the Central East
Goast and extended through the SouthQastern States to the Gulf Coast and Louisiana.
The rest of the country received 1 ight rainfall'.
.
,
,NAP BEAN1: Mid-spring product'io,n,' fore'cast at 335,000 ,cwt., is 3 percent below
TaSt year-and nearly a fifth l,ess than average. The South Carol ina
crop is i'n yery good'condition. Early plantings in the Chaerle,s.ton area were start-
ing to bloom on May I and movement is expected to begin about J!.Jne I., In Georgia,
dool, wet weather has retarded growth and delayed bloom. Harvest was cxp~cted to
start In early May. Crop prospe~ts are good in Alabama and Mississippi. Light,
harvest is expected to begin in Mississippi the latter part of May. In Lbuisiana, pick~ng was expected to stQrt in eari~ May with v~lume movement the. latter half of
the month.
CMBAGE: Early spring production is now forecas~ at 2,,167,000 cwt., 4 percent
above last year b4t' 12 percent below average. The South Carolina crop
has started to move. Qualify is good 'but heads are smaller than usual. Harvest
in Georgia Is well underway with good qual ity be(n,g produced. Cutting is under-
'-..lay in Alabama's Mobile' County and is expected to 'start in Chilton County in late
~ay. In Mississippi, the crop is in good condiiion. Heads are sizing well and
good yields are expected. Hovement started in late'April and is expected to end
in late: May. May movement from Louisiana' i,s expected ,to continue heavy. In
of ,Ca 1i fo~n ia, sh i pnl~nts a re dec 1in i ng but volume supp 1ies a re expected to cont inue
available during most May. .
'
C.\NTI\LOU'PS: Acre'age (or harvest this year in the early summer States is forecast
at 20,500 acres. This is 24 percent below the 1958 harvested acreage
and 7 percent less than average. Acreage in eQch of the States is less than last
year. At ,],,000, the South Carol ina acreage is 5 percent below la'St year,. The lanti!"'g of" 8,000 acres .in Georgia is 11 percent below that harvested in' 1958 . ne Georgia acreage was planted late because of unfavorable weather conditions. Stands are good but growth has been slow ~s a result of cool weather. Harvest is expected to start about a week later than normal. Acreage in Arizona is about half of last year. Stands arc good and plants are in good condition. In the Phoenix area the acreage is less than a third of last year and at Theba, the acreage for 1959 is less than a fifth of 1958. Other areas in Arizona have sl ightly larger acreages than last year.
SWEET CORN: The first forecast places production of late spring sweet corn at 818,000 cwt., only 2 percent above last year and average. In Georgia,
rains and cold weather delayed planting and retarded growth of early plantings. Some replanting was necessary. The importnnce of growing worm-free corn is being stressed this year by shippers. The crop is reported to be at least two weeks later than normal. Similar growing conditions have prevailed in Alabama and South Carolina. The Cal ifornia crop is reported to be in good condition in all areas. Light harvest has been underway in Calpatria and the Coachella Valley. It is now becoming active in Coachella Valley where the bulk of the acrenge is being grown. Blythe an~ Arvin will begin harvest later this month.
O!IONS: Production of late spring onions is forecast at 2,896,000 cwt., nearly a fourth more than last year's production and 44 percent above average.
~ost North Carol ina fields have irregular stands, although the crop is in good condition. In Georgia, harvest started the last week in April and by May 1 about half of the crop had been dug. Yield prospects are good. Harvest in north Texas is expected to start in late May and volume movement should be under way by midJune. Movement from the Munday-Haskell area will start the latter part of May and continue through the first half of June. In ArIzona, harvest started at Yuma about
(over)
- 2-
ONIONS (Con Id) April I. Hot weather caused seeder trouble on a few fields but qual ity and yield have been generally good. Harvest in the Salt
River Valley started in late April. The California crop is in good condition and yields on fields harvested to date have been very good. Harvest is ~ow active at Blythe and Imperial Val~ey. Movement will continue to increase in early May. Harvest in Kern County started late in April. The crop in tne Stockton area has ,made excellent growth. Harvest of yellows was expected to start in early May.
TOMATOES: Late 2,Ering production is forecast at 830.000 cwt . which is a 'third less than produced, last year and down 39 percent from average. The
lower production resulted from an acreage decl ine of 38 percent. Texas has .only about a third of last year's acreage and Georgia is down approximately 30. per- , cent. In ,South Carol ina the crop is growing well and stands are very good., In Georgia. weather conditions were very unfavorable for setting tomat~es. Early" plantings are beginning to grow and some of the lateness of the crop is expected to be overcome and reach a near normal schedule for harvest. Harvest is expected to begin in early June. Mississippi tomatoes have been hard hit by the rains and cold weather around mid-Apri 1. In east Texas. setting of plants to the field~ started the latter part of March. Transplanting in the Avery section will continue into May. With favorable weather the last half of April. the crop made good progress in all areas. Crops in the Yoakum area will furnish production beginning around mid-May. Production in east Texas is expected' to start in early June and continue Into early July.
WATERMELONS: The first forecast of the late spring crop in Florida and Cal iforni~, places production at 7.750.000 cwt a fourth less than was pro-
duced last year but 4 PGrcent above average. Florida. with a sharply reduced . acreage. expects 29 pe,rcent fewer melons this year than last whereas Cal ifornia will have 13 percent more. Weather conditions have delayed the crop in all areas of"Florida. Cool nights are still slowing growth. Rate of harvest in South Fl,orida is increasing and should be most active May 1 to 15. with late fields
~ontinuing thro~ghout the month. Light harvesting'is starting on the southern portion of the central Florida area. but it will be about May 25 before the active season gets underway. A few early fields in the Ocala-Gainesville area will start the last week of May but will not be active until the second week of June. First harvest in Trenton-Newberry are is expected the second week of June. Very little harvest will start in other North Florida sections before June 15. becoming active the week of June 25. Watermelons in the Desert areas of Cal ifornia are making excellent progress and I ight supplies may be available by May 10. General harvest is not anticipated prior to May 15.
Prel iminary acreage in the ~ 1~~ States. estimated at 274.900 acres. is a 1ittle und~r growers intentions in March. Acreage at this level is 15 percent below last year and 5 percent less than average. All States except Louisiana and Cal ifornia have less acreage than a year ago. Rains and cool weather in the Southeast made planting and obtaining good stands difficult. Some replanting was necessary.
ARCHIE LANGLEY Agricultural Statistician In Charge
L. H. HARRIS. JR. Vegetable Crop Estimator
.
G, d--.-. --.- ~l ._- .......... - -~ - ",."
I / c)
!I~I,'I.
"I
{,t,
'r ".1,(
,...,.,~,..,.1 .->~.,...,".~.~~t.(/,A ...~'.\a"\,,,_,..._''
I \\,.~~\\l ;{.'I: :.- \: ~ ~ ' /' rJ....
,
_, 'r '" :-\'"
~ ' { 1; ~ T '~;tl';'.' ,-~,t\. ' - '_."-'
;i', 1I'\\\"/~ ,," ilh
,I;
/-,
, '\1" \'
."(::
~ .~_ ''\'
--- ..'.;,
,~\..'.,.'-:1,I0't~~4'r~'1..(C4'\1.,1..
~
', ,'"~ ~~: ',-.'",
\;\j ~ ~ 1< L J G E 0 R G I A C R 0 PRE P 0 R T I ll'I' R ,~Po 'R V l' P.I ~.:-JJ I \ j MAY2 1 '59 J-J ;-\-f Cr"B~S'J . ~ Release 5/20/59
GEORGIA CHICK HA TCHER Y REFOR T
Athens, Ga., May 20 -- A total of 7,165,000 broiler chicks were placed
with yrodl,1cers in Georgia during the week ending May 16, according to the Georgia Crpp Reporting Service. This compa:':'es with the 6,996,000 placed the preyious '1.reek and is 1 percent less than the 7,237,000 placed the same week last year.
Eggs set by Georgia hatcheries amounted to 9,251,000 compared with 9, 570, 000 the previous week and is 4 percent less than the 9, 589,000 for the corre spon.,ding week last year.
The ,majority of the prices paid for Georgia produced hatching eggs were reported within a range of 35 to 50 cents with an average of 45 cents for all hatching eggs and 42 cents for eggs purchased at the farm from flocks with hatchery owned cockerels. Last week the range was from 35 to 50 cents with an av:~rage of 44 cents for all hatching eggs and 42 cents for eggs purchased at the farm from flocks with hatchery owned cockerels. Most prices charged for chicks were reporte:d within a range of $6. 25 to $8.00 with an average of $7.25 per hundred compared with a range of $5.00 to $8.00 with an average of $6. 75 per hundred last week. The average prices last year were 82 cents for eggs and $14.25 for chicks.
- W~ighted average prices from the Federal-State,'Market News S~rvice for broilers during the week ending May 16 are as follows: Georgia broilers 2 3/4 3 3/4 pounds, at farms 15. l8~; FOB plants 16.,44~.
,
Week Ending
GEORGIA EGGS SET, HATCHINGS, AND 'CHICKS PLACEMENTS'
BROILER TYPE
EGG TYPE
Eggs Set !!
1958
1959
11959 %
'of 1958
'Chicks Placed for Broilers in Georgia
1958
1959
1959 0/0 of 1958
Eggs Chicks Set Hatched
..
1959 1959
Thou. Thou. Percent Thou. Thou. Percent Thou. Thou.
Mar.14 Mar.21 Mar.28 Apr. 4 Apr. 11 Apr. 18 Apr.25 May 2 lviay 9 May 16
8,474 8, 586 8,733 8',954
9, 141 9,265 9, 544 9,428 9,204 9,589
10,030
9,925 9,979 9,900 9,710 9,778 9,480 9,632 9,570 9,251
118 6,015 7,094 116 5,840 7,305 114 6, 103 ' 7,440 111 6,468 7, 173 106 6,,695 7,382 106 6,709 7,477 99 6,826 7,319 102 6,857 7,244 104 6,934 6,996
96 17,237 7, 165
118 125 122 111 .. 110 III 107 106 101
99
864 670 923 702 793 764 706' 706 685 723 725 669 559 588 574 513 395 423 373 494
I
11 Includes eggs set by hatcheries producing chicks for hatchery supply flocks.
ARCHIE LANGLE Y Agricultural Statistician In Charge
W. A. WAGNER Agricultural Statistician
u-.--S-.--D-e-p-a-r-t-m-e-n--t -o-f-A--g-ri-c-u-l-t-u-re-
-
-
-
-
-
-
-
-
-
-
-
-
-
-
-----------------------------
Agricultural Extension Service
-
Agricultural Marketing Service
State Department of Agriculture
31~ Extension Building, Athens, Georgia
-------------------------------------------------------------------------
STATE
EGGS SET AND CHICKS PLACED IN COMMERCIAL AREAS.. BY WEEKS - 1959 p
2
Week Ending
May
Z
May
9
May
16
EGGS SET - THOUSANDS
Apr.
11
Apr.
18
Apr.
Z5
May
Z
May
9
, CHICKS PLACED - THOUSANDS
May
16
Maine
1,61Z 1, 619 1, 581
1, 187 I, Z15 1,350 I,Z34 I,Z40 I, Z3Z
Connecticut Pennsylvania
1,011 1,443
1, 123 I, Z56
1,060 1,443
596
598
60Z
666
636
566
865
9Z7
735
819
736
855
Indiana
1,968 1,947 1,975
911
871
930
843
873
775
Illinois Missouri
Z86 1,678
ZZO 1,756
ZZ4 1,837
18Z
Z18
173
191
106
144
88Z
748
711
843
70Z
78Z
Delaware
1,99Z 1,96Z 1,956
1,833 1,985 l,7Z0 1,986 1,996 1,908
Maryland Virginia West Virginia
Z,63Z ,.377
330
2.604
2.478 345
2, 711 Z,484
344
1.904 1.247
676
1.7Z9 1,072
68,1
1,914 1,025
694
1,711 1,220
601
1,649
I, 197 633
1,637 I, Z41
737
North Carolina
3,789 3, 581 3,8Z3
3,332 3,Z87 3.313 3,213 3.300 3, 128
South Carolina
529
573
571
375
390
138
326
320
336
GEORGIA
9,632 9,570 9,251
7,382 7.477 7.319 7,244 6,996 7, 165
.l!'lorida
41Z
400 . . 351
214
220
193
2Z2
205
196
Alabama
4,319 4,280 4,393
3,640 3,600 3,767 3,802 3, 506 3,493
Mississippi
3, 160 2,974 3, 165
2,657 2,633 2,690 .2, 531 2,267 2.416
Arkansas
4,215 4, 149 4,096
3,618 3,625 3,567 3.465 3, 527 3,479
Louisiana
600
605
718
488
485
468
550
485
396
Texas Washington Oregon California
2.,839 427 482
1,391
2.995 391 491
1,417
2,')84
421 482 1,443
2,473 329 280.
1,245
2,600
326 279 1, 173
2,627
418 250 I, 188
2,455
375 258 1,054
2, 131
369 219 1,055
2,023
343 244 1,- 091
Tc. TAL 1959 , TCTAL 1958
]")59 % of 1958
47, 124 50,089
94
46,736 50, 110
93
47,313 50,680
93
36,316 36, 139 35,992 35,609 34, 148 34, 187
33, 156 33,291 33,667 33,930 34,910 35, 504
110
109
107
105
98
96
_ urroc _
_ -"'6'.
i AXA
31 t;)
I
~/.,II.~,
.
"~
'"
,//~."'~-..:.-!.o..__~_
~(~
,.41/':'.:'" ", _. ''''
'1II II
I r .../1
... I ."", .'
I {~ /~r/~I.l' '\ "l\\\/~~~i'~\ I 1_:.'t...... .. '.
!:
t," _. " :i'i",
J:
~;, ....~''r
I. 1ft
11
J ,;'.,a,~!l
"I iJf',,1'.'~','\,\','"\.~.
.
.
........ "~\.v.
'~~,"~,,_,,~'"'~>'',
Lt. ~'v i'~
"
" Ir't,
"'ill","'"
i
. :-..'\;: t,;
GE 0 R GIA
E}E-JJ}<-\-LJ eyllr" ~V
C
R
0
PRE
P
0
R
'PI.V--I;N.
0 1
~ F.:J't Vi} C.E,
,r'T'{u,,(,lf
t,.;\L8'59
Release 5/211-59
GEORGIA CH!l;K HATCHERY REPORT
Athens, Ga. May 27 -- A total of 7, 053, 000 broiler chicks were placed with producers in Georgia during the week ending May 23, according to the Georgia Crop Reporting Service. This compares with the 7. 165.000 placed the previous week and is 1 percent less than the 7. 113,000 placed the same week last year.
Eggs set by Georgia hatcheries amounted to 9, 236, 000 compared with 9,251, 000 the previous week and is 5 percent less than the 9, 766,000 for the corresponding week last year.
The majority of the prices paid for Georgia produced hatching eggs were reported within a range of 40 to 50 cents with an average of 46 cents for all hatching eggs and 44 cents for eggs purchased at the farm from flocks with hatchery owned cockerels. Last week the range was from 35 to 50 cents with an average of 45 cents for all hatching eggs and 42 cents for eggs purchased at the farm fro~ flocks with hatchery owned cockerels. Most prices charged for chicks were reported within a range of $1. 00 to $8.00 with an average of $1. 50 per hundred, . compared with a range of $6. 25 to $8.00 with an average of $1. 25 per hundred last week. The average prices last year were 81 cents for eggs and $14.00 for chicks.
Weighted average prices from the Federal-State Market News Service for
broilers during the week ending May 23 are as follows: Georgia broilers 2 3/4-
3 3/4 pounds. at farms 15. 13f; FOB plants l6.00.
'
GEORGIA EGGS SET, HATCHINGS, AND CHICK PLACEMENTS
Week Ending
BROILER TYPE
EGG TYPE
Eggs Set !!
Chicks Placed for Broilers in Georgia
Eggs Chicks Set Hatched
1958
1959
1959 %
'of 1958
1958
1959
1959 %
of 1958 1959 1959
Thou. Thou. ~ercent Thou. Thou. Percent Thou. Thou.
Mar.21 . Mar.28 ~ Apr. 4 Apr. 11 I Apr. 18 Apr.25 May 2 . May 9 May 16 May 23
. 8, 586 8, 733 8,954 9. 141 9,265 9,544 9,428 9,204 9, 589 9,766
9.925 9.979 9,900 9,710 9.778 9,480
9.632 9, 570 9,251 9,236
116 5,840 1,305
125
114 6, 103 7,440
122
III 6,468 1, 173
III
106 6,695 1.382
110
106 6,709 7,471
111
99 6.826 7, 319
107
102 6,857 7,244
106
104 6,934 6,996
101
96 7,237 7, 165
99
95
I 7, 113 7,053
99
923 702 793 764 706 706 '
685 723 125 669 559 588 574 513 395 423 373 494 280 435
1/ Includes eggs set by hatcheries producing chicks for hatchery supply flocks.
ARCHIE LANGLEY Agricultural Statistician In Charge
W. A. WAGNER Agricultural Statistician
------------------------------------------------------------------._-----
u. S. Department of Agriculture
Agricultural Extension Service
Agricultural Marketing Service
State Department of Agriculture
319 Extension Building, Athens, Georgia
--------------------------.--------------------.-----------------.--------
.
STATE
. EGGS SET AND CHICKS PLACED IN COMMERC!AL AREAS,
' ..
..
..
"
.,
..
.'
.~
,
-.
".,
Week E!lding , .
,BY
WEEKS ..,
"
-
1959
;
Page 2 1 ,,
:
May 9
May 16
May 23
Apr. 18
Apr. 25
May 2
May 9
May 16
May 23
EGGS SE T - THOUSANDS
CHICKS PLACED - THOUSANDS
.
Maine Connecticut Penns ylvania
1,619 1, 123 1, 2.56
1, 581 1,660 1,443
1, 557 1, 101 1,443
1,215
598 92.7
1,350 602. 735
1,234 666 819
1,2.40 636 736
1, 2.32.
566 855
1,2.40
533 , 888
I t
Indiana
)
n
Illinois
1,947 2.2.0
1,975 2.2.4
1,937 2.61
871
930
843 . 873
775
885
218
173
191
106
144
99
"
Missouri
1,756 1,837 1,755
748
711
843
702
782
756
"
Delaware
1,962. 1,956 1,92.9
1,985 1,720 1,986 1,996 : 1, 908 1,672.
Maryland
2.,604 2., 711 2,918
1,729 1,914 1, 711 1,649 .1, 6'37 1,884
Virginia
2.,478 2.,484 2., 52.9
1, 072. 1,025 1,2.20 1, 197 1,241 1, 251
West Virginia
345
344
362.
681
694
601
633
737' 585
North Carolina
3,581 3,82.3 3,935
3,2.87 3, :H3 3,213 3,300 3, 128 2.,933
30uth Carolina
573
571
532.
390
338
32.6
320
336
337
GEORGIA
9,570 9,251 9,2.36
7,477 7,319 7,244 6,996 7, 165 7,053
~~lorida
Alabama
Mississippi
Arkansas
Louisia Texas
n, a
,
Washington
Oregon
California
400
4,280 2,974 4, 149
605 2.,995
391 491 1,417
351
395
4,393 4,421
3, 165 3,087
4,096 4,2.26
718
702
2.,984 3,2.06
421
427
482. : 484
1,443 1,388
220
3,600 2,633 3,625
485 2,600
326 279 1, 173
193 3,767 2.,690 3, 567
468 2,627
418 250 1, 188
2.22 3,802. 2, 531 3,465
550 2,455
' 375 258
1,054
205
3, 506 2,267 3, 527
485 2, 131
369 219 1,055
196
3,493 2,416 3,479
396 2,023
343 244 1,091
211 3,446 2,498 3,428
394 2,097
399 244
995 .
TOTAL 1959
TOTAL L958
,
1959 % 0.1 1958.
46,736 47,313
50, 110 .50,680
93 --,
93
47,831 51,017
94
36, 139 35,992 35,609" 34, 148 34, 187 33,828
33, ~~.1
33,667
-'
33,930, '34,910 35, 504 '36,390"
.
.. .
'.
I
'" 1
,
'.
.J
. '0
'.
~
.', !.
109
'IQ7
:105: . ' 98 '
96
93
ACREAGE AND INDICATED PRODUCTION REPORTED TO DATE, 1959 WITH COMPARISONS
CROP AND
ACREAGE FO. R HARVEST
YIELD PER ACRE:
PRODUCTION
STATE :Average:
Ind. : Av.:
: Inci:Average:
: Ind.
: 1949-57: 1958 : 1959 :49-57: 1958 : 1959: 1949-57: 1958 : 1959
SNAP BEANS:
- Acres -
- Cwt. -
- 1,000 cwt. -
MId- Sp ring:
South Carol Ina: ],720 5,800 5,600 20 20 25 157
116 140
Georgia
: 4,890 3,900 3,300 17 19 15 83
74 50
Alebama
: 1,200 850
750 21 23 22 26
20 16
Mississippi : 2,780 1,900 1,700 24 28 25 65
53 42
Louisiana
: 3,360 3,000 ~,100 24 28 28
81
84 87
Group Total : 19,940 15,450 14,450 21 22 23 412 347 335
CANTALOUPS:
Early Summer: :
SOuth Caro]l~a~: 5,910 7,400 7,000 34 35
199 259
Georgia
: 8,530 9,000 8,000 55 55
467 495 Jun. 10
Arizona, Other: 7,680 10.500 5,>00 110 50
849 525
Group_Total : 22, 120 26, 9000_~500 _ 67__ 48
I ,515.. 1,279
SWEET CORN:
Late Spring:
South Carol ina: 2,110 1,300 1,200 44 40 40 93
52 48
Georgia
: 2,100 2,300 2,600 30 31 30 63
71
78
Alabama
: 4,000 3,600 3,600 44 60 50 174 216 180
California
: 6,820 6,200 6,400 2 75 80 472
465 512
Grou~otal : 15JuQ39 __lJ,400 .... 13,800 54 60 59 802 CUCUMBERS:
804 818
~ate Spring:
North Ca ro 1ina 5,580 6,700 6,700 47 40 40 259 268 268
South Ca ro I Ina 4,160 3,200 3,000 45 50 50 187
160 150
Georgia
830 700
600 34 30 32 28
21
19
Alabama
990 600
500 55 60 60 55
36 30
.Arkansas Louisiana
570 --630 600
--- 45 --- ---
27
650 48 55 55 31
33 36
Cal ifornia Group Total
ONIONS: 17
1,430 1,800 1,700 194 195 200 279 351 340 14,200 13,600 13, 150 61 64 64 86,-------a-og-----843
Early Spring:
Texas
36,760 27,000 32,500 66 95 55 2;267 2,565 1,788
Late Spring:
North Carol ina :2/ 800 2,300 1,000 75 75 80 60 172 80
Georgia
: 1,000 800
600 85 90 95 85
72 57
Louisiana
: 190 ---
--- 47 --- ---
9
Texas
: 7,690 4,700 3,100 32 25 32 253 118 99
Arizona California
: 1,280 2,700 2,500 313 270 315 397 729 788 : 4,470 4.700 5,200 291 265 360 li~59 1,246 1,872
Group Total : 14,710 15,200 12,400 139 154 234 2,010 2,337 2,896
TOMATOES:
L~te Spring~
South Carol ina: 4,720 6,300 6,200 36 32 35 170 202 217
Georgia
: 11,740 13,000 9,000 39 45 40 458 585 360
Mississippi : 1,640 1,800 1,200 30 21 35 47
38 42
Louisiana Texas
: 1,180 1,300 1,300 40 40 40 47 : 20,920 14,600 5,300 2~ 2~ 30 638
52 52 365 159
Group Total : 40,210 37,000 23,000 3 3 36 1,360 1,242 830
WATERMELONS:
Early'Summ~r:
:
N6rth 'Carol ina.: 11,160 15,000 13,500 50 60
555 900
South Carolina: 41,890 42,000 35,000 54 60
2,264 2,520
Georgia
I 54,000 63,000 50,000 78 85
4,190 5,355
Alabama
: 17,460 21,000 19,000 91 95
1,577 1,995
Mississippi : 11,040 16,000 12,000 70 65
773 1,040
Arkansas
: 10,320 13,000 11,500 85 85
874 1,105 Jun.l0
Louisiana
: 4,430 4,200 4,200 77 80
342 336
Oklahoma
: 14,520 11,500 8,700 64 65
946 748
Texas
: 109,220 119,000 102,000 47 50
5,096 5,950
~rizona
: 5,170 7,400 7,200 146 95
757 703
California : 10,480 11.000 11,800 140 160
1,464 1,760
Group Total :289,690 323,100 214,900 65 69
18,836 22,412
'I Includes processing.
~I Short-time average.
.... . ~ -;
"
-,
0"
-,
"t I, "
.,
3/0
CGE(Q)JRi(GllA (C JP&(Q) jp) 1R{IE:JP>(Q)~Tll1M(G IE~VllceIE
AGRICULTURAL EXTENSION SERVICE UNIVERSITY OF GEORGIA AND THE STATE DEPARTMi::NT OF AGRICULTURE
Athens, Georgia
U. S. DEPARTMENT OF AGRICULTURE AGRICULTURAL MARKETING SERVICE 319 EXTENSION BLDG., ATHENS, GA.
KAY' 1959
--.........&
GEORGIA FLUE-CURED TOBACCO: 1958 PRELIMINARY COUNTY ESTIMATES
!
District
Harvested
Yield
Production
Caonudnty
Acreage
PeLr bAs.cre
(000 1bs. )
DISTRICTS I,
.!!z..}II & IV
DISTRICT V Dodge Johnson Laurens Montgomery Treut1en \fuee1er
Total
DISTRICT VI Bulloch Candler Effingham Emanuel Jenkins Screven
Total
DISTRICT VII Baker Decatur Dougherty Grady l'1itche11
Ste\~art
Thomas
Total
DISTRICT VIII Atkinson Ben Hill Berrien Brooks Clinoh Coffee Colquitt Cook Crisp Echols Irwin Jeff Davis Lanier Lowndes Telfair Tift Turner Wilcox Worth
Total
o
o
o
130 30 95 615 460 240
1,570
2,560 1,410
95 .. 995 ..
90 30
5,180
5 255 10 1,130 1,870
5 1,350
4,625
1,292 1,267 1,379 1,312 1,211 1,371
1,293
1,417 1,591 1,379 1,388 1,367 1,167
1,456
1,200 1,082
900 1,429 1,520 1,600 1,466
1,456
168 38 131 807 557 329
2,030
3,628 2,244
131 1,381
123 35
7,542
6 276
9 1,615 2,843
8 1,979
6,736
1,035 630
3,525 1,720
135 4,065 4,850 2,515
20 290 1,790 1,845 . 995
3,080 320
2,425
75 85 1,450
1,592
1,317 1,408 1,462 1,289
1,538 1,704 1,603
1,450 1,403 1,569 1,778 1,260
1,354 1,300
1,375 1,253 1,035 1,448
30,850
1,~.J
UNMRSITY 0
(continued) MAY 2 q '59
lIUHARIES
1,648 830
4,964 2,515
174 6,253 8,265 4,031
29 407 2,808 3,281 1,254 4,171 416 3,335 94 88 2,100
46,663
to.
"".. 1 .r
- 2-
.... ,
GEORGL~ FLUB-CUPJW--TOBACCO: 195~preliminary County Estimates
. District and County
Harvested Acreage
Yield Per Acre
Lbs.
Production (OOOlbs.)
DISTRICT IX
Appling Bacon Brantley Bryan Charlton Chatham Evans Liberty Long Pierce Tattnal1 Toombs tV'are Wayne
2,085 1 j 885
875 145 105
5 960 60 2"..J";>-
2,910
2,725 1,490 1,180 1,115
1,683 1,782 1,690 1,269
1,514 1,200
1,518 1,367 1,557 1,868
1,659
1,475 1,744 1,637
3,509 3,359 1,479
184
159 6
1,457 82 366
5,437 4,520 2,198 2,058 1,825
Total
15,775
1,689
26,639
STATE TOTALS
58,000
1,545
89,610
CARL O. DOESCHER Agricultural Statistician
ARCHIE LANGLEY Agricultural Statistician In Charge
...'
--.:.,......,.......- - : c : : - - - - - - - - .
"f'
-.. -I' - ,.I .. \\., -' j ., . ......
~ -~"-
.I \'"
"'-.
\,...
:--~':t~~- ,..,.-~--',l'-~11..\ ~__ \~\..,, I
- - ., .
3/J-
GEORGIA CROP REPORIFING 3El\}'1ICE
1< \/\/ ~r ~~J ~J\j JUN 4 '59 LIBRARIES J-J }-\-rCHERY
Release 6/3/59
GEORGIA CHicK HATCHERY REPORT
Athens, Ga., June 3 -- A total of 6,951,000 broiler chicks were placed with producers in Georgia during the week ending May 30, according to the Georgia Crop Reporting Service. This compares with the 7,053,000 placed the previous week and is 3 percent less than the 7, 151, 000 placed the same week last year.
Eggs set by Georgia hatcheries amounted to 9,236,000 compared with
9,236, oqo the previous week and is 4 percent less than the 9,668,000 for the
corresponding week last year.
The majority of the prices paid for Georgia produced hatching eggs were reporteq within a range of 40 to 54 cents with an average of 48 cents for all hatching eggs' and 45 cents for eggs purchased at the farm from flocks with hatchery' owned cockerels. Last week the range, was from 40 to 50 cents with an average of 46 cents for all hatching eggs and' 44 cents for eggs purchased at the farm' from flocks with hatchery owned cockerels. Most prices charged for chicks were reported within a range of $7.00 to $9.00 with an average of $8. 00 per hundred compared with a range of $7.00 to $8.00 with an average of $7. 50 per hundred last week. The a verage prices last year were 80 cents for eggs and $14.00 for chicks.
W~ighted average prices from the Federal-State Market News Service for broilers during the week ending May 30 are as follows: Georgia broilers 2 3/43 3/4 pounds at farms 14. 7 5f.
GEORGIA EGGS SET, HATCHINGS, AND CHICK PLACEMENTS
I
BROILER TYPE
.,
EGG TYPE
Week Ending
..
!J 1 Eggs Set
1958 Thou.
1959 Thou.
1959 %
of 1958
Percent
Chicks Placed for Broilers in G.=orgia
,1958
1959
'1959 %
of 1958
Thou: Thou. Percent
Eggs Chicks Set Hatched
1959 1959
Thou. Thou.
Mar.28 Apr. 4 Apr.11 Apr. 18 Apr. 25 May 2 May 9 May 16 May 23 May 30
8,733 8.954 9, 141 9,265 9, 544 9,428 9,204 9,589 9,766 9,668
9,979
114
9,900
III
9,710
106
9,778
106
9,480
99
9,632
102
9, 570
104
9,251
96
9,236
95
9,236
96
I
',6" 103 6,46? 6,695 6,709 6,826 6,857 6,934 7,237 7, 113 7, 151
7,440
122
7, 173
III
7,382
110
7,477
III
7,319
107
7,244
106
6,996
101
7, 165
99
7, 053
99
6,951
97
I
793 764 706 706 685 723 725 669 559 588 574 513 395 423 373 494 280 435 239 184
1/ Includes eggs set by hatcheries producing chicks for hatchery supply flocks.
ARCHIE LANGLEY Agricultural Statistician In Charge
W. A. WAGNER Agricultural Statistician
-------------------------------------------------------------------------
U. 5. Department of Agriculture
Agricultural Extension Service
Agricultural Marketing Service
State Department of Agricultur e
319 Extension Building, Athens, Georgia
-------------------------------------------------------------------------
STATE
EGGS SE T AND' CHICKS PLACED IN COMMERCIAL AREAS, BY WEEKS - 1959 -.
Week Ending
Page 2
May 16
. May 23
May 30
Apr . . May
25
2
May 9
May 16
May 23
May 30
EGGS SET - THOUSANDS,
CHICKS PLACED - THOUSANDS .
Maine
1. 581 1.557 1,528
1,350 1,234 1,240 1,232 1,240 1,267
Connecticut
1,060 1, .10 1 I, 105
602
666
636
566
533
664
Pennsylvania
1,443 1,443 1,256
735
819.
736
855
888
186
Indiana
1,915 1,931 1,859
930
843
:813
115
885
159
Illinois
224
261
234
173
191
106
144 . 99
135
Missouri
1,831 1,755 1,732
111
843
102 182
756
610
Delaware
1,956 1,929 1,817
1.120 1,986 1,996 1.908 1,612 1,753
Maryland
2,111 2,918 2,885
1,914 1,111 1,649 1.631 1,884 1,832
Virginia
2.484 .. 2. 529 2,398
1.025 1. Z20 1. 191 1,241 l,251 1, 223 .
West Virginia
344
362
334
694
601
633
731
585
123
North Carolina
3,823 3.935 3,903
3. 313 - 3.213 3,300 3, 128 2,933 2,998 .
South Carolina
511
532
480
338
326
320
336
331
365
GEORGIA ..
9,251 9,236 9,236
7,319. 7,244 6,996 7, 165 1.053 6,951
Florida Alabama Mississippi Arkansas Louisiana Texas
Washington Oregon California
351 4,393 3, 165 4,096
118
2,984 421
482 1,443
395 4,421 3,087 4,226
702 3',206
421
484 1,388
394 4.215 2,973 4,050
665 .-
3,21~
394
493 1, 561.
193 3,767
2,690 3,561
_468 2,627
418 250 .1, 188
222 3,802
2. 531. 3,465
550 2,455
375 258. I,OS4
205 3.506 2,267
3, 527 485
2, 131
369 219 1,055
196 3,493 2,416
3,419
396 2,023
343 244 1,091
211 3,446 2,498
3,428
394 2,097
399 244 995
188 3,404 2,465
3,501 423
2,200 311 221 987
TOTAL 1959 TOTAL 1958
1959 % of 1958
41,313 50,680
93
41,831 51,011 .. 94
46,788 51, 233
91 ~ .
35,992 35,60.9. 34, 148 34, 181- 33, 828 33,892 33, f7 33,930 34,910 35, 504 36,390 36, 532
101
105
98
96
93
93
'j,-
g CG1E(Q)~CGHA (C~(Q)~~E-~~1rllN(G [~VllCClE
AGRICULTURAL EXTENSION SEFlVICE UNIVERSITY OF GEORGIA AND THE STATE DEPARTMENT OF AGRICULTURE
Athens, Georgia
FARM PR..I~
oJ'L'."i~ 9 '59
LIBRARIES REL'..=PO=R=T-jtSl)~
U. S. DEPARTMENT OF AGRICULTURE AGRICULTURAL MARKETING SERVICE 319 EXTENSION SLOG., ATHENS, GA .
June 8, 1959 15, 1959
GEORGIA: The All Commodity Index of Prices Received by Georgia farmers increased five points to 258 percent of its 1910-1914 average during the month
ended May 15, 1959. Lower prices for wheat, oats, rye,hay, cattle, chickens, eggs, wholesale milk and turkeys were more than offset by the higher prices received for the important commodities of corn, cotton, and hogs. The May Index of
258.was nine points (3 percent) below a year earlier
The mid-May average price of $15.50 a hundredweight for hogs was a small increase in price over the previous month, and tended to reflect the declining receipts at auction markets and packer plants. Over the ten-year period (1949-58) the mid-May price of hogs has been higher than the mid-April price eight times.
UNITED STATES: During the month ended May 15 the Index of Prices Received by Farmers rose four-tenths of a percent (1 point) to 245 percent of
its 1910-14 average. Sharply higher prices for potatoes,combined with higher pri~es for,oranges, new crop cantaloups and watermelons,and for cattle were primarily responsible for the increase. Partially offsetting were seasonally lower prices for milk and sharply lower prices for eggs, tomatoes and onions.
The Index of Prices Paid by farmers for Commodities, Interest, Taxes,and Farm Wage Rates remained steady at the record high of last month. A 1 point decline in the production goods component was offset by a 1 point increase in the family living portion. lbe index was about 1 percent higher than a year earlier.
Summary Table for Georgia and the United States
Index 1910-14 = 100 UNITED STATES:
May 15, 1958
April 15, : May 15,
1959
: 1959
Record High Index' : Date
GEORGIA
Prices Received
All Commodities 267
2S3
All Crons
27
271
Livestocl~ and
258
310 Mar. 1951
2(30
319 : 3/Mar. 1951
Products
: 246 :
214
:
211
: 295: Sep .1948
~ Prices Paid, Interest, Taxes, and Wage Rates based on data for the indicated
dates. 2/ Also May 1959. 3/ Also April 1951.
NOTE: The UNITED STATES Indexes presented herein are those described in the Januar~ 30, 1959 issue of Agricultural Prices, Supplement 1, pages 39-44, "The R vision of the Indexes of Prices Received by Farmers and the Index
of Prices Paid by Farmers including Interest, Taxes, and Farm Wage Rates."
Current Parity Prices are computed from the revised index series.
ARCHIE LANGLEY Agricultural Statistician In Charge
RAYMOND R. HAi'iJ'COCK
Agricultural Statistician
.' ,:
.
PRIC!JS RECEIVED BY F.!l.liMERS tA:J.y 15, 1959 WITH COUPARISONS .;
__
.
II.' _.
_._.
:..._......-..:.-..~~~.l'~~
'GEO~GI!l. , , ' '.
~riElD, ..S~~S
'._"-
"CCiiMODfXY'-:--"-'---.' lAvcro.ge lMay 15'T:.:IAPr.i5-jM;.Yi5-1'-IA';e~age 'llIay '15":',]~r:15 jMO.Y15--
AWN ITD '
-~';eat: bu.
. 11910-14'
$' 1.23
1958 2.01
1.ntw ! 1959
j
1959
~191o..14 I
lI
19.58 , '
. 1959
; ,1959
I
1.96 1.90 ', --:664; 1.93
i
Oats, bu.
$ .67
Corn, bu
'.
.$ .9i
Barley, bu..
$
Sorghum Grain, owt.' $
.87! .84
I 1.50 1.30
1.25, .1.20 2.30 2.15
. .82 " .399
1.34 1.20
II
.642 .619
I - 2.10
~,594
1,.1~~569
' .602j I
.599
;1.13 I 1.15
'.8981 .901
1.76 I 1.80 I 1.85
Cotton, lb. Cotton'seed" t~n
Soybeans, bu..
Peanuts, lb.
12.1
i$ 23.65 $1 -
II 5.2
32.0 33.0 I -[ -
I 2.30, I 2.10
10.2
36.0 I_
I 2.15
12.4 II 22.55
I 4~'8
29.10
2.13 11.0
I 31.28 I 31.82
2.10 2.13 10.6 11.7
Sweetpotatoes, owt. $ , .84
Lespedeza ~eed'All,owt$1
I Ha1~' baled, per ton:
All
..., $
Alfalfa
$
Lespedeza
$
Soybean & Cowpea $
Peanut
$
Wool, lb.' ,
Milk. Cows, head
$1 33.85
5.60
11.50 14.90
I 28.20 .27.00 38.00 35.50 30.00 28.00 32.00 30.00 21~80 23.00
35.0 41.0
1150.00 1175.00
14.90
26.30 34.00 28.00 29.50 23.00
I
41.0
I175.00 :
I 1.60
'18.3
Hogs, cwt.
$1 7.36 20.80 15.40 15.50
7.?:7
5.93
17.70 17.40 22.70 29.30 4?2.00 35.8 2C8 .00
I
21.10
4.58 9.57
4.09 10.80
18.80 19.50
21.00 ?:7.70 20.30
18.40 19.10
20.50 26.50 20.20
39.2 . 42.7
235'.00 1238.00
15.60 15.50
Beef Cattle, cut.
, Calves, cwt;., : '.. ,
$! 3.96 $
20.00 2i.30 24.20 ?:7 .80
21.10 ' 26.50
5.42 6.75
23 .10 25.60
24.10 24.30
29.00 29.io
Milk,Whole sale, oWt i' ..
Fluid Mkt.
$
Manuf. Jill
$!,$ 2.43
Turkeys, lb.'
.
5.77 5.85 3.16 3.25 !l5.66 !lS.75
30.0 25.0
2/5.70 24 ..0
- 4.20
1.60' .1/32..7939
144 ?:7.3
2/3.74 22.4
Chiokens, per lb., Farm Com'l Broil. All
! 13.3
18.0 19.4 19.4
Eggs, 'dC?z.
21.4
53.
t~_ _
I
.!/ Reyised. z./ Pre1 iminary Est 1m1l.te
;,
13.5 15.5
15.5
11.4
16.0 15.5
,PRICES PAID BY Fl.mAERS FOR SElE.CTED JE!'::DSMay 15, 195~ WITH, CCW>ARIS(NS
">
" .GEOkGIA '
..
tNITED STATES
Poultry reed Brc ITer Growing Ms.-sh Laying Mash Scratch Grains
nHal {Baled) a fa luI otbel'
5.20 4.90 4.40
50.00 45.00
4.95 4.75 4.15
45.00 35.00
5.06
4.52
3.99
4.93 4.52 3.93
4.89 4.51 3.94
_-. ... ~.~-
._- .. _.....- , . -
LI 1:31"<1'.1"1 L;:)
's-
"=..
/:;;.......
:(
, '.
- '\: ,~:li... .
. \.,.."
71...~\"'1 5' .~,~ ~'.' ~~~ ..
1(: ,,"'\.
'~'\,'\\\'".
" I \Il1o(' . ~
.,,
'S~ ~.:.~?.~,,~
,..
",;',
- -.~
GEORGIA CROP REPORTING SERVICE
-r r \/\
j
~~ ~r
rI
J1< ~
Jr/\\
\f"
-'-.-rJrJ
~r '
Jr,\
\f
UNIVt"'"I'f _. 't:;:0,GIA
Release 6/10/59
,!I:N 11 '59
GEORGIA CHICK HATCHERY REPORT
LIBRARIES
Athens, Ga., June 10 -- A total of 7,002,000 broiler chicks were placed with producers in Georgia during the week ending June 6, according to the Georgia .Crop Reporting Service. This compares with the 6,951,000 placed the previous week and is 2 percent less than the 7,111,000 placed the same week last year.
Eggs set by Georgia hatcheries amounted to 9,276,000 compared with
9,236, 000 the previous week and is 4 percent less than the. 9.. 616, gOO-for the
corresponding weeklast year.
.., '- -'
The majority of the prices paid for Georgia produced hatching eggs were reported within a range of 40 to 60 cents with an average of 50 cents for all hatching eggs and 48 cents for eggs purchased at the farm from flocks with hatchery owned cockerels. Last week the range was from 40 to 54 cents with an average of 48 cents for all hatching eggs and 45 cents for eggs purchased at the farm, from flocks with hatchery owned cockerels. Most prices charged for chicks were reported within a range of $8.00 to $9.25 with an average of $8.50 per hundred compared with a range of $7.00 to $9.00 with an average of $8.00 per hundred last week. The average prices last year were 80 cents for eggs and $13. 75 for chicks.
Weighted average prices from the Federal-State Market News Service for broilers during the week ending June 6 are as follows: Georgia broilers 2 3/4 3 3/4 p<;>Unds, at farms 14. 46f.
GEORGIA EGGS SET,. HATCHINGS, AND' CHICK PLACEMENTS
Week " Ending
B~OILER TYPE
EGG TYPE,
, Eggs Set !J
Chicks Placed for Broilers in G~orgia
Eggs Chicks, Set .Hatched
1958
1959
11959 '10
of 1958
1958
1959
1959 %
of 1958
1959
1959
Thou. Thou; Percent Thou. Thou. Percent Thou. Thou.
Apr. 4 Apr. 11 Apr. 18. Apr.25 May 2 May 9 May 16 May 23 May 30 June 6
8,954 9. 141 . 9.265 9, 544 9,428 9,204 9. 589 9, 766 9,668 9,616
9,900 9,710 9,778 9,480 9,632 9. 570 9,251 9,236 9,236 9.276
111 6,468 7, 173 106 6,695 7,382 106 '6,709 7.477 99 6. 826 7, 319 102 6,857 7,244 104 6,934 6.996 96 7,237 7, 165 95 7, 113 7.053 96 7, 151 6,951 96 7. III 7,002
III . 110 111 107 106 101
99 99 97 98
706 706 685 723 725 669 559 588 574 513 395 423 373 494 280 435 239 184 245 169
!! Includes eggs set by hatcheries pl'\oducing chicks for hatchery supply flocks.
ARCHIE LANGLEY Agricultural Statistician In Charge
W. A. WAGNER Agricultural Statistician
u-.- -S-.- -D-e-p-a-r-t-m-e-n-t- -o-f -A-g- -r i-c-u-l-t u- -r e-
-
-
---------
-
-
------------------------------
AgricUltural Extension Service
-
Agricultural Marketing Service
State Department of Agriculture
319 Extension Building, Athens, Georgia
------------------------------------------------------------------------
ECGS SET AND CHICKS PLACED IN COMMERCIAL AREAS.0 BY WEEKS - 1959
.,.;
-,
Week Ending
..
STATE
May
23
May
30
June
6
May
2
'May
9
May
16
May
23
May
30
June
6
ZGGS SET - THOUSANDS
CHICKS PLACED - THOUSANDS
Maine Connecticut Pennsylv::tnia Indiana Illinois Missouri Delaware Maryland Virginia West Virginia North Carolina South Carolina GEORGIA
~"'lorida
~
Alabama
.'
Mis'sissippi
Arkansas
Louisiana
,
Texas
Washington
Oregon
California
.
1, 557 1, 101 1,443 1,937
261 1, 755 1,929 2.918 2,429*
362 3.935
532 9,236
395 4,421 3,087 4,226
702 3,206
427 484 1,388
1,528 1, 105 1,256 1,859
234 1,732 1, 877 2,885 2,398
334 3,903
480 9.236
394 4.215 2,973 4,050
665 3,216
394 493 1, 561
TOTAL 1959 TOTAL 1958 1959 % of. 19 S8
*Reovise d:
. 47, 731* .46.788
51,017
'"
94
51;233
. : 91 -
..
1,426 'I, 019 1,287 2,'079
239 1,664 1,873 2,972 2,247
322 3,731
549 9.276
402 4. 170 3,032 3,974
697 3, 157
452 383 I, 570
46, 521
51.,023
91
. 1,234 1,240 1,232 1,240 1,267 1,275
, 666
601* 566
533
664
505
840* 736
843
873
855 775
. 888 :. 786
885
759
844 ' 872
191
106
144
99
135
123
843
702
782
756
670
733
.
1,986 1.996 1,908 1.672 1,753 1.699 L7"l1 , 1,649 1,637 1,884 1~_832 l.832
.
1,220 . 1, 197 1, 24,1 1.251, . 1,"223 1.243 .
601
63.3
737
585 . : :723
575
3, 213 3,300 3, 128 2,93$ . 2~-998 3.016 .
326
320
336
337 . :. 365
351
7.244 6.996 7,165 .7, 053 6,951 7.002
222
205
196
3,802 3. 506 3,493
2,531 2,267 2,416
3,465 3, 52? 3.479
500* 473* 396
2,455 2, 131 2,023
375
369
343
258
Z19 .- 244
1,054 . 1, 055 .- 1,091
211
188
178
3.44& 3, 4~4 3,413
2,498 2",465 . "'2.485..
3,428 . J/50 1 3, 551
. '0394 " 423
400
?,091; 2',200 2,312
39~
371
377
:
;
244"
995 .'
227 ". ,: 987
268 .1,.033
I
-!
.. ,
35,580* 34,101*-34,187 33.828 33j892. 34,087
-
.:
33.930 ," 105
.- ..
3:4,910 98-
"35,504: 36,390
96' -, ~ '93; I .
36,,.5-32 36,' 562
. ::"93 "~ -..": ':' '93'
.. '
I
,I
j/S-
<G1E(Q)~(Q;llA ce~J)lP' JRlEJP>(Q)IRi1rllNG S!EJR{VllCI&
AGRICULTURAL EXTENSION SERV!CE
'UNIVERSITY OF 'GEoRGIA AND THE
SiATE OEPAA'TM~t4T OF AGRICULTURE
ATHENS; GEORGIA
-
U~li~i'~ , I "r ,.',u'&LA
'59
U. S. DEPARTMENT OF AGRICULTURE AGRICULTURAL MARKETING SE:RVICE 319 EXTENSION BLDG., ATH~NS. GA., '
June 11, 1959
GENERAL CROP REPORT~un-~\,jtoloA Aob V~- uUJ~~ Je, Jet',?
(
,
Production prospects of most major field crops were reduced by heavy rains,
dUring the last twelve days of May. The tobacco crop was severely damaged:' by
the heavy rains, especially in the southcentral and southeastern sections of the
State. Some corn, cotton, and peanuts were drowned out in low lying fields ..
Rainfall in May was above normal in practically all areas of the State, with rec~
:ord 'amounts in some areas. Weather during the first part of: the month was: favor-
able for crop grmrth and farm activities.
~,
The yield from small grain crops has been reduced from earlier, expectations. Harvest operations which were underway in some areas were delayed by the heavy rains. I..odging has been severe in many fields. The wet soils which kept the combines out of the grain fields also delayed cultivation of row crops. Many fields of corn, cotton, and peanuts 'are unusually grassy due to the lack of cultivation.
Pastures and hay crops made rapid growth during the last half of the month. VerY 11ttle hay was harvested as there was no favorable weather '-for curing.. ,., Insect and disease' ~~ntrol programs were ext!emely difficult to carry out.
~1HEAT PROSPECTS DECLINE: Wheat production on Georgia farms for 1959 is curren~,ly estimated at 2,142,000 bushels, the Georgia ~rop Report-
ing Service said today. This is a decline of approximately 9 percent from the r estimate. made last month. Heavy rain during the last two weeks of May was the . principal factor causing a decline in the estimated production. Harvest operations which "'Tere just beginning were delayed by the rains. Lodging was severe in many fields.
The June production estimate of 2,142,000 bushels is 31 percent above the 1958 production of 1,633,000 bushels. Yield per acre is estimated at 21.0 bushels compared to the record high per acre.yield of 23.0 bushels made in 1958.
The expected increase in production is due to a 44 percent increase in the bar-
vested acreage. Acreage for harvest this year is estimated at 102,000 acres.
PEACH PRODUCTION FORECAST UNCHANGED FROM MAY 1: Georgia's 1959 total peach crop (including farm and commercial
production) is forecast at 3)400)000 bushels, the Service said today. This is the:same as the May 1 forec~st. The current forecast is 15 percent below last year's crop of 4,000)000 bushels. Based on past relationship between inspected shipments and total production which has varied considerably, inspected rail and t.ruek shipments from this year's crop could be anywhere from 3,800 to 5)600 car equivalents. This compares With inspected shipments of 6,654 eqUivalent cars last year. Picking began earller this year than in 1958. (According to Market News 'Service reports through 'June 8, total equivalent car shipments were 1,-455 compared to 380 through the same'date last year.)
RECORD EGG PRODUCTION: Hens on Georgia farms laid an estimated 138 million eggs
during May 1959, a new record high for the month. This
is 15 percent more than the 120 million eggs produced during May 1958 and is 50
percent above the 10-year (1948-51) May average production of 92 million eggs.
The average ,number of layers increased from 6,459,000 in May 1958 to 7,287,000
layers this year, while the rate of lay advarnced from 18.6 eggs per layer to 18.9
eggs per layer.
., ,
MILK, PRODUCTION' DOWN: Milk production in Georgia during May is estimated at 105 ~lJ,:1on pounds. This is a drop of one million pounds below
the 106 million pounds produced during May 1958. The all-time record high pro-
duction for May was in 1946 when 114 million pounds of milk were produced.
ARCHIE LANGLEY Agricultural Statistician In Charge
RAYMOND R. HANCOCK Agricultural Statistician
UNITED STATES - GENERAL CROP REPORT AS OF JUNE 1, ~959
Winter wheat' prospects slipped nearly 2 percent during May. Lower expected
yields in Kansas and Nebraska overbalanced the steady to improved outlook in other sections. Spring wheat developed slowly as major producing areas were mostly cool and dry. The spring planting season is nearing completion with gene-
ral success in spite of some sectional weather-induced set-backs. Small grain
and hay harvest was hampered by frequent rains 'in parts of the Southeast. Pastures and ranges are mostly in good to excellent condition except in the northern Great Plains and the Southwest. A near-average hay crop is in' prospect.
Diciduous fruits show satisfactory development and the 1958-59 citrus harvest' ,
is near .completion. May weather favored vegetable development except in the Southeast and Northwest. Moisture supplies are generally adequate to excessive for immediat,e ,needs east of the Rocky Mountains. Stored water supplies' are satisfactory in most areas, but streamflow wiD, ~e short in many western areas.
Q!!: Planting of t)le 1959 Corn crop was about 85 percent completed by June l.
Progress was somewhat slower than last year but at about the. usual rate. Planting was at a rapid pace early in May but frequent and heavy rains later in the month caused, some interruption of field operations. Stands were generally satisfactory 'and replanting caused by washing, flooding, worms, and rodents has not been extensive except in limited areas.
ALL WHEAT: All Wheat production in 1959 is forecast at 1,182 million bushels.
A crop of this size would be nearly a fifth less than the record
1958 production of 1,462 million bushels but 10 percent more than average ..
PEACHES: The 1959 peach crop is estimated at 78.9 million bushels, the largest crop since 1946. This 1s 11 percent larger than last year and 28
percent above average. Most of ahe increase over last year can be att:r1buted
to ,California since over the rest of the country only Alabama, .Tennessee;
Louisiana, Utah, and Oregon expect larger crops than in 1958. 'Excluding the
California Clingstone crop, 'Which is mostly for canning, the rest of the U. S.
crop is forecast at 48.9 million bushels, compared with 50 million bushels last year and the average of 39.3 million.
Production in the 9 Southern States is estimated at 14.3 million bushels,
9 percent less than last year but 53 percent' above average. By June 1, harvest
was underway in all of the Southeastern States except North Carolina.' Frequent
rains during .the last half of May in Georgia hampered harvest which is 4 or 5
days ahead of last year. Harvest to date has been mostly Duke of Georgia,'
Cardinal, Hiland, Dixired, Red Cap and Erly-Red-Fre... Movement of Coronet, Dixi-
gem, and Redhaven will be underway the week of June 8-13, while harvest of
Pearson Hiley and E;arly Hiley will' begin about June 16. In South Carolina, har-
vest started in late ,May. Growers did a thorough job of thinning which, to-
gether with a good moisture supply, has resulted in favorable sizing. Although
not all areas had a set as good as the Piedmont, the overall prospects are good
with .the crop expected to be only 4 percent smaller than last year. North Caro-
lina '.s early peaches are sizing well. Production from Elberta trees is expected
to be below last year as a result of late March freezing temperatures. Light
movement from Alabama's Chi lton County area got ,under way in late May. Al-
though the crop is expected to be lai-g~r than last year there is less uniformity
of set between varieties. Arkansas expects a good crop in all areas except the
Northwest where late spring freezes caused considerable damage. Early peaches
have sized well and harvest should be under way about June 10. Louisiana
growers began picking Dixireds and HiJ.ands on May 29. Texas had favorable
weather 4~ing May and expects to harvest earliest varieties in east Texas dur-
ing the, first part of June. In the Fredericksb~g area, harvest will start
about June 10.
'
MILK PRODUCTION: Production of milk on U. S. farms in May is estimated at 12,595 million pounds. This was' 1 percent below production in
May last year and 3 percent below the record high May outturn in 1957, but 1 percent above the 1948-57 average for the month.
POULTRY AND EGG PRODUCTION: Farm flocks laid SJ 729 million eggs during May 3 percent more than in May 1958 .
.
'A3
QS1
CGlE(Q)1FiGllA
C~)~~.fEJE:e
lillNG 1E~Vll<CIE
UUYle.J
GRICULTURAL EXTENSION SEr~VICE
'0. S. DEPARTMENT OF AGRICULTURE:
UNIVERSITY OF GEORGIA AtlO THt::, STATE ,DEPARTMENT OF AGRICULTURE
JlJN 15 '59
AGRICULTURAL MARKETING SERVICE 319 EXTENSION BLDG., ATHENS. GA.
Athe:q.s, ,Geqrgia
..~
., -------_ L1BRARlr~
'-
.
June 12,. 1959 '.,
~. :.
VEGETABLE. CF.,OP REPORT FOR JUNE 1, 1959
GEORGIA: '~rq~uction of.' Spri~g and Early Summer vegetables in Georgia ~s estima-', ted' at 33 percent below last year, the"Georgia Crop Reporting Service
said today. This reduction reflects lower yield prospects for most crops and a FO percent ,reduction in acreage for harvest. Weather conditions during late May were very'unfavorable for most growing vegetable crops. Harvesting of cabbage, onions, and snap beans has passed peak following a relatively short season.
UNITED STATES: 'Sprin6 vegetable ,and melon pro~uction is now expected to be 5
percent less than last year but slightly above aver~e, t~e
Crop Report~ng Board announced today. Estimated production, excl~ding melons, ..!s
only one prcent below 1958. Melon production is 18 percent less. Spring crops
With ~ubstan~iallylessproduction than la~t year are tomatoes, cucumbers, snap
beans, 'sweet corn, onions and green peppers. Late 'spring watermelon production is
28 percent less than last year while the cantaloup crop is 12 percent more.
Strawberry production 'is 18, percent below 1958.
-
Production of summer vegetables estimated thus far, which laet year comprised
40 percent of the total -Summer production, is 2 percent less than in 1958. Early -summer melon production is expected to be Ih percent below last year.' In .
addition to those crops for which forecasts have been made, acreage estimates have ~een prepared for a number of others. The summer acreage estimated to date excluding 'melons is 2 percent more than last year while the melon acreage is 14
percent less. Most significant acreage changes from last year are a dec~ne in
tomatoes and a substantial increase in onions.
CAIfrALOUPS: Production of spring cantaloups is now forecast at 3, 5?6, 000 cwt.,
12 percent above last year but 9 percent below average.' Both
Arizona and California expect more production than in 1958. The Flor~da crop is
the same size as last year's but Texas is considerably smaller. We~ther in the
Desert ar~as of California has been excellent this season for produ~ing a pieh
yield and good quality. Temperatures have, been'high enough to promote growth
vithout ~eaching damaging levels. Disease and insect damage have been very light~
Peak movement in'the Imperial Valley was expected the first week of June. Daily
volume is still increasing in the Blythe district; Harvest of the Arizona crop
began about May 20. Some disease is eVident, but no badly infested fields have'
been reported thus fur. Cool nights retarded the maturity ra.te but will promote
larger size. In Texas, weather' was fe.vorable during most of May, and the crop
is in generally good condition. ' Harvest in the Lm,rer Valley became ac~i:.jel' the
last few days of May, and supplies Will, be a.vailable in volume until'abo1lt J'~e
20. Light harvest began in the laredo area the last week of May and most sheds ..
vere expected to be open the first week of June. Winter Garden and Presidio 'are
not expected to be in production,until about Jlli~e 10. In Flordia, yield pros-
pec~s range from very poor to good but, generally below normal. Peak ha.rvest
period ~s expected to be from late May to mid-June. Harvest is now active in
C~~tra~,Florida and just starting in North Florida.
'
t ,-
The first forecast of production places the early summer~rop at 1,2io, 000 , cwt. This is 5 percent under last year's c~op and a fifth:bel~w average. The
South Carolina' crop is reported to be in "g6od condition. Peak moveriiel1t.. is ex- .
pected about July 1 in Barnwell and other southern counties and about three weeks later in Chesterfield. Too much rain ha~ resulted in a poor c~,QP in Ge'orgia.. Stands are poor nnd'heavy rains are causing young melons to s~ed. 'Disease is' eVid~~t in many areas. Light harvest iri the earliest planted fields ~s exPected about 'inip.-June. Harvest of the Arizona ,crop Will begin about June 20. Weather
thus far has been ideal a.nd the crop is in good condition. Virus disease is showing up, bU~ there has been little d.aIi1age.
SWEET CQRN: ~inal forecast of the early'sp~ing crop in Florida and Texas is
2,315,000 cwt., 12 percent be'low 1958 but 9 percent above ave'rage. S~pplies from the Everglades section of Florida.' are declining with about 10 p,er-
~cnt of the crop remaining for harvest at ~he end of May. Shipments are now Jriginating from the Zellwood and Sanford sections and will continue in volume ~hrough June. Harvest in North Florida is'underway. The crop in this area was hurt by excessive late May rains. Warmer temperatures and favorable growing waather prevailed in most areas of Texas. Supplies from the Lower:Val~ey ~dll continue into early June when marketings' from the earlier areas outside t'he ,,: .-
'alley are expected to begin. Harvest from these areas, mostly 'around San 'Antonio, w:l.ll continue through most of the month. Plantings in scattered sections of cast Texas are also in good condition wIth sufficiont moisture available for the l'crrainder of the season. Supplies are expected to be available from mid-June to mid-July.
- 2-
Vegetable. Crop Report for jtL~e 1, '1959 (co~~~nued)
,.!,
I,
',:
SWEET CORN, Cont.: The last forecast of the late spring crop plac~s prodpct~~~
at 850,000 cvTt., 6 percent above last year .and.:average ~ '., .
Harvest in the Coachella Valley of California is expected to continue un.t11 imid-
June. The 1,500 acres in the Kern district has ll1lde excellent progress and har-
vest vro.s expected to start in early June, reaching volume by the tenth. Other
areas are expected to come into production by June 20 .. .l~rvest has started in
Baldwin County, AlabOJIlD. and peak is expected about June 15. The crop made good
progress in Mny. Heavy rains during the last two weeks of Mny resulted in 'some
acreage abandornnent in Georgia. This also hindered spraying and dusting opera-
tions. Ha.rvest is expected to get underwn:>r the second week of June. The South
Carolina. crop shows excellent prospects as weather conditions have been ideal~
for good growth. Harvest is expected to begin about June 10.
TOMATOES: Late spring production is forecast at 867,000 cwt., 30 percent less than last year I s production and 36 percent below average. The drop in
production is J;o.rgely due to sll1lller acreages in Texas ana. Georgia. In South Carolina, the crop is in good condition with excellent yield prospects. Harvest was expected to begin about June 1 and reach peak in mid-June. Excessive rains in Georgi.a have ,delayed harvest about a week. Harvest is expected to get underway the second week in June. First pickings will be of poor quality. Heavy infestation of tOll1lto fruit worm is showing up in all' areas. In Mississippi, heavy rains near the end of May were' unfavorable. Harvest wo.s expected to begin about June 1. Light picking has started in the Whiteville and New Orleans areas of Louisiana'. Recent rains have been excessive and some cracking and rot have been reported. If the rains continue damage could be heavy. In Texas, the crop in the Yoakum area is later than usual due to unfavorable weather earlier in the season. The east Texas crop made good progress during the last half of May. Harvest of green wrap tomatoes will start the second week in June. Movement of "pinks" will get underway in mid-June and continue into July.
WATERMELONS: Late spring production is forecast at 7,506,000 cwt., 28 percent , below the 1958 production but about the same as average. The
Florida crop is irregulo.r in development ranging from poor to good with melon sizes averaging smaller than normal. Recent rains have improved vine growth
in some instances, but showery weather has also increased disease activity.
Harvest is increasing seasonally with heaviest supplies expected June 15-30. Peak movement in South Florida occurred in early May and about 'Mny 20 in the
Desato, Polk, Hillsboro county areas. Harvest is now active in the Ocala, McIntosh and Williston areas. Light harvest got underway around June 1 in the Trenton-Newberry area. Shipments from North Florida wi'll be heaviest during the
second half of June. West Florida will begin harvest after June 15 and continue
into JUly. Harvest of California watermelons in the Imperial Valley wo.s expected to' rea.ch peak in early June and wo.s well underwny at Blythe during this period. The condition of melons and vines is very good as favorable growing wep.ther and ideal weather for harvest operations have existed. Supplies will dontinue through June .
. , The first production forecast of early summer watermelons, at 19,197,000
cwt., is 14 'p.ercent . less than 1958 production but 2 percent above average. In
the Carolinas; wo.termelons made very good progress under favorable weather con-
ditions in May. Movement of the South Carolina crop is expected to get unde:r:wny
in the Barnwell-Hampton area in late June and peak about the first week of July.
Harvest in Chesterfield county will commence the first week of July. Prospects
for' the Georgia crop declined during Mayas a result of excessive rains, grassy
fields' and disease. Light harvest will begin the week of June 22. In Alabamn,
p~ospective yields are good. Movement is expected to.begin in Ba.ldwin County
ab.out June 15. Watermelons in Mississippi ma.de good progress during May; how-
ever, .prospects in the southeastern counties were lowered somewhat by heavy rain-
fal~ late in the month. Harvest in the important central area will begin about
JUly 1. The Louisiana crop is earlier than last year and, harvest in the Wash-
ington-St. ';Ca.mmany area should begin in early July'. Supplies in the important
north central area will probably be available about mid-July. In Oklo.homa., fair
stands have been obtained after considerable replanting. In Texas, weather
conditions have been favorable and the crop has ma.de good progress in a.ll areas
.Light movement occurred in the Lower Valley in late May. In the Falfurrias, :
Hebbronville and Riviera. areas volume movement is expected around June 10. ....
Ha.rvest will begin in other areas of South Texas the latter Part of June. Sup-
plies in, central and eastern counties will be availo.ble in early July and con~.
The tinue. into August. The quality of the Arizona Crop is good as a result of, ideal
weather.
California crop shows good prospects. Earliest harvest is ex-.
pected at .Wheeler Ridge about June 25.
'.' ..
Acreage and Estimated Production Reported to Date, 1959 with Comparisons
..
.
.
CROP
AND STATE
ACREAGE FQ,R Hi\RVEST : YIELD PER ACRE
PRODUCTION
:Avero.ge: 1958 : Ind. : Av. :1958 : Ind. :Avero.ge : 1958 : Ind.
:1949-57:
: 1959 : 49-57:.. :.J959 :1949-57:
:1959
pNAP BEAUS
t,tld-Spring:
- Acres -
- Cwt. -
- 1,000 Cwt.-
pouth Caroline.: 7,720
Georgia.
: 4,890
~bama
: 1,200
~ssissippi
: 2,780
Loui siana
: 3,360
: Group Total : ,19,940
5,800 3,900
850 1,900 3,000 15,450
5,600 3,300
750 1,700 3,100 14,450
20 20 25 17 19 15 21 23 22 24 28 30 24 28 25 21., 22 23
157 116 140
83
74 50
26 20 16
65
53 51
81 84 78
412 347 335
CANI'ALOUPS
$pring:
Florida
texas Ari zona, YUllIZl CaUfornia
Group Total
1,680 10,260
13,~9P'-
14,400
39,820
Ear~ Summer:
South Carolina: 5,910
Georgia
: 8,530
Arizona,Other : 7,680
Group Tota.1 : 22,120
1,600 1,800 8,000) 4,500 12, J-OO' 14,200 13,300 12,500 35,000 33,000
7,400 9,000 10,500
26,900
7,000 8,000 5,500
20,500
SWEET CORN
La.t~ Spring:
South Carolina: 2,110
Georgia
: 2,100
Alabama
: 4,000
California
: 6,820
Group Total : 15,030
TOMATOES
1,300 1,200 2,300 2,400 3,600 3,600 ! 6,200. 6,400 I 13,400 13,600
Late Spring:
South Carolil'lO.: 4,720
Georgia Mississippi
: 11.,740 : 1,640
Louisiana
: 1,180
Texas
: 20,920
Group Tota.l : 40,210
6,300
13,000 1,800 1,300
14,600 37,000
6,200
9,000 1,200 1,300 5,500 23,200
45 45 40 65 80 90 120 110 120 103 85 110 98 91 108
34 35 35 55 55 45 110 50 110 67 48 59
44 40 45 30 31 30 44 60 50 69 75 85 54 60 62
36 32 40 39 45 40 30 21 35 40 40 40 ~ 2~ 30
3 3 37
77 714 1,636 1,490 3,917
72 72 640 405. 1; 331 1,704 1,130 1,375 3,173 3,556
199 467 849
1,515
259 245 495 360 525 605
J.,279 1,210
93 52 54 63 71 72 174 216 180 472 465 544 802 804 850
170 202 248
458 585 360
47
38 42
47
52 52
638 365 165 1,360 1,242 867
WATERMELONS
I
~ar~ Summer:
~orth Carolina: 11,160 15,000 13,500
South Carolina: 41,890 42,000 35,000
Peorgia
: 54,000 63,000 50,000
Alabama
: 17,460 21,000 19,000
Mississippi : 11,040 16,000 12,000
Arlmnsa.s
: 10,320 13,000 11.,500
Louisiana
: 4,430 4,200 4,200
Oklahomo.
: 14,520 11.,500 8,700
Texas
:109,220 119,000 107,000
Arizona
: 5,170 7,400 6,500
California
: 10,480 11.,000 11,800
Grol.lJLTota1 _ :2$.9.~f)9Q323,100 279,200
50 60 60 555 900 810
54 60 60 2,264 2,520 2,100
78 85 70 4,190 5,355 3,500
91 95 90 1,577 1,995 1,710
70 65 65 773 1,040 780
85 85 85 874 1,105 978
77 80 85 342 336 357
64 65 65
946 748
566
47 50 50 5,096 5.950 5,350
146 95 160 757 703 1.,040
140 160 170 1,464 1.'460 2,006 65. __69. _6918~B3(g2..L_J.g__ 19,197
ARCHIE IJlliGIEY
Agricultura.1 Sta.tistician In Charge
L. H. HARRIS, JR.
Vegetable Crop Estimator
...\ i
...~
_ ~~ _ . _ ....
-
...... _ ... __
__........
eo
.. """-
GEORGIA CROP REPORTING SERVICE
\/\/ ~ ~~ ~ J1< ~\f
r \f I
J~
I J~~'J'r\J
JUN 18'59
Release 6(17/59
GEORGIA CHICK HATCHERY REPORT
llBR,4,Rf
Athens, Ga., June 17 -- A total of 6,961, COO broiler chicks were placed
with producer s in Georgia during the week ending June 13, according to the
G~orgia Crop Reporting Service. This compares with the 7,002,000 placed the
previous week and is 1 percent less than the 7,063,000 placed the same week
last year.
Eggs set by Georgia hatcheries amounted to 9, 312, 000 compared with 9, 276,000 the previo'us week and is 1 percent less than the 9, 360, 000 for the corresponding week last year.
The majority of the prices paid for G ~orgia produced hatching eggs were reported within a range of 40 to 60 cents with an average of 52 cents for all hatching eggs and' 49 cents for eggs purchased at the farm from flocks with hatchery owned cockerels. Last week the range was from 40 to 60 cents with an average of 50 cents for all hatching eggs and 48 cents for eggs purchased at the farm from flocks with hatchery owned, cockerels. Most prices charged fOl chicks were reported within a range of $8. 00 to $9. 50, with an average of $8. 75 per hundred compared with a range of $8.00 to $9.25 with an average of $8. 50 per hundred last week. The average prices last year were 79 cents for eggs and $13.75 for chicks.
Weighted average prices from the Federal-State Market News Service for broilers during the week ending June 13 are as follows: Georgia broilers 2 3/4 33/4 pounds at farms 14.60f.
GEORGIA EGGS SET, HATCHINGS, AND CHICK PLACEMENTS
BROILER TYPE
EGG TYPE
Week Ending
Eggs Set !!
.; ,Chicks Place'd ',for Broiler s in G~orgia
Eggs C,hicks Set : Hatched
' 1958
1959
"
1959 % 1958
of 1958
l~ 959
1959 % 1959 1959
' of 1958
..
Thou; 'Thou. Perc'ent Thou. Thou; Percent ''Thou. Thou. '.
Apr. 11 Apr. 18 Apr.25 May 2 May 9 May 16 May 23 May 30 June 6 June 13
'9, 14 ~ ,9,265 9, 544 9,428 9,204
9, 589 9,766 9,668 9,616 9,360
9,710 9,778 9,480 9,632 9, 570 9,251 9,236 9,236 9,276 9,312
106 6,695 7,382
110
106 6,709 7,477
III
99 6,826 7,319
107
102 6,857 7,244
106
104 6,934 6,996
101
96 7,237 7, 165
99
95 7,113 7,053
99
96 7, 151 6,951
97
96 7, III 7,002
98
I 99 7,063 6,961
99
I
685 725 559 ,574
395 373 280 239 245 165
723 669 . 588 '
513 423 494 435 184
169 179
1/ Includes eggs set by hatcheries producing chicks for hatchery supply flocks.
ARCHIE LANGLEY
W. A. WAGNER
Agricultural Statistician In Charge
Agricultural Statistician
u-.--S-.--D-e-p-a-r-t-m-e-n--t -o-f-A--g-r-ic-u-l-t-u-re--
--
-
--
--
-
--
-
-------------
Agricultural
------------------
Extension Service
-
Agricultural Marketing Service
State Department of Agriculture
319 Extension Building, Athens, GE'orgia
-------------------------------------------------------------.-----------
EGGS SET AND CHICKS PLACED IN COMMERCIAL AREAS, BY WEEKS- 1959 Page 2
STATE
May. 30
June 6
June 13
EGGS SET - T.HOUSANDS
Week Ending
May 9
May 16
May 23
-
May 30
June 6
CHICKS PLACED - THOUSANDS
June 13
Maine
I, 528 1,426 1,483
1,240 1,232 1,240 1,267 1,275 1, 310
Connecticut
1, 105 1,019
988
601
566
533
664
505
590
Pennsylvani.a
1,256
1,287
1,422
736
855
888
786
844
913
Indiana
1,859
2,.079
1,827
873
775
885
759
872
810
Illinois
234
239
184
106
144
99
135
123
100
Missouri Delaware
1,732 1, 877
1,664 1,873
1,700 1,976
702
782
756
670
733
742
1,996 1,908 1,672 1, 753 1, 699 1, 755
Maryland
2,885 2,972 3,017
1,649 1,637 i, 884 1,832 I, 832 1,905
Virginia
2,398
2,247
2,200
1, 197 1,241 1, 251 1,223 1,243 . 1, 168 .
West Virginia
334
322
314
633 . 737
585
723 . 575
658
North Carolina South Carolina
3,903 480
3,731 549
3,708 530
3,300 3, 128 . 2,933 2,998 i 3'. 016 -, 3,037
320
336
337
365
351
338
GEORGIA
9,236 9,276 9,312
6,996 7, 165 7,053 6,951 1.002 6,961
.J!"'lorida
394
402
404
205
196
211
188 . ; 178 . 223
Alabama
4,215 4, '170 4, 151
3, S06 3,493 3.446 3,404 : 3, 413 3,368
Mississippi
2.973 3,032 3,234
2.267 2,416 2,498 _ 2.465 . 2,485 . 2. 533
Arkansas , Louisiana
4,050 665
3,974 697
4, 118 696
3. 527 3;479 3,428 '3.501 3, 551 3, 566
473
396
394
423
400
448
Texas
3,216 3, 157 3.262
2, 131 2,023 2,097 2,200 2,312 2,307
Washingt on
394
452
386
369 . 343
399
371
377
374
Oregon
493
383
413
219
244
244
227
268
276
Californica
1, 561
1.570
1,4.33
1,055 . 1,091
995
987 1.0:n
987
TOTAL 1959 TOTAL 1958
19 ~9 % of 1956-
46,788 51, 233
91
4.6, 521 .-- 46,758
51". 023
"
9-1
50,305 93
34,101 34, 187 33.828 ~3.892 34,087- 34,369
34,910 35, 504 36,390 36, 532 . 3.6.562 36.900
98
96
93
93
93;
93
rs-
GlEOlGllA <C~O lEI?(Q)IRrrHNCG SlEl~Vll'ClE
AGRICUL.TURAL EXTENSION SERVICl!'
UNIVERSITY OF GEOR'GIA AND THE
STATE DEPARTMENT OF AGRI.CUL.TUREI
Athens, Georgia
..
~IUN 1 q '59
'U~
U. s. DEPA,nMENT OF AGRICULTURl!
AGRICUL.TURAL. MARKl!TING SERVICl!
311 EXTENSION BLDG., AT.HEN"S,,G. 'A.,. ,
June 18, 1959
' .. :'::
:' ;rhis summary of poultry inlorm~b'"On on-ttatch~ry pZ:Oduction, poultr~. _,:_ ..':,,:_ sla:ughter, egg production, pertinent pi-iee d:ata and end-of-month storage s~ock8
is being furnished you in a condensed fprm to enable you to have a ready current
re
,. ~
fe .. "
r
e:. n-..
c
e
.
.' ,:
t':_ ;
~ 'OJ.
Item
,,
. . . . , POULTRY SUMMAR Y, : During May
MAY 1959
: % of:
---
Jan.
- ---.
through
.---- -
May:' .%
"
oL"
.
. last ' .
.
" .' last
: 1958!! : 1959Y : year: 1958!! : 1959Y : year
..
_",-
__ .. _ _ _ .
I
"
Thou.
Thou. Pet.: .Thou.
Thou. ~d:" .....
Chicks Hatched by Commercia-I Hat'cheries:
Broiler Type Georgia "ti~lit~eq. States
E g"g.,T ype '
Georgia United States
Commercial Slaughter:~
31,047 H~O" 72.6
935 109, 72.2
31,92.6 173, 594
1,707 87,934
103 134, 555 96 772,172
:
183: 6, 024 80 : 453,684
148,785 834,63,1
11, 685 436,327
Ill" ,
108
194
96
Young Chickens
Georgia
..
United States
:
:26, 02.0 2.7,297 105 : 108, 229 113,439 ;10.5
:. 13,2,'354 147,560 111 :. 568, 1R4 647,928 .1)4,:
Hens and Cocks Georgia United State s
Egg Production:
Georgia
4/ "
South .Atlantic-
United States .
2.72. 6, 028 .
Mil.
12.0 571 5,544
429 158 : 1, 518 9,636 160 :
Mil.
138 627 5,729
Pct. : Mil.
:
115 : ,563 110 : 2,625 103 :', 26, 534
2,419
",
....~ .
Mil.
i
159
..
:
.-
.'
Pct., '
663 qs
, 2,'959. "1.13,:, 27,951. 1,9:5,;.' :
1/ Revised. 2/ Preliminary. 3/ Federal-State Market News Service--Fo-r ine purpose ofthis report a c0O?-~ercial .'poultry slaughter plant is defined' as a plant'which slaughters a weekly average of at least 30,000 pounds live weight while in operation. (Converted f~o~ weekly to, monthlybasis.) 4/ South Atlan-
tic states: Del., Md., Va., W. Va., N. C., S. C., Ga., Fla.
MID-MONTH PRICE'S RECEIVED' AND PRICES PAID
Item
.. ,-, ..
..
- Prices 'Received:
'Fa'rm Chickens (lb.')'
Com. Broilers '(lb.') All Chickens (lb. ) All Eggs (dozen)
Georgia
: United' States
:May 15 :Apr. 15 :May 15 :M,ay 1:5 .:Apr. ~.5 :May' 15 : '
1958
,,',
-.:.,
.1.9.59..,.:.'
19'5,9.' . :.'
195fj
:. 1959
:. 1959 .
I
Cents ' C_~Ilt~ .. Cents, : Cents
.:
. , '.
Cents
t
Cents
: 18. O' : 19: 4 : 19.4 : 53.9
13.5 15.5 15.5 38.5
:
13.0 : 15.2 : 15. 1 : 36. 1 :
16.7 20.3
19.9 36.8
12.6 16.3 15.9 28. 1
"
11. 4 16.0 15. 5 25. 1
Prices Paid: (per 100 lb.) : Dol
Broiler growing mash : 5.20
Laying mash
4.90
Scr.atch grains
: 4.40
Dol.
4.95 4.75 4. 15
Dol. : Dol.
: 4.90 : 5.06 4.75 : 4.52 4.20 , 3.99
Dol.
4.93 4.52 3.93
Dol.
4.89 4.51 3.94
------------------------------_.-.-----------------------_._._----------
l'''or this project State funds were matched with Federal funds received from the Agricultural Marketing Service, USDA under Provisions of the Agricultural Marketing A ct of 1946.
-----------------------------------------------._------------------------
Ertd.6f-Month Sto'cks of Poultry, Poultry Products, Meat and Meat Products
.. '.:', .'.
United State.s
., .:..' ...'
'.
. Net Changes in Stocks during May and Comparisons
. ; ....; '\
" .. I
Shell eggs: Increased by 466,000 cases; May 1958 increase wa-s 383, 000 ca~es;
average May increase is 596, 000 cases.
t.'...rQ~.e~.. ~gg.~.;, Increased by 37 ~illion p~unds; May 1958 increase was 32 million
'. p.oun,ds,; ~.verage May increase is 37 million pounds.
~""ro~en poultry: Decxeased by 17 million pounds; May 1958 decrease was 32 mil-
....
l
.,
i
o.n.
.p,
o
u
n
-
:l
s
;
average
May
d-ecrease
is
20
million
pounds .
Beef:. Increased by 1 million pounds; May 1958 change was a c13crease of 3 mil.' ~ lion.pouncis;"average May change is a decrease of 15 million pounds.
h' _
"
.
Pork:. Decreased by 9 million pO'una:; May 1958 decrease was 17 million
pounds; average May decrease is 38 million pounds.
Cth~r meats: Decreased by one-half million pounds; May 1953' decr'ease was' 2
.
million pounds; average May decrease is 2 million pounds.
I'
,
Commodity
Unit
May . Way
: 1954- 58 a v. .: 1958
Thou.
Thou.
April 1959
Thou.
May 1959 1/
Thou.
f:ggs:
Shell. . . . .
Case
. .... rozen eggs, total.
Whites
.
.
Pound do .
Yolks
. do ..
Whole or mixed. . . : do.
Unclassified.. ' : do.
Total eggsY(case eq.). : Case
poultry, fro~en:
Broilers or fryers.
Roasters, .. , ..
Hens, fowls.
Turkeys
.
Ducks. ~
.
Unc::1~s sHied. .
Pound .10. do. do. do. do.
Total poultry....
do.
Beef:, .Fro~en, In cure
, cure & cured...
do.
1,412
705
532
998"
143, 809 100,624
85, 119 122, 326' '"
44,465
35, 159
26, 511
34,47.9
34,565
26,278
24,627
34~ 377
58,301
35,486
31,287
49,9.85
~----65-,,-41-73-84-------33-,,7-2-05-12------22--,,66-89-74-------43-.,.-40-89-55~-.
---------------------------------------~---
16, 621 5, 542
26,880 70,408
4, 519 24, 542
15,760 2.987
22,364 84,243
2,066 18, 133
26, 514 9,555 57,037
86,699 2,488
33,017
25, 347. 9,883 .
56,421 67,369
3, 128 36,257
._-------------------------------------~---.
148, 512 145, 553 215,310 198,405
._-------------------------------_.-----~--'
I.
126,474 100,027 171,110 171,842
:pork:
l'rozen
.
do.
296, 118 189,801 324,333 313,405
In' c'ure &: cured. '"
do.
80,722
53,038
56,664
58, 172
Other meat and , meat,products. J.
':rotal all red meats.
do.
86,608
79; 129 107,858 107,365
do. ~--5-8-9-,-9-2-2----4-2-1-,-9-9-5-----65-9-,-9-6-5-----6-5-0-, -7-8-4---
1/ Preliminary. 2/ .J.i'rozen eggs converted on basis of 39. 5 pounds to the cas<1 ..
: ARCH~ LANGLEY Ap,ric~i.t<.lra1 .3tatisticlan In Ch~rge
RAYMOND R., HANCOC.K -W. A:' WAGNER
.. Ag~i.cu1turalSta,tistic~ans ., ,
'..
J ,_
....
____________
_ ....
-'="'~'
~~"Ie._~
" " " =.... . . - : : : - . . .
_
~
(G!E01P&(GHA (C!Ri(Q)jp) ~JE1P(Q)~1rllN~ }EJR{VRCE
AGRICULTURAL EXTENSION SERVICE UNIVERSITY OF GEORGIA AND THE STATE DEPARTMENT OF AGRICULTURE
Athens, Georgia
U. S. DEPARTMENT OF AGRICULTlIRE AGRICULTURAL MARKETING seRVICE 319 EXTENSION BLDG., ATHENS. GA.
June 19, 1959
PULLET CHICKS FOR BR01LER-HJ:TCH~RYSUPPLY FLOCK~
May 1959 -. United States
'~ ~ .:.
The indicated placement of pullet chicks for broiler hatchery supp~y flocks
by leading primary breeders of broiler replacement stodt totaled 3, 007,000
chicks during May 19-59. :This was 17 pel'<;ent less thanin May 1958. Domestic
placements during May 1959 totaled 2,861,000'. chicks: 'Part of the decrease in .
Chi.cks dur~ng May 1959, as: corr:;pared to a year earlier was due to the fact that
for a number of hatcheries there were 8 days whe.n hatches were .ta~en qf.in ....
May this year, compared with 9 days last year.
.
,
.'
The totals include pullet chicks sold during the month, .plua the. nu~b~r of ,
pullet chicks expected from eggs sold during the preceding month. The c~nver sion from eggs to expected pu~let chicks was made on the. basis 10f 125 p~llet ..... , chicks per case of hatching eggs sold. The primary breeders i"nCluded in thls" ,
report acQQunt for a very large percentage of total supply of replacement "
pullets for broiler hatchery supply flocks. Sa.les of replacement' .pullets b'y, these' breeders provide an ind~cation of the potential number 'of pullets avaiIa.ble for addition to .hatchery egg supply flocks several months be~o.re the pulle~s . will actually move into the flocks.
Pullet Chicks 11 Placements for Broiler Hatchery Supply Flocks
_.
- (Reported by leading breeders)
Month
1957
:
1958
:
January
.
February
'.
March
, .. :
ApriL' .......:
May
:
June. '
:
July
.
August. .
September.
October .
November .
December .
Annual Total.
1,000
chicks ..,
1,000 chicks
1,886 1.997 2, 538 3,033 2, 899 2,060 1,676 1, 41.0 . 1,935 2,297 1,926 2,238 25, 895
1,982
r:
2,270
.
3, 118 3, 320
3,623
3, 390
....... -;...
3,054
2, 646
2,700
. 2,568
2, 141
2, 147
- - 32,95.9
. 1959
1,000 chicks
2, 124 2,414 3,450 3,765 3,007
1959 as : percent .: of 1958
...
" .....
, .. ':percent
,
107
I
106
111
1-13
83
.' ,
11 Includes expected pullet replacements f~om eggs. sold du~ing the preceding
month at the rate of 125 pqllet chicks per 30-dozen case of eggs.
~
ARCHIE LANGLEY. .-. '. .
.w. .A. WAGNER
Agricultural Statistician In Ch.arge
;.
Agricu~tural Statistician '
.\
t :,
.{
,r. I '.' . ..e
I
t... ....
~
. "r
CHICKENS TESTED
, In Georgi~'242, 067 chickens for supplying broiler hatching eggs were'tested for pullorum Jisease during May 1959--5 percent less than the 254,024 te,sted in May 1958. Testings of egg-type chickens for May were 5,561 only 51 p,ercent of the number tested in May last year.
There were 1,647,255 chickens for supplying broiler hatching eggs tested in May 1959--up 6 percent from May 1958. The cumulative total July 1958 through ~ay 1959 ,of 25, 596,042 was 25 percent more than the number tested during these months a year earlier.
In the States ,for which comparisons are available, 241,636 chickens were tested in May for supplying eggs for egg-type chicks--down 12 percent from May 1958. The number tested July 1958 through May 1959, of 12,836,160 was I, percent less than the number tested during this period a year earlier.
This, report is made possible through the cooperation of the National, Poultry Improvement Plan official State agencies, the Animal Husbandry Research Division, Agricultural Research Service and tl1.e Agricultural Estimates Division, Agricultural Marketing Service.
Month
Georgia
-
Chicken,s
Tested
I
".
by Official
State
Agencies
For Broiler Production
;, Egg Type Chickens
:
:
:
:
By Months
Cumulative
By Months
1957-58 " 1958-59 : 1957-58 ':. 1958-59 : 1957-58 : 1958-59
July
: 202,194
Aug.
: '230,292
Sept. ,. , : 334, 522
Oct.
: 306, 795
Nov.~ ,:, 254, 554
Dec.
: 252.517
Jan.
: 414,416
Feb. ,: 275,750
Mar. : 255, 111
Apr. ': 211,093
May
: 254, 024
June : 185, 343
253, 865 240,302 , _413, 264
458,442 388, 136 432.318 564,491 482,212 400,437 275, 275 242,067
202, 194 432,486 767,008 1,073,803 1, ~2a, 357 1.580,874 1,995,290 2.271,040 2. 526, 151 2,737,244 2,991,268 3,176,611
253,865 494; '167 907,,431 1, 365, 873 1,754,009 2, 186, 327 2,750,818 3,233,030 3,633,467 3,908.742 4,150,809
17,274 47,736 .18, 286 27,242
8,325 14,836 61,618
13.675 12,086 57,426 10,849 17,445
30,299 42, 581 35,6,52 41,043 26, 186 84,778 34. 194
5.280 4,994 6,779 5, 561
___
United Statef! - Chickens T,ested by Official State Ag encies
Month
.
:
:
July.!.' , :
Aug.,
Sept. :
Oct.
:
Nov.
:
Dec.
Jan.
:
.2eb.
Mar.
Apr.
:
May
June
:
!! ?or Broiler Production by Months
:
1957-58
:
1958-5.. 9
1, 310, 378
1,600. 805 2,310,549 2,723,936 2,225,580 2.208,307 2,014.868 1.282.382 1.587,391 1,701,022 1,554,643 1,310,490
1, 628, 129
1,596.792 2,643,740
3. 119.754 2,951, 368 2,794.873 2.601,927 2,363,505 2,320.302 I, 928, 397 1.647.255
.For Egg Type Chickens
by Months 21
:
1957-58
:
1958- 59
363, 1'53
676.162
1,251.370
2,379,471
2,483,280
2,586,456
1, 741, 051
,.,
454,617 485, 136
245, 750
2.76,008
2.89. 142
SPO.5'58 .599,607 1.243,658 2,318,229 2.349,994 2.487,248 1.648.909 756.864 421,587 267, 870 2.41,636
11 All States excpet Mont., N. Mex., p, riz . Nev. 2/ All States except Ohio, Del.. Okla., Mont. N. Mex., Ariz. Nev.
3/6
(GIEO~GllA C~CO]P) .~9~UllN~ 1E~VllcelE
~:2. AGRICULTURAL EXTENSION SERVICE
UNIVERSITY OF GEORGIA AI~D THE STATE OEPARTMf:~T OF AGRICULTURE
AthE:ris, Qeorgia
JUN 24'59
L1BRI\Rl
S. DEPARTMENT OF AGRICULTURE GRICUI..TURAL MARKE"I~~G 5E;:RVICE 3:9 EXTENSION BLDG ATHENS, GA.
. June 22, 1959
GEORGIA 1959 SPRING PIG CROP UP
The G~orgla spring pig crop for 1959 Is estimated at 1,787,000 head .. This is an increase of 18 ~ercent from the 1958 spring crop of I ,SII ,000 head. The 1959 spring crop' is the largest ever recorded in the State. A total of ~59,odo sows farrowed this spring and producers saved a record breaking average of 6.9
pigs from each sow. Georgia's 1959 spring crop is the 10th largest in the
nation being exceeded only by 9 important corn-belt States.
Based on growers' breeding intentions as of June I, 195,000 sows are expected to farrow in Georgia this fall. If these plans are real ized the 1959 fall farrowings will be about 8 percent larger than last year. Georgia ranks 9th in the nation on expected fall farrowings for 1959.
This report is based on a survey of farmers from all areas of Georgia. These returns were obtained in cooperation with the Post Office Department through rural mail carriers.
SOWS FARROWED AND PIGS SAVED ~PRING-(Dec. I to June I): - FALL (June I to Dec I)
Sows. Av. No. Farrowed: Pigs Per
-----------.:...(000) : Li tter
GEORGIA:
: Pigs: Sows: :Saved: Farro~ed: . (OOO): (000) .
Av. No.: Pigs Pigs Per: Saved Li tter . (000)
lO-Year, 1948-57
1957 1958
19~9
197
6.4
1,266
171
6.4
1,092
212
6.8
1,442
174
6.6
1,148
229
6.6
1,51 I
181
7.0
1,267
259
6.9
1,787
195*
UNITED STATES:
IO-Year, 1948-57
1957 1958 1959 "
8,164
7,277 7,428 8,266
6.70 54,S31 5,299 7. 12 51 ,8 12 5, 12/.. 7.05 52,336 5,912 7.08 58,494 6,394*
6.73 35,655 7.06 36,148
7. 17 42,370
* Number to farrow, indicated from breeding intent-ions refiorts
ARCHIE LANGLEY Agricultural Statistician In Charge
WILLIAM E. KIBLER Agricultural Statistician
UNITED STATES PIG CROP REPORT - JUNE 1959
The 1959 spring pig crop totaled 58,494,000 head, an increase of 12 percent from the 1958 spring crop, dnd the largest spring pig crop since 1951. The number of sows farrowed this ~pring totaled 8,266,000 head, which was II percent more than the 7,428,000 sows farrowed in the spring of 1958. The number of pigs saved per 1itter averaged 7.08, compared with 7.05 a year earlier and the record high of 7.12 pigs per I itter in the spring of 1957. Breeding intentions reports indicate a total of 6,394,000 sows to farrow this fall. This would be an increase of 8 percent over the 5,912,000 sows that farrowed In the fall of 1958. If these
farrowing intentions materialize and the number of pigs saved per litter equals
the average, plus an allowance for upward trend, the 1959 fall crop would be 46 million'head. The combined spring and fall pig crops for 1959 would be 104.5 million head, 10 percent above 1958 and 16 percent above the 1948-57 average.
The number of hogs 6 months old and over on farms and ranches June 1 was II percent mor~ than a year earlier.
SPRING PIG CROP UP 12 PERCENT
The number of pigs saved in the spring of 1959 (December 1958 through May 1959) is estimated at 58,494,000 head. This is 12 percent more than the 1958 spring crop of 52,336,000 head, 7 percent more than average and the largest spring crop since 1951.
The 1959 spring crop was larger than a year earlier in all regions. Increases were as follows: North Atlantic, 10 percent; East North Central, 9; West North Central, 10; South Atlantic, 19; South Central, 24; and West, 16 percent. All regions, except the North Atlantic, saved more pigs in the spring of 1959 than the respective 1948-57 average.
The number of sows farrowed in the spring of 1959 totaled 8,266,000 head,
11 percent more than last spring and 1 percent more than average. Spring farrowings were down less than 1 percent from breeding intentions as reported last December. Changes by regions were varied, with farrowings up from intentions in the':North Atlantic and South Atlantic; down from intentions in the West North I Central and the West and approximately the same in the East North Central and
South Central. The percentages by regions that the 1959 spring sows farrowed were of 1958 compared with the intentions as reported last December are as follows: North Atlantic, 109 percent now and lOS percent last December; East North Central, 108 and 108; West North Central, 110 and 112; South Atlantic, lIS and III, South Central, 121 and 121; and West, 116 and 121 percent.
The 7.08 pigs saved per litter this spring is the second highest on record, exceeded only by the 7.12 pigs saved in the spring of 1957. The 1958 average was 7.05 per litter. The West North Central is the only region to show a smaller number of pigs per litter than in the spring of 1958. Since 1950, the average I itter size of the spring crop has increased each year except for 1958. The average for 1959 is 12 percent more, than the 1950 average.
)95~ fA~L I~TE~rIONS y~_8 PERCENT
Reports on breeding intentions indicate that 6,394,000 sbws will farrow during the fall season (June through November) of 1959. If these intentions are realized, the nuniber of sows farrowing this fall will be 8 percent more than during the fall of 1958, 21 percent more than the average, and the largest number since the fall of 1943. Compared with last year, all regions showed increases in
the number of sows intended for fall farrowing. The largest percentage increase
is reported in the South Central which is up 14 percent. The South Atlantic and the West each show a 10 percent increase. The West North Central is up 9 percent, the North Atlantic up 6 percent, and the East North Central up 4 percent
These changes from last year are based on bre eding intentions reported by farmers about June 1.
If fall farrowing intentions materialize and the number of pigs saved per
I itter equals the average, with an allowance for upward trend, the 1959 fall pig crop will be about 46,000,000 head. This would be the second largest fall crop of cecord, exceeded only b,: the 47,584,000 pigs In 1943. The combined pig crop of 1959 would be 104,494,000 head, 10 percent above last year, and 16 percent
above average. A crop this ~lze would be the third largest of record, exceeded
only by 1942 and 1943.
-1.5
GIEO~CGnA ce~(Q)~, ~IElP'(Q)~1rllNCG ~I&~VllCE
AGRICULTURAL EXTENSION SER,VICE UNIVERSITY OF' GEORG lA' AND 'THE " STATE"D'EPARTMENT OF AGRICULTURE
Ather,SI. ~e9rg'ia' ,
LUPINE SEE
UNliTr.SITY OF GiORGIA
IJUN 2 b '59.
LfsRARf
U. S. OEP~RTMENT OF AGRICULTURE AGRICULTURAL MARKETING SERVICE 319 EXTENSION BLDG., ATHENS;'GA~
June 23, 1959
.; .1
'I I PERCENT
GEORGIA: ,,~,P.,;'C?du'ction 'of'lupine see~ in 1959 is es'timated at 6,400,000 pounds compared with 5,740,000 pounds in 1958, an increase of 11 percent.
The current crop is only 22 percent of ,the 1948-57 average produ~tion Oil ~ 29,171,{l00 pounds,. Of the 6,400,000 p'ounds ha ryes ted, 5,120 ,,000..p.ounds is b,l ue lupine'~nd 1,280,000 Is sweet lupine. The Georgia crpp amounts to 64 percent of the total for country. Frequent rains during the harvesting season ca~5ed
heavy shattering of seed and yields were reduced. Some of the intended acreage
w?s, ~ot,hary'e~ted.
, Acteage harvested for seed Is indicated at 8,000, compared w'ith 7,000 .in 1958 and 34,800 for the (1948-57) average.
Yield per acre of 800 pounds is 20 pounds below 1958 but 26 pounds above the (1948-57) average of 774 pounds.
UNITED STATES:" T.he 1959 production of lupine seed is f~recast at 10,025,000
.' .'"
. ! pounds t: of wh i ch 8,589,000 pounds are blue Iup i n~. and I ,436,000
pounds are sweet lupine. The current production is 3 percent under last year's
crop of 10,350,000 pounds -- 8,833,000 pounds blue and 1,517,000 pounds sweet--
but only one-fifth as large as the la-year average. The deterring factors which
have beset the principal use of lupine as a soil-building crop such as difficul-
ties in establ ishing a stand, winter-kill, disease, insect damage and others
teamed up with the rains at seed harvesting time to again reduce the acreage cut
for seed.
This year's prospective crops are below last year in Alabama, Florida and South Carolina. In Georgia the reduction in the establ ished acres of the southwest was more than offset by increases in the eastern producing area, resulting in a modest increase for the State.
Acreage harvested for seed is indicated at only 13,000 acres, down 12 percent from last year and the smallest acreage since 1944. Sharp declines from last year occurred in all States except Georgia where the increase of 1,000 acre~ represents mostly small acreages reported by farmers in the easterly area.
Carry-over of old lupine seed on farms, estimated at only 378,000 pounds, is the smallest since 1949 and compares with 1,188,000 pounds last year and the average of 1,475,700 pounds. A report on the stocks held by dealers as of June 30 will be issued on August 4.
Imports of blue lupine seed durihiflhe 10-month period ending April 30, 1959 totaled 2,242,000 pounds -- all from the Union of South Africa. This is the largest total of record and compares with negl igible lupine imports a year earlier, and the 5-year average of only 20,400 pounds.
(over)
.. -- -,--- ----- ------ ~_.
j,,'
;
\,,~,':, ..... ','
.. ,
,t ~
"
.\-
,:'
, :~
~~ :., :r.. I , "
, ' , .~
- 2-
.~: 10:,.,
. ,: ."
".
.~ :' '.:' , !!10....!'_ !..-
1959 .LUP 'NE :S'EED FORECAST BY STATE~ WJTH:: COMPARISONS
' ' ,1~
, " '_ : ~
_.'
I
"'I'
'.<:~
, . , ., ,
: Acreage"Harvested :Vield Per Acre --~ :-productio~ (cl~~ri-:s'eed)
State ;Ave rage -: -195~.:~:1nCii~;Aver.a~e%~ :r9:S8~:Tn4t";;Average:- )958- :- InCif: -
:1948-57 : .... :cated:'1948-S7: . ':catedc:1948-57:
: cated
'.... . :
:
..: l 5 ~:
,IQlL
Q
~
.:.
. . L , ~
: 19J1t:9~
: . . '.~,,' i...i}.;.,.,,l'Q_..5'IQII. _ ,
.
.
Acres ,,' .'_
Pounds.- Clean.
Thousand pounds
.
. .' ..' .
. ,....
; . , '-. ..: i I'
:.,.,S.,. C. :_;"I~"::' 7~}~
5,000 3.500 971
630 800 . ~,998 . 3,150,- ,".2".,800
Ga._., '.! ,.3,4,80Q,
. Fra . ' . n, 500 .
A~~.. .... 6;830
,'''.;J I
":,
"
'"
7,.000.:8. 000 1.800 1,000 1.000 500
774 820 ;49 : 450 694' 650
800 29,171.-..: 5,740:" .6,400 500, . 5,468 810: , ~J 500 650 5,435 650 .',.,:325
'
.. U.
S".':) I
-.
,.... -.
60.880'
14,800 13,000
720
,:: ".
699' 771 .. 47.07'1, 10,350 .: H):,025
&; " : ~
.... . '. . CARL O. DOESCHER
.' '. !-\9.ri~ultural Statistician
I: ; , '. h--
:l I
'( .1::
, .. ,~.. '
..'
,1~
j , ' ,;
1 ;,
"
,.
!.... !
" , ":
,\1': ,. ,
,( :', l\',' ...,J..
-:)
t
i:.: "'
", I', ,
" (~, ~
\
! : : ,l
'1;
;
! ",r;
ARCHIE LANGLEY
Ag r I cu-!. tlilral ' Sta t i 5 tie i aD: tii Ch,1r~
\' ') 'j
;' ;. ;:;.
.... ;
.{: ',. \- Cr;
i.
(~ ':'1 I ':
" 'i ~ ,:, '
. _.' ..,'j
'r,. ,.
r
'i
L'; ';
,~'.\'
, ): ;', t
,'"f ,
:
, '"
I'
:
.:","-,
"'
~'... ' r' ~
, i~ :. 'I '\ ~ l""':, I:J
"
.~ r. f
..
'OJ
,.
,"
,,';';
..
.,
.' J\'
;:" :.
I. ;J
. '::~ :
I. ,f,.:
, : .. : ::'l
?;IS
D9tJb
3
hCGE(Q)~(GllA ce~(Q)~ ~illllMCG ]EIR{VllCIE
AGRICULTURAL EXTENSION SERVICE UNIVERSITY OF GEORGIA AND THE STATE DE~ARTMENT OF AGfUCUL,URE
Athens, Georgia
. JUN 25'59
L\BR~RIS
U. S. DEPARTMENT OF AGRICULTURE AGRICULTURAL MARKETING SERVICE 319 EX'rENSloN BLDG., ATliE~IS, GA
June 23, 1959
CRIMSON-~LnVER SEED FORECAST
'.
' '.
Crimson Clover Seed Pr.oduction Reduced by Heavy Rains
GEORGIA: Heavy rains during the harvesting season drastically reduced the 1959 Crimson Clover seed crop. Forecasts, which al!ow for losses
from s~attering and abandonment of acreage for seed harvest indicate the 1959 Georgia crimson clover seed production at 1,365,000 pounds. This is the smallest crop since 1945, with the exception of the 1955 when the severe March freeze caused serious damage. The curre~~ production is only 39 percent of last year and 33 percent of the (19~857) average. Acreage for harvest of 13,000 compares with 26,000 last year and is only 47 percent of the (1948-57) average of 27,400 acres. The prospective yield per acre of 105 pounds is 30 pounds below 1958 and 41 pounds less than the 10 year average.
UNIT~D STATES: The 1959 crep of crimson clover seed in the Southern States is ----- forecast at 6,532,000 pounds, about one-half the 1958 crop of
13,015,000 pounds and only two-fifths of average. The current crop is the South's smallest since 1940. Reseeding varieties, suchias Dixie, Auta~ga, Aubu~n and others, total 3,721,000 pounds compared with 7,670,000 pounds in 1958.
A foreca~t of the late harvested crimson clover seed crop in Oregon will be released August 14 along with the forecasts for other winter-cover crop seeds.
Last fall IS dry weather was unfavorable for establishing crimson clover stands, but the slow start was partly offset by good growing conditions this spring and seed prospects were excellent. However, when the crop matured, frequent and heavy rains during late May and early June shattered out much seed. As a result, intentions to harvest seed from some acreage were abandoned, and yields from the acreage finally harvested were much below earlier expectations.
The forecast of 57,000 acres harvested for seed in the Southern States is 39 percent under the 93,000 acres harvested in 1958 and 49 percent under the average. All States, particularly Georgia, reported extensive abandonment of acreage.
The prospective yield, averaging 115 pounds per acre, compares with 140 pounds in 1958 and the average of 148 pounds. This low yield reflects the heavy loss of seed from shattering caused by frequent and heavy rains.
Favorable spring weather pushed crimson clover seed development to the harvest stage 5 to 10 days earl ier than last year and somewhat earl ier than the usual maturing date. The average date on which harvest began was May 20 in Georgia; May 22-24 in Mississippi, Alabama, and Arkansas; May 26 in South Carolina; and June I in Tennessee.
(over)
--
a .... __
-
-
- _ . _ .. __ ... __ _~._,
"
_
ii
.\
2-
_,J,
Carry-over of aid crimson clover seed on farms in the Southern States Is
estimated at 519.000 pounds and cOmpares with 473,000 pounds a year ago. A
report on stocks held by dealers as of June 30 will be issued on August 4.
Imports of crimson clover seed for the ten months ending April 30, 1959
totals 2,921,000 pounds -- 1,687,~00 from Italy, 496,000 fromFrance,~nd the
remainder from GerrflrlJt\~~ Great Britain. Hungary, Yugoslavia. Canada, Netherlands
and Denmark. Imports during a similar period a year earlier totaled.. 2.504.30Q~'.~,
pounds, and for the year ending June 30, 2,5~8.300 pounds . ,.
,1. ",>
,.~
The 'following 'table shows the 1959 forecast for Southern States, with, , ..
campari sons.
.
. ",'."
---
State
:,... -
,.~
_-. _A-"cr-.es-
hea-- r-ve-ste- d-
.: - , - . - -
~ ...
-
-Yi-el-d~ . -P_e-r_-a.c..-re-
-
-:. -Pr-od- uc-.tio- n- (-Cl-ea-n -s,e..~ e_d-).,. '
;r9 :Average .:',
:'Indi-' : Average , : " :'Indi- ":Average
: Indl-
:'948-57 ~
+- - - - -
-195-8-'-:~fa~~ed-
;1948-57';
-----
1958
---
-
-
~t 9-d
;1948-'57~
- -- --
1958
---
-,:-~9t~9d
,,
- Acres -
",
- Pounds -
Thousand pounds
s. c. JI':4,.833 '4.500' f.500 J/133
ISO
.'
125
JI 656
,675
312 .
Ga., . 27.460' 26,00.0 13,000 14~
135 105 4,Q83 ,3,510 1,365. ,
Tenn.' 41.100' 27,000 18,000 145'
145 110 S.930 3,915 1.980
Ala. 28.990 24,000 15.000 147
120 1.20 4.322 2,880 J. ,800
MAriks~s.
J /' '6,944 1/4,jll
5 506 ' 4 000 1/138 6:000 '4:500 1/211
130. lOa 1/972
715 400,
220 150 J/903 1.320 675
- - - - ,- ... - - - - - - -',- - - - - - - - - - - - - - - '- - - - - - - - - - - - -
Total So.
States 11~~970 93,000 57,000 . 148 .',140 115 16,613 13,015 6;532'
- - - - - - - _:- -- - - - - - - - - - - - - - - - - - - - II--..;S,.h(j~_,:~;-."t. ime average.
-
---
-
'
- :"'~ '; .
CARL O. DOESCHER
ARCHIE LANGLEY
,
Agricultural Statistician'
Agrl cu It'ura l':'Stat ist ic ian 'lr(Charge.
,(
,
I
",'
, \.
/-.1.. ' , '
."
, 'J,
t
'.I '":
':,~.
" \",
",' ot
.\ ,"
,,' ,
'.
, , ,~ ;',; :'
.,
.. : .~:.
".
,t', ,"
,1 '
'~
.
---,~J
.~
,.;"~
'J
.~
('
I
~~J(.~ ..,.
~"'f~~~. ~.".
:~t.o
1 l
,;'"7'4;
,.,., \
I
t\'\'
I ,114
..- I ."
I
.\ . t'~,.,..
?:..;~
.
.
\',,,V .. I
~. \i~ \
...."
"'.".~Ili),~'-
,' .....~
GEORGIA CROP' REPORTING SERVICE
'. / .t't 1< \\/ r.r J, ~ \Jj
r -J r r t I,
J /\
-1\'
- - UNIVERSITY
I Jr fJ \/'
s-J
j,\" J:
QRGiA
Release 6/24/59
GEORGIA CHICK HATCHER Y REPORT
JlJl~ 2 5 '59
LlBRI\Rlf"'-
Athens, Ga . June 2~1: -- A total of 6, 807J.,.OOO-crraUerChicks were placed
with producer s in Georgia during the week ending June 20. accorditig to the
G20rgia Crop Reporting Service. This compares w.th the 6,961.000 placed the
preyious week and is 5 percent less' than the 7, 153, 000 placed the same week
la6~ year.
'
Eggs set by Georgia hatcheries amounted to 9. 210,000 compared with 9, 312, 000 the: previous week and is 1 p~rcent more than the 9, 082, 000 for the
. co~'responding week last year. ,
The majority of the price s paid for Georgia produced hatching eggs were: reported within a range of 45 to 65 cents with an average of 54 cents for all hatch.,. ing eggs'and 51 cents for eggs purchasedat the farm from flocks with hatchery owned coc~e;rels, Last week the range. w~s from 40 to 60 cents w.it~ .an ~v:~~aG~ : of 52 cents for all hatching eggs and 49 cents for eggs purchased at the farm from flocks, with hatchery owned cockerels. Most prices cl}arged for .chicks were reported within a range of $8.00 to $10.00 with an average of $9. 00' per hundred compared with a range of $8. 00 to $9.50 with an average of $8. 75 per hundred last week. The average prices last year were 79 cents for eggs and $13.75 for chicks .
. ;. Weighted av~rage p~ices from the Federal:'State Ma_rket' News Service for broilers during th~ week ending June 20 are as follows: Georgia broilers 2 3/4-
3 '3/4 pounds .a;t faims 15.22f.
'M'"
GEORGiA: EGGS, SET, HATCHINGS, ,AND CHICK PLACEMENTS
We'ek
1 Ending
BROILER TYPE
. l EGG TYPE
Eggs Set !!
Chicks Placed for
IEggs Chicks
Broilers in Georgia. Set Ha\ched
1958
1959
1
1959 %
of 1958
1958
119,5'9 0/0
1959 of 1958 1959 1959
Thou. Thou. I Perc~nt Thou. Thou: Percent Thou. Thou.
Apr. 18 Ap:r:.25 May 2 May 9 May 16 May 23 May 30 June 6 June 13 June 20
9,265 9, 544 9,428 9,204 9,589 9.766 9,668 9.616 9,360 9.082
9,778 9,480
9.632 9, 570
9.251 9.236 9,236 9.276 9,312 9,210
106
99 102 104
96 95 96
I 96 99
I 101
6,709 6,826 6,857 6.934 7,237, 7.113
17. 151 7, 111
1 7,063 7. 153
,
7,477 7.319 7,244 &,996 7, 165 7,053 6.951 7,002
6.961 6.807
- III 107 106
" 101 . 99
99 97 98
I 99 95
"?25 669 " 559 588
574 513
395 423 373 .494. 280 435 239 184 245 169 165 179 218 166
1) Includes eggs set by hatcheries producing chicks for hatchery supply flocks.
ARCHIE LANGLE Y Agricultural Statistician In Charge
W. A. WAGNER Agricultural Statistician
u-.-
---
S.
-----------
Department
--
of
-----------
Agriculture
-
-
-
-
-
--------
-----------------------------
Agricultural Extension Service
-
Agricultural Marketing Service
State Department of Agriculture
319 Extension Building, Athens, Georgia
------------------------------------------------------------------------
STATE
EGGS SET AND CHICKS PLACED IN COMMERCIAL AREAS, BY WEEKS - 1959 PaQe 2
Week Ending
June'
6
June
13
June
20
May
16
May
23
May
30
June
6
June
13
June
20
EGGS SE T - THOUSANDS
CHICKS PLACED - THOUSANDS
Maine
1,426
1,483 . 1,513
1,232 1,240 1,267 1,275 1,310 1,228
Connecticut
1, 019
988 1,069
566
533
664
505
590
635
Pennsylvania
1,287
1,422
1,256
855
888
786
844
913
677
Indiar.a
2,079
1, 827
1,800
775
885
759
872
810
831
Illinois
239
184
203
144
99
135
123
100
110
Missouri
1,664
1,700
1,837
782
756
670
733
742
839
Delaware
1, 873
1,976
1,864
1,908 1,672 1,753 1,699 1, 755 1, 742
Maryland Virginia
2,972 2,247
3,017 2,200
3,038 2,047
1,637 1,884 1,832 1, 832 1,905 1,869 1,241 1, 251 1,223 1,243 1, 168 1,322
West Virginia
322
314
319
7)7
585
723
575
658
533
North Car olina 3,731
3,7~8
3,772
3, 128 2,933 2,998 3,016 3,037 3,019
South Carolina
549
530
537
336
337
365
351
338 . 339
GEORGIA
9,276
9,312
9,210
7, 165 7,053 6,951 7,'002 6,961 6,807
Florida Alabama Mis sis sippi Arkansas Louisiana Texas Washington Oregon California
402 4,170 3,032 3,974
697 3, 157
452 383 1,570
404 4, 151 3,.234 '11, 118
696 3,262
386
413
1,433
. 363
4,006 3,067 4,155
667 3, 153
337 408 1,440
196 3,493 2,416 3,479
396 2,023
343 244 1,091
211 . 3,446
2,498 3,428
394 2,097
399 244 , 995
188 3,404 2,465 3, 501
423 2,200
371 227 987
178 3,413 2,485 3,551
400 2,312
377 268 '1,033
223 3,368 2, 533 3,566 :
'448
2, 306
374 276 978
231 3,470
2,439 3,398
468
2,299 384 247
1, 103
TOTAL 1959 46,521
TOTAL 1958 . 51, 023
1959 % of 1958
91
46,758 50,305
.. 93
46,061 49,697
93
34, 187 33,828 33,892 34,087 34,359 33, 990
35, 504: 36, 390 36, 532 36, 562 36,900 36,889
96
93
93
93
93
92
3 taJE(Q)~(GHA ce~J)r -
AGRICUL.TURAL. EXTENSION SERVlCE UNIVERSITY OF GEORGIA AND THE STATE DEPARTMFNT Or:: JA~RICUL.TU~E
Athens, Georgia
~
3~
~1EIP(Q)IRillllNG ~IE~VH(cE
-
..-..r~
U. S. DEPARTMENT OF AGRICUL.TURE AGRICUL.TURAL. MARKETING SERVICE 319 E.XTENSlor, BL.DG., ATHENS. Gl\.
June ;1959
GEORGIA COTTON: ACREAG:
IDUCTION, 1958
J (These estimates. are 'bused on the h~~~t available da~a and. are preiimi~ry)'
,Planted Acres
DISTRICT I Bartow catoosa Chattooga Dade Floyd
Gordon Murray Paulding Polk Walker Whitfield
Total
DISTRICT II
Barrow Cherokee
Clar~e
Cobb Dawson De Kalb Fannin Forsyth Fulton
G1lm~r
Gwi nne t t Hall. Jackson
Lumpki~.
Oconee'
P1cke~s
To'WIls Union Walton White
Total
6,830 ,300
1,820 200
3,'310 4,230 1,360
460 2,170 ... 650
460
21,790
1,,330 80 520 230 20 140 o 270 500 o 510 290
2,790 10
2,330 .: 90
o o 4,840 60
14,010
Harvested Acres
Planted Pounds
Harvested Pourids
6,635 .295
1,'790 200
3,270 4,165 1,330
450 2,130
635 450
21,350
1,310 80 510 225 20 140 o 270 490 o 500 285
2,730 10
2,300 90 o o
4,770 60
13,790
539 .. 490 ". 306 255 392 h31 246 363 429 265 239
!~25
502 350 373 257 300 350
0,
326 346
o
492 359 398 400 508 322
o o
500
367
456
555 498 " 311 " 255 396 438 251 371 437 271 244
434,
510. 350 380 262 300 350,
o.. 326 353
o
502 365 . 407 400 515 322
. '0
.0
507 367
463
7;690 .. 310 1,160
105 2,710 3,810
700 350 1,940 36b 230
19,365
1,390 60 400 125
. 15
100
o 185
. '360
o
520 220 . 2,320 10 2,470 60
o o
5,050 45
13,330
Page 2-
.
..
GEORGIA CO'ITON: ACREAGE, YIELD AND PRODUCTION, 1958
. (These estimates ~re based on the latest available .data and are prelimina~y)
District Q.nd
,,
Acreage
CoUnty I Planted Hnrvested
Acres : Acres
:
:
DISTRICT III Bunks Elbert Franklin Habershom
H~rt
LincoL'1 Madison Oglethorpe Rilbun Stophens Hilkes
Tot~l
840 3,610 1,'660
30 '3,470
810 2,950 2,410
0 200 1,270
17,250
830
3,555 1,611-0
30 3,420
795 2,895 2,370
0 195 1,245
16,975
DISTRICT IV Carroll Chattahoochee Clayton Coweta Douglas
Fayett~
Ha.ra.1son Harris Hea.rd Henry Lama.r lvlacon Marion Meri't",ether Muscogee Pike Schley Spalding Talbot
T~y1or
Troup Upson
2,390 30
240 2,400
200
970 370 610
590 1,940
500.
5,790 1,340 4,530
90 2,500 1,620
440
530 3,270
780 240
Tota.1
31,370
2,365 30 240
2,380 200
955 365 605 580 1,915 490 5,720 1,315 4,460 90 2,485 1,595 430 525 3,240
775 235
30,995
,
:
.,,
Yield Lint Per l.cre
,
:,
Production 500 Pound
Planted : Harvested 'Gross Weight
: :
Pounds
: :
Pounds
:
,,
Bules Bales
593
600
1,040
478 481
486
3,600
487
1,670
333 501
333
20
508
3,630
295
301
500
525.
535
3,230
393
400
1,980
0
0
0
430
441
180
319
325
850
464
471 16,700
330 200 354 348 290 435 349 331 359 437 240 525 309 399 222 404 430
- 334
0313 602 314 279
424
333
1,640
200
15
354
175
351
1,750
290
120
442
880
353
270
334
420
366
440
442
1,770
245
250
531
6,350
315
860
405
3,770
222
40
407
2,110
436
1,450
342
310
316
350
608
4,110
316
510
285
140
429 27,730
./
Page 3
GEORGIA CO'ITON: 1'.CREAGE, YIELD fJID PRODUCTION, 1958
(These estimates are based on the latest avaiJnb1e data and are preliminary)
. District
and
: :
Acreage
:
Yield Lint Per Acre : Production 500 Pound
County
:
:
:
:
:Gross Weight
Planted
: Harvested : Planted
:
:
. : Harvested Bo.les
Acres
:
J~cre6 : Pounds : Pounds : Bales
DISTRICT V
Baldwin Bibb Bleckley Butts Crawford Dodge Greene Hancock Houston Jasper Johnson Jones Laurens Monroe Montgomery Morgan Newton Pea.ch Pulaski Putnam Rockdale Taliefertlo Treutlen Twiggs Washington Wheeler Wilkinson
Total
660
130 2,480
890 590 5,000 740 3,720 2,350 1,160
6,730 130
12,500 210
1,850
5,330 1,710 1,050 3,520
440 810 620 1,640 1,420 6,840
350 600
63,470
DISTRICT VI Bulloch Burke Candler Columbia Effingham Emo.nuel Glascock Jefferson Jenkins McDuffie Richmond Screven Warren
9,530 19,500 3,740
750 440
8,330 2,520 10,800
5,240 2,520
660
6,330 5,400
Total
75,760
645
330
125
362
2,410
410
880
356
585
491
4,905
386
725
359
3,660
313
2,300
463
1,135
386
6,580
444
125
246
12,220
386
205
281
1,810
358
5,225
440
1,690
408
1,035
584
3,440
386
435
3ll
775
462
615
263
1,615
388
1,380
337
6,720
471
345
483
585
220
62,170
405
9,400
491
19,090
413
3,650
512
735
269
435
332
8,140
455
2,475
407
10,620
439
5,130
433
2,475
417
650
377
6,245
516
5,290
344
74,335
439
338
460
376
100
422
2,120
360
660
501
610
394
4,030
367
560
318
2,430
473
2,270
395
940
454
6,230
256
65
395
10,100
288
125
366
1,380
449
4,890
412
1,460
592
1,280
395
2,830
315
290
483
780
265
340
394
1,330
346
1,000
480
6,740
490
350
226
280
413
53,650
498
9,770
421
16,800
524
4,000
275
420
336
300
465
7,900
414
2,140
447
9,900
442
4,730
425
2,190
383
520
523
6,820
351
3,880
447
69,370
Po.ge 4
GEORGIA COT:'ON: ACREJ.GE:, YIELD A_TID PRODUCTION, 1958
'
(Tilese e6ti~te6 are based on the ~atest available data and are preliminary)
"
District and
County
: :
.:
Acreage
Planted : Acres :
Ho.rvested Acres
;
:
Yi e J.d Lint Per ....ere
: Production
: 500 Pound
:
:Gross Wcig~t
Plo.nted : Ho.rYested : Bules
:
Pounds :
:
- - - . - - Pou.'1ds
Bal~s
DISTRICT VII
Baker
1,770
1,740
272
277
1,010
COJllOun
2,880
2,850
424
429
2,550
Clay
1,260
1,250
282
284
740
Decatur
1,950
1,910
459
469
1,870
Dougherty
1,370
1,345
277
282
790
Er..rJ..y
8,320
8,210
442
448
7,680
Grady
3,050
3,015
446
451
2,8)+0
Lee
1,750
1.715
422
431
1,540
}Ililler
4,450
4,400
390
395 .
3,630
Mitchell
9,070
8,960
3~rO
374
1,000
Quitmo.n
360
355
289
293
220
Randolph
2,620
2,585
453
459
2,480
Sem.i.nole
2,810
2,840
481
1186
2,880
Ste'\'1art
1,600
I J 580
391
396
1,300
Sumter
5,010
4,540
'560
568
5,860
Terrell
5,630
5,540
513
521
6,030
Thomas
4,740
4,670
1~88
496
4,830
"1ebster
680
660
329
339
470
Total
59,380
58,565
433
439
53,720
DISTRICT VIII Atkinson Ben Hill Berrien Brooks Clinch Coffee Colquitt Cook Crisp Dooly Echols Irwin Jeff Do.v1s Lanier Lowndes Telfair Tift Turner Wilcox vlorth
310 2,580 2,680 5,400
20 3,220 16,200 2,120 6,140 11,500
30 6,250 1,240
230 2,080 1,240
5,230 3,510
4,L~60
14,300
305 2,540 2,625 5,290
20 3,150 15,870 2,660
5,975 11,240
30 6,135 1,210
225 2,040 ],.,220
5,135 3440 4,350 14:030
-348
411
332
392 200
366
486 . 464
'575
;.
542 200
1\39
420
278
'364
344
363
345 471
416
354
230
418
2,210
339
1,860
400
4,410
200
10
374
2.,460
496
16,400
475
2,640
591
7,370
555
13,000
200
10
448
5,730
431
1,090
284
13~
372
1,580
349
890
370
3,960
352
2,530
483
4,390
424
12,400
Total
89,340
87,490
447
456
83,305
Page 5
GEORGIA COTTON: l.CREAGE,. YIELD .1'JID PRODUCTION, 1958 (These estimates are besed on the latest evailabJ data and ere preliminary)
District and County
Acreage
:
. :
. : Planted
Harvested :
:
:
:
Acres : Acres :
Yield Lint Per Acre
: Production
: I
: 500 Pound
:
:Gross Weight
. . Planted : Harvested : Bales
Pounds : Pounds : Bales
DISTRICT IX Appling Bacon Brantley Bryo.n Co.mden Chc.rlton Chatho.m Evans GlYnn Liberty Long McIntosh Pierce Tc.ttnall Toombs Wa.re Wayne
Totc.l
STATE
2, 6!~0 1,130
10 40
0 10 10 2,010 0 60 50 10 410 3,330 4,280 170 1,470
15,630
388,000
2,605 1, 110f
10 40
0 10 10 1,950 0 60 50 10 400 3,275 4,180 170 1,450
15,330
381,000
447
453
2,460
412
420
970
200
200
5
500
500
40
0
0
O.
200
200
5
200
200
5
458
472
1,920
0
0
0
250
250
30
540
540
55
200
200
5
373
382
320
430
438
2,990
511
523
4,560
329
329
115
439
445
1,350
455
464
14,830
435
443
352,000
. CJ.RL 0.. DOESCHER Agricultural Statistician
ARCHIE I.lI.NGLEY Agricultural Statistician In Charge
>,
..-. "
.-- ..
,...
:..
~'"'.t;""r
"
"
.
r ~
a .'.' l/~ .\{~rl~', r"'"'~-~'I{I;:,'
!~.ff/l;.4.'J:~ :j,,pI"."},I,~'\
/<l.~.~ ~,\~~\J\ . :t
..- ,....~ .,..,-.','1.",\'.'i.t"..,
.1,'I'I, , j-II,
I. ' . 1
" ',' ..~
,~.~
.. ~
\
J~
"
If " )..f\o,.-' "',,.\\\\\v
"1,:,.I-' "~" ...
f \'
\ < :\
....
~
GEORGIA CROP REPORTING SERVICE
\I\I/ r"r J1< t~
}-j
.WL 2 '59
Release 7/'1 {59
GEORGIA CHICK HATCHERY REPORT
'" 1-
.I.IRR,A-R-I-~:S.,.----.1
Athens, Ga., July 1 - - A total of 6,922, 000 broiler chicks were placed with producers in Georgia during the. week ending Jur.e 27, according to the Georgia Crop Reporting Service. This compares with the 6, 807,000 placed the previous week and is 1 percent more than the 6, 878, 000 placed the same week last year.
Eggs set by Georgia hatcheries amounted to 9,210,000 compared with
9,210, 000 the previous week and is 6 percent more than the 8, 658, 000 for the corresponding ~eek last year .
. The majority of the prices paid for Georgia produced hatching eggs were
reported within a range of 48 to 65 cents with an average of 54 cents for all
,
hatching eggs and 51 cents for eggs purchased at the farm from flocks with hatch-
ery owned cockerels'., Last week the range was from 45 to 65 cents with an aver-
age of 54 cents for all hatching eggs and 51 cents for eggs purchased at the farm,
from flocks with hatchery owned cockerels. Most prices charged for chicks wer~
reported within a range of $8.00 to $10.00 with an average of $9. 00 per hundred'
compared with a range of $8.00 to $10.00 with an average of $9.00 per hundred
last week. The average prices last year were 79 cents for eggs and $13. 50
for chicks.
.
.
".
i
Weighted average prices from the Federal-State Mark~t News Service for
brbilers during ,the week ending June 27 are as follows: Georgia broilers 2 3/4 -.
3 3/4 pounds ,at ,farms 15.90f.
,GEORGIA EGGS SET, HATCHINGS, AND CHICK PLACEMENTS
.. '
-
BROILER TYPE
EGG TYPE
Week Ending
Eggs: Set 1.J
I
1958
1959
19'59 %
of 1958
Chicks Placed for Broilers in Georgia
Eggs Chicks S'et Hatched
1958
1959
1959 %
of 1958
1959
1959
Thou. Thou. ' Percent Thou. Thou. Percent Thou. Thou.
Apr. 25 May 2
May 9 May 16 May 23 May 30 June 6 June 13 June 20 June 27
9, 544 9,428
9, 204' 9, 589 9,766 9,668 9,616 9,360 9,082 8,658
9,480 9,632 9, 570 9,251 9,236 9,236 9,276 9,312 9, 210 9,210
"
99 6,826 7, 319' 102 6,857 7,244 104' ' 6,934 6,996
96 7,237 ..7,165 95 7,113 ' 7,053 96 7, 151 6,951 96 7, 111 7,002 99 1,063 6,961 101 7, 153 6,807 106 6,878 6,922
!
107 106 101
99 ' 9'9
97 98 99 95 101
I :
559 588 574 513 395 423 373 494 280 4'35 239 184 245 169 165 179 218 166 49 190
1/ Includes eggs set by hatcheries producing chicks for hatchery supply flocks.
ARCHIE LANGLEY Agricultural Statistician In Charge
w. A. WAGNER
Agricultural Statistician
u-.--S-.-
------------------------
Department of Agriculture
-
--
--
-
--
--
-
--
------------
Agricultural
-----------------
Extension Service
-
Agricultural Marketing Service
State Department of Agriculture
319 Extension Building, Athens, Georgia
------------------------------------------------------------------------
STATE
EGGS SET AND CHICKS PLACED IN COMMERCIAL AREAS, BY WEEKS - 1959
Week Ending
,
Page 2
June
13
June
20
June'
27
. May
23
May
30
June
(;>
June
13
June
20
June
27
EGGS SET - THOUSANDS
CHICKS PLACED - THOUSANDS"
Maine
1,483
1,513
1,488
1,240 1, 267 1,~275 I, 310 1,.228 . 1,263
Connecticut
988
1,069
I, 186
533
664
505 . 590 .. . 635
568
Pennsylvania
1,422
I, 256
1,225
888
786
844
913
677
735'
Indiana
1,827
I, 800
1,980
885
759
872
810
831
862
Illinois
184
203
222
99
135
1~3 : 100
110
136
Missouri
I, 700
1,837
1,823
756
670
733
742
839
799
Delaware
1,976
1,864 '. I, 772
1,672 1,753 1,6.99 1,755 1,742 1,694
Maryland
3,017 3,038 3,001
1,884. 1,832 1, 832 . 1,905 1,869 1,963
~
Virginia
2,200 2,047 2,230
I, 251 1,223 1,243 I, 168 I, 322 I, 124
West Virginia
314
319
354
585
723
'575
658 . 533
529 .
North Carolina
3,708
3,772
3,699
2,933 2,998 3,016 3,0'37 3,'019 2,926
South Carolina
530
537
526
337
365
351
338 .339
357
GEORGIA
9,312 9,210 9,210
7,053 6,951 7,002 6,961 6,807 6,922
.r~lorida
Alabama Missis sippi Arkansas Louisiana Texas Washington Oregon California
404 4, 151 3,234 4, 118
696 3,262
386 413 1,433
363 4,006 .
3,067 4, 155
667 3, 153. . 337 .. 408
i,440
366 4,030 3,032 4, 131
656 . 3,039
427 324 1, 331
211 3,446 2,498 3,428
394 2,097
399 244
995
188 3,404 2,465 1,501
423 2,200
371 227
I 987
178 3,413 2,485 3,551
400 2,312
.377 268 1, 033
223 3,368 2, 533 3,566
448 2,306
374 276 978
231 3,470 2,439 3,398
468 '2,299
384 247 1, 103
206 3,461 2,256 3,231
487 2,367
341 262 I, 108
1
TOTAL 1959
46,758 46,061 46,052
33,828 33,892 34,087 34,;359 33,990 33,597
TOTAL 1958
50, 305 . 49,697 48,628
36,390 36, 532 56, '562 36,900 36,889 36,2J~
1959 % 0 f 195-8
93
93
95
93 I 93
93
93 : 92
93
-
3/S-
CGlE:(Q)~<GllA ce~(Q)IP
AGRICULTURAL EXTENSION SERVICE UNIVERSITY OF GEORGIA AND THE STATE DEPARTMENT OF AGRICULTURE
Athens, Georgia
-
L1~ILw1H \~U~ ... llN(G IE~Vll(clE
UNlvlR:)lh OF GEORGIA '. S. DEPARTMENT OF AGRICULTURE
JUL 9 '59 _~RICULTURAL MARKETING SERVICE ~19 EXTENSION BLDG ATHENS. GA.
LIBRARIES
JUly 7, 1959
FIlRM PRICE REPORrAS-OF JUNE 15, 1959
GEORGIA: The All Connodity Index of Prices Received by Georgia Famers declined three points to 255 percent of its 1910-1914 average during the nonth
ended June 15, 1959. Lower prices for wheat, oats, barley, cotton, and beef cattle were prinarily responsible for the decline in the Index. Partially offsetting the decline were inproved prices for all hay, calves, turkeys, and all eggs. At nid-June, the Index was 11 points (4 percent) below a year earlier.
~1e oid-June average price received by famers for the two principal snall grain crops of wheat and oats declined sharply fran the previous nonth. The nid-June price of $1.77 bushel for wheat was the lowest rud-nonth aver~e since March 1946 when the average price was $1.75 per bushel. The average price of
$.65 a bushel for oats was lower than any nonth since Septenber 1942 whell the
r.rid-nonth average was, also, $.65 a bushel. The sharp drop in price of these two comnodities reflected the narketing of new crop grain. Badly weathered grain was partially responsible for the lo~ prices received, especially for oats.
UNITED STATES: During the nonth ended June 15 the Index of Prices Received by FanJers dropped one percent (3 points) to 242 percent of its
1910-14 average. Prir.m.rily responsible for the decline were lower prices for meat animals, wheat, nost vegetable crops, and DiD~. Partially offsettinG were sharply higher prices for potatoes. At Did-June the index was 3 percent below 0. year earlier.
The Parity Ratio dropped to 81, off 1 percent fran May 15, and 5 percent fran a year earlier. The June 15 Parity Ratio was the lowest since June 1957.
Sunmary Table for Georgia and the nited States
. Index
: June 15:
1910-14 := 100: 1958 :
UNITED STATES:
May 15, 1959
June 15, 1959
Record High Index : Date
11 : Prices Received:
Parity Inde~
Parity Ratio : GEORGIA
250: 294:
85 : .
245:
242
299:
298
82:
81
: :
y 313 :Feb. 1951
299 : Apr .1959
: 123 : Oct. 1946
Prices Received
All Comnodities 266:
258:
255
: 310 :Mnr. 1951
All Crops
: 274:
280:
275
: 319 :3!Mar. 1951
Livestock and :
:
:
:
:
17ProdUcts
: 245:
212:
211
: 295 : Sept. 1948
Prices Paid, Interest, Taxes, and Wage Rates based on data for the indicated
dates. gj Also May 1959. 1/ Also April 1951.
NOTE:
The UNITED STATES Indexes presented herein are those described in the
January 30, 1959 issue of Agricultural Prices, Supplenent 1, pages 39-44, liThe Revision of the Indexes of Prices Received by Fa~~rs and the Index of Prices Paid by Farners including Interest, Taxes, and Faro Wa~e Rates." Current parity prices are compute~ fran the revised index series.
ARCHIE LANGLEY Agricultural Statistician In Charge
RAYMOND R. HANCOCK AgriCUltural Statistician
PRICES RECEIVED BY FARME:RS JtNE IS, 1959 WITH COMPARISCNS
J
~'" ~ .. ~. 7
\1
- ~ - . ~~-:~--~.-It
....
, '.
': ~, t.','
~: :./ i...::. 1'.:',':'
GOORGIA
J~~~S! ~~5~5 - CO- M-iODITY .. l' ;:..j ...... I;./i.verage I
.AND mIT
1910-14
I
Wheat, bu.
$ 1.23
1.92 i 1.90
Oats, bu.
$1 .67
.79
.82
I
Com, bu.
$1 .91
1.55
1.34
,'.
. lNr.IED STATES.I_.' ._.'. _" '_'__.
J~~-i5~ f;~~:1 J~~~51~~5~5'.1i~b5
1.77 .65
1.34
.884.1 .399 .642
1.70 .615
1.19
1.77 .599
1.15
1.69
..611
.
1.16
Barley, bu. SorghU'll Grain, eri. Cotton, lb.
$ $' .
;1 . 12.1
1.05 2 .. 3 5 32.0 .
.1.20 1.05
2.10
2.10
.}36."O: : 34.5
.619 12.4
.9C17 1.76 29.09
.901 .882 1.85 1.85 31.82 31.48
Cottonseed, ton
$1 23.65
Soybeans, bu. Peanut.s, 1b.
'$
;1 5.2
Sweetpotatoes, eri .' $1 .84
'2.40
2.15
2.15
22.55
4.8 1.60
2..13 11.0 5.S4
- .I"
2.13 i 2.09
11.7 11.7 '.
4.09 4.49
Lespedeza. Seed,!U1,Qwt$. _,'
Hay, baled, per ton
lUI
$
Alfalfa
$
Lespedeza
$
Soybean & Cowpea::' ,$
Peanut
$
Wool, 1b,'. .
..' 14.90
Z7 .70 36.20 28.60
32.00 .21.80
26.30
34.00
'~.OO
'29.50 23.00
. 41~0
41~0
26.60 34.00 27.50 29.00 23.00
45.0
18.3
17.10 17.00 20.90 29.50 21.40
38.6
10.80
18.40 19.10 20.50 26.50 20.20
42.7
17.90 18.40 20.30 26.60 19.80
42,.9 .
Milk Cows, head
Hogs, em.
Beef Qattle, ~.
$1 33.85 $! 7.36 $1 3.96
155.00 21.40 18.60
17S.OO 15.50 21.10
175.00 15.50 20.90
7.'l7 5.42
210.00 21.60 22.40
236.00 . '237.00 15.50 15.00 24.30 23.60
Calves, eri.
$
23.00 26.50 ?6.69
t? .75
24.70
29.10 28 .50
Milk,Wholesale ,eri
Fluid Mkt. Manuf.
All
$
5.75 I 5.90
I Y $$
.. 2-.4' 3
.. , 3.16 1/5.65
I)J 53..'82~0,'1
5-~75
Turkey's, '1b
~
28.0 . 24.0
25.0
1.60 14.4
4.12 '2.99 Y.3.66
25.S
4.20
3~03'
_
lJ3 .751V3 .69
2204 22.5
Chiokens, per lb
Farm . COfrft 1 "Brall .. All
Eggs', All,' Doz.
;
;'1
13 3
21~4
17.5 20.1 20.0
52.4
13.0 15.2 15.1
36.1
!I Revised.
.1_.
._-"-
Y Preliminary Estimate
13.5 15.0 .. 15.0
.., '''"37-'2''
_
I ...
,111.4
,/21.5 / ..
I 16.0
11.4 1'10.1
! 21.1
16.0 15.8
20.4- . . 15.5. 15.1
! 35.2 \ 25.'1 24.9
I
I
.~l;U~$ PAID BY FARMERS FOR SELECTED lEEDS .nNE 15,. 1959, :wITH COMPARISONS.
-=-.
KIND OF JEED
I I I I . .,.-~ORG.JA_-l-_.__ -'" --'11'-[- _._'-- 'f-lliI1&lL1.~l~L-- I
June 15
May 15 June 15
June IS ' May 15'
June 15
..... , ,1958
1959
1959
1958'
1959 .
1959
Mixed Dairy Feed
Dollars Per,100 Poun4s.
All thder 29% Protein
16% Protein .. 18% Protein
2~ Protein 24% Protein
H~h Protein Feeds Cotonseed Meal '(41%)
Soybean Meal (44% )
Meat Scrap
3.90 3.80 4.20 .4.00 . "4.35
4.05 3.95
3.85 I 3.75 4.10 4.10 4.35
4.00 3.95
3.90 3 .80 4.00 4.05 4.25
1.1 . 3.67 ~' . 3.62
3.61 3.91 4.03
II 4.05
3.95
4.05
4.20
3.78 3.72 3.68 3.99 4.C17
4.23 4.23
'3.70 3.65 3.61 3.89
3.97 , .1
I
4.18 4.15
Grain By_Products Bran Middlings
Corn Meal
Poultry Feed Broiler GroWing Mash Laying Mash Scratch Grains
~i?JJaa1ed)
All Other
,3'.25 3045 3.50
5.10 4.80 4.35
II 45.00 40.00
3 ... 3 5 3.60 3.40
4.90 4.75 4.20
,44 ..00
I 33.00
3.30 3.60 3.35
2.76 2.88 3.36
I..
4.90'
5.01
4.75
4047
4.20
3.99
44.00 ; 31.00
I1 28.70 II 27.90
3.05 3.12 3.24
I 4.69 4.51 3.94
I 29.00
, 26.80
2.85 2.96 3.24
I 4.87 4.45 3.93
I ! 28 .10
:+ c:_26.!0
-============================================-_. -
'--, ""t':"~.,
.I \,
~
1 " ...
I '. I'
,Jo!(
J~ ~(' ~ t.
')
.
,. ,.,'
f,~.\,',c'=-il''f'"c ~'~,l,
'
,~:r.;. ,,.'.,.
...,.,;~:... "
,
'II, .< t \:I,"" )
"'-'
, If,".~, J~''~to
'.)\'\\\'\ , : ,,{
",I' :,.....,_,
'- .-::- '. \' ,
"
+, ~
t \ .. \
I ~ ',qJ'~ \.,.'i~),'~ ~Il~
;; ~~ \ ~(
\.
"'
/,,/,
4 ...........
3/5-
G E 0 R G I A C R 0 PRE peR T Imt~__s E R V I C
1< \/\/ ~r ~r J ~ \Jj
-r r I .1 1\
JJ r -1\
'--J
I
J ~r='
J''~\
\j
J
Release 7/8/59
GEORGIA CHICK HATCP.:ERY REPORT
Athens, Ga., July 8 - - A total of 6, 776, 000 broiler chicks were placed with producers in Georgia during the week ending July 4, according to the Georgia Crop Reporting Service. This compares with the 6.922. 000 placed the previous week and is 1 percent more than the 6. 724. 000 placed the same week last year.
Eggs set by Georgia hatcheries amounted to 9, 073, 000 compared with 9,210,000 the previous week and is 4 percent more than the 8.741. 000 for the corresponding week last year.
The majority of the prices paid for Georgia produced hatching eggs were reported within a range of 49 to 65 cents with an average of 55 cents for all hatch-
ing eggs and 52 cents for eggs purchased at the farm from flocks with hatchery owned cockerels. Last week the range was from 48 to 65 cents with an average of 54 cents for all hatching eggs and 51 cents for eggs purchased at the farm from flocks with hatchery owned cockerels. Most prices charged for chicks were reported within a range of $8.00 t<;> $10. 00 with an average of $9.00 per hundred compared with a range of $8.00 to $10. 00 with an average of $9. 00 per hundred last week. The average prices last year were 78 cents for eggs and $13.25 for chicks.
Weighted average price from the Federal-State Market News Service for broilers during the week ending July 4 was Georgia broilers 2 3/4 - 3 3/4 'pounds at farms 16. 04f.
GEORGIA EGGS SET. HATCHINGS. AND CHICK PLACEMENTS
-
BROILER TYPE
EGG TYPE
Week Ending
Eggs Set !! .
1958
1959
1959 %
of 1958
Chicks Placed for Broilers in Georgia
Eggs Chicks Set Hat.dD.ed
1958
1959
1959 0/0 1959 1959
of 1958
Thou. Thou. Percent Thou. Thou. Percent Thou. Thou.
May 2 May 9 May 16 May23 May30 June 6 June13 June20 June27 July 4
9,428 9.632
102 6,857 7,244
106
9~204 9, 570
104 6,934 6,996
101
9, 589 9,251
96 7.237 7. 165
99
9,766 9.236
95 7, 113 7,053
99
9.668 9.236
96 7, 151 6,951
97
9,616 9.276
96 7. 111 7,002
98
9, 360 9, 312
99 V.063 6,961
99
9.08~ 9,210
101 7, 153 6, 807
95
8,658 9,2.10
106 6,878 6,92?
10 1
8,741 9,073
104 6,724 6,776
101
574 513
395 423
373 494
280 435
239 184
245 169
165 179
218 166
49 190
113
97
l/ Includes eggs set by hatcheries producing chicks for hatchery supply flocks.
ARCHIE LANGLEY Agricultural Statistician In Charge
W. A. WAGNER Agricultural Statistician
u-.-
---
S.
-------------------------
Department of Agriculture
-
---
-
-
--
-
-
--
-
------------
Agricultural
----------
Extension
-------
Service
Agricultural Marketing Service
State Department ofAgricuiture
319 Extension Building. Athens. Georgia
-.----------------------------------------------------------------------
EGGS SET AND CHICKS PLACED IN COMMERCIAL AREAS. BY WEEKS - 1959 Week Ending
p
l
STATE
June ZO
June
l7
July 4
May . 30
June 6
June 13
June
lO
June
l7
July 4
EGGS SET - THOUSANDS
CHICKS PLACED - THOUSANDS
Maine
I, 513
1,488
l,4l4
l,l67 1, l75 1, 310 I, ll8 1,l63 1, 186
Connecticut
1,069
1,186
I, 144
633*
48l*
590
_ 6~5
568
610
Pennsylvania
I, l56
1, ll5
1, l56
786
844
913
677
735
814
Indiana
1,800
1,980
1,895
759
87l
810
831 . 86l
778
Illinois Missouri
l03
1,837
III
l,8l3
184 1, 911
135 . ll3
190
110
136
99
670
733
74l ,839
799
818
Delaware
1, 864
1, 77l
I, 671
I, 753 1,699 1,755 1,74l 1,694 l,7ll
Maryland
3,038
3,001
3,009
I, 83 l I, 83 l 1,905 1,869 1,963 l, 001
Virginia
l,047 l,l30 l,l43
1,2l3 1,243 1, 168 1,32l 1, 1l4 1,066
West Virginia
319
354
325
713
575
658
533
529
521
North Carolina
3,77l
3,699
3,608
2,998 3,016 3,037 3,019 2,926- 2,981
South Carolina
537
516
532
365
351
338
339
357
327
GEORGIA
9,210
9,210
9,073
6,951 7,002 6,961 '6, 807 6,922 6,776
~~lorida
Alabama Mis sis sippi Arkansas Louisian... Texas Washington Oregon California
363 4,006 3,067 4, 155
667 3, 153
337 408 1,440
366 4,030 3,032 4,131
656 3,039
427 324 1, 331
374 4,189 2,900 4, 131
691 3, 108
351 352 1,475
188 3,404 2,465
3, 501 423
l,200
371
l27
987
178 3,413 2,485 3,551
400
2,31l
377 ,268
1, 033
213
3,461*
l, 533
3, 566 448
l,306
374 276 978
231 3,470 2,439 3,' 398
468
l"l99
384 247 1, 103
206 3,461
2,l56
3, 231 487
2,367
341
l62
1, 108
l25
3,406
l,464
3, 580
449
2,l50
332 243 1,015
TOTAL 1959 TOTAL 1958
1959 % of 1958
*Revised.
46,061 49,697
93
46,052 48,628
95
45,846
47,71l
96
33,861* 34,064* 34,452* 33,990 33, 597 33,673
36,532 36, 562 36,900 36,889 36,237 35,436 -
,
93
93
93
9l
93
95
3JS-
CGlE(Q)~CGllA celR([IP
llNG >}ElR{VllCJE
AGRICl'LTURAL EXTENSION SERV1';E UNiVERSITY OF GEORGIA AND THE STATE DEPART.MENT OF" AGRICULTURE ..
Athens, Georgia
JUL 10'59
LIBRARIES
11. S. DEPARTMENT OF AGRICULTURE
AGRICULTURAL MARKETltlG SERVICE 319 EXTENSION BLDG., ATHENS, GA.
July 8, 1959
Georgia Cotton Ap!~~ge Up 88 Percent
The 1959 acreage of cotton planted in Georgia is estimated at 730,000
acres,according to the Georgia Crop Reporting Service. This is an increase of
88 percent from 388,000 planted in 1958 and fs the largest acreage since 1956. The largest acreage planted in Georgia was in 1916 when a total of 5,219,000 acres was planted., In 1911, production set a record at 2,769,000 bales.
The first 1959 production estimates will be made on August 10.
Planted acreage for the United Sta~es is estimated at 15,890,000 for 1959, compared with 12,379,000 in 1958 and the ten year (1948-57) average of 22,444,000 acres.
CARL O. DOESCHER Agricultural Statistician
ARCHIE LANGLEY Agricultural Statistician In Charge
STATE
North Carolina South Carolina Georgia Tennessee Alabama JlIississippi
. :
1949-58
average
Y: percent not :
harvested
, ,-
1946-57 :
average;
Planted acres
;
1958
1959
Percent
1,000
acres
1,000
~~
1,000
acres
3.3
6J~1
271
420
1.6
952
357
625
2.2
1,168
388
730
4.2
746
416
530
1.9
1,370
540
850
4.2
2,202 1,185 1,525
: 1959 as
: percent
: of 1958
Percent
155 175 188 127 157 129
Missouri
Arkansas Louisiana Oklahoma Texas
7.4
508
307
415
135
5.6
1,935 1,075 1,330 124
4.2
796
379
550
145
8.6
1,075
430
660
153
9.0
9,318 5,675 6,700
118
Ne\V' Nexico Arizona California
other States '!:./
5.1
247
184
205
111
2.3
445
386
390
101
1.9
959
750
900
120
6.0
82
36
60
167
United States
6.2
22',444 12,379 15,890
128
Other States Virginia Florida Illinois Kentucky Nevada
6.6
22.8
10.7
17.0
159
4.5
43.7
15.0
30.0
200
13.6
3.5
1.8
2.0
111
6.4
10.8
5.5
8.0
145
10.3
1.6
3.2
3.5
109
y Total Amer. Egypt. 2/
3.4
59.1
79..6- 69.2
87
]/From all causes, including removed for compliance.
Sums for lIother States"
rounded for inclusion in United States totals. 1/ Included in State and United
States totals.
GEORGIA MAP SHOONG CROP REPORTTIIG DISTRICTS
Cotton Acreage Planted by 'Districts '..'
-
i:
:
: 1959 in "
District : 1958 : 1959 : Percent
: (000 Acres)
of 1958
1
22
52
236
2
14 45 321
3
17
46
271
4
31
73
235
5
6.4 137
214
6
76 124
163
) Non-Cott
7
59
89
151
8
89 135 152
-=; l31.r:: I
9
16
... ---- - -
I1_/,R-J_2;A~IIt1a~,2N~
~s 1\
/
.
\
-')..,;0 V
State
r'::
388
29
------..----
730
181
188
~JI! C,-)J Macon
1 Columbus \_
\
o '\'( (
j
L_')''---L.----V
)
7 \.Albany} I l~
B
VaJ.dosta
9 if
...
~
CGlE(()~CGllA c~J)r ~1rllN(G 1E~VllCIE:
AGRICUl.TURAl. EXT~NSION SERVICE UNIVERSITY OF GEORGIA AND 'tHE ,STATE DEPARTMEI'IT OF A5RICUl."rURE
Athens, Georgia
,IUL 1 b '59
LIBRARIES
U.!i. DEPARTMENT OF AGRICUl.TURE AGP.ICULTURAL MARKETING SERVICE 319 EXTENSIO"~ BLDG., ATHENS, GA.
July 13, 1959
GENERAL CROP REPORT AS OF JULY I, 1959
Heavy rains the latter part of May and first few days of June caused considerable' damage to Georgia crops. By the last of June many areas in the southern half of the state were dry to very dry. The lack o.f moisture together with high temperatures caused ad.ditional damage to most growing crops. Corn in pa'rticular has been damaged severely by the adverse weather. The outlook for corn and cotton vias very spotty on July 1.
LEAF PRODUCTION UP: Current indications point to a Georgia flue-cured . , . tobacco crop of 104, 725, 000 pounds, 17 percent above
last year, th'e Georgia Crop Reporting Service said today. This will be the largest cr'op' since 1956 when 128,040,000 pounds were produced, but it will stil~ be 11 percent below the la-year average production of 118,066,000 pounds. The yield per acre this season is forecast at 1,475 pounds compared with last .
year's record high yield of I, 545 pounds per acre.
CORN DOWN 22 PERCENT: The 1959 corn crop is currently forecast at .
..
67, 344, 000 bushels, a decline of 22 percent from
last year's record c:rop of 86,752,000 bushels. Corn was damagedby excessive
rains in May .and -later by hot, dry weather the last week to ten days of June.
The crop is very uneven. Current indications point to a yield of 23.'0 bushels
per acre compared with'the 1'958 record high yield of 32.0 bushels per acre.
Despite the' sharp decline from last year, both yield per acre and total produc-
tion are' expected to be above average.
WHEAT PRODUCTION ABOVE LAST YEAR: Wheat production in Georgia this year is now estimated at
2,100,000 bushels compared with 1,633,000 bushels produced last year. An increase in acreage harvested from 71, 000 a year ago to laO, 000 this year more than offset a decline in yield per acre from 23. 0 in 1958 to the current estimate of 21.0 bushels.
GOOD PEACH CROP: Georgia's 1959 total peach crop (including farm and commercial production) is estimated at 3,400, 000 bushels.
Total production last year amounted to 4,000,000 bushels. 0uality of this year's crop has generally been above a year ago when a period of heavy rains during harvest caused some soft peaches; On the whole, prices have also been some-
w. h'a.t be. tt.er than las.t. year .
GBORGIA C~OPS
CROP
. Corn, All
Wheat.
Oats . .
Rye ,Barley ,!:obacco, All Potatoes, Irish Potaote S, Sweet Hay, All Peanuts, Alone Soybeans, Alone Peaches, total crop Pear s, total crop Cotton, Planted
Acreage (000)
!-
1959
1958 1959 0/0 of
1958 .
Yield
Indic. 1958 July 1
1959
Production (000)
1958
Indic. July 1 1959
Bu. Bu . Bu. Bu. Bu. Lb. Cwt. Cwt. Tons
Bu. Bu.
2, 711 71
276 13 10
59. 1 4.8 11 630 592 115
388
2,9~8
100 259
16 13 72. 1 4.1 10 632 580 109
730.
. 108 32.0
. 141 23.0
94 33.0
123 12.5
130 29.0
122 1,540
85
46
91
48
101 1. 02
98
95
I
188
23.0 21. 0 ' 32.0 12.5 29.0 1,473
47 45 1. 00
86,752' f:>7,344
'1,633 2, 100
9, 108 '8,288
162
200
290
377
91,018 106,210
222
191
528
450
641
630
I 4,000 3,400
98
95
ARCHIE LANGLE Y Agricultural Statistician In Charge
CARL O. DOESCHER Agricultural Statistician
',~
UNITED STATES -- GENERAL CROP REPORT AS OF JULY I, 1959
Total crop production second only to last year's phenomenal record now
se;ms likely for 1959. Planted,acreage .of 340 millic:>n is above 1957 and:1958
b\1.t. well below ot~er recent yeq.rs. It now appears that the harvested acrea.g'e for
al~ ,~;-ops. will total 325 .million, slightly above the low levels.. ofJhe. pa.st.3 y~ars,
b~~Amaller than other years since 1939. Crop development up to July has been
mainly. favorable but. top soil moisture deficiencies in the Northern Plains, :Mid-
d1e'Atlaptic, .Southeast, and parts of the Ohio River Valley tak~ on ~~dec;l.. signifi-
cance as the period of hottest weather and highest plant moisture requirements approac~es. The composite yield per acre based on all c~ops will ,probably be
exceeded only by last year I s extremely favorable showing.
,_
,
' r.. , I .,:.'!
Winter wheat showed a slight further decline as hot weather, short,topson,
mQisture, !~nd d~mage from streak ~osaic all took some ,toll. Prod~ctioh.0. , ..
wint~r, wheat ..i.~. the fifth. largest of record, but fJpring wheat production ~s the.' .; fou.;rtl) smallest~in ~he last 20.yea;-s. A sizeable red~ction in sorghum and soy- ..-:
bean acreage practically assures a smaller outp~t this year. ,The corn crop ..
looks record high by a considerable margin with a 15 percent increase in acreage
and generally favorable development to date in the Corn Belt. Oats pr'odu~tion '
now looks to be the lowest for 20 years on the smallest acreage harvested in th'is'
centur,y.. Barley yi.eld prospects are average on a slightly increased acreag.e ..
Hay tonna.ge i~ expected to be a tenth below last year I s record production. Pas~'
tur,e ~nd forage g;r.owth w~s retarded by dryness in the middle and lower Atlantic
Co~~~~l area~, Northern. Plains and Southwest but are generally seasonalor.
better in other sections.
A ;,ecord corn crop of 4. 2 billion bushels is in prospect based on July 1
con4itions. This prodL:.ction of all co.rn would be well above the record 3. 8 billion bu,sh~ls last y~,ar ,and far above the 3.3 billion average. A 14 percent incre.q.se . in planted~creage following the removal of acreage allotments in commerCial
areas accounts for this larger production than last year. The yield per har.vestee
acre, indicated at 50. 1 bushels, is below the record, 51. 7 last year but far above'; the,,4Q,,6:bushel average. COrn was planted by. about the usual date but many;., '. ";
sections 'have a sizeable proportion of both early and late corn because' wet,
weather interrupted planting during the last half of May.
.
I ;. '
, .
.,
~ '.. I..
"
: ,:'4:, :
Thi'S ,year t s peach c;ro.p, i,~. forecast at 75.8 million bushelS,' 4 pe'rcent less
than pn Jun.e I but 7 percell~! more than last ye,ar .. Tb.e July I for:ecast excludes
Pl',oq.uc.tio~ eliminated through the "green drop" program put.into effect.under ,
T~e. Peach Marke~ing Order.for ,California Clingston,e peaches. T.h.is . removal
program is responsible for the reduction from the June 1 forecast. Peachpro-.,
duction, excluding the California Clingstone crop which is mostly for canning,
is now placed at 48.8 milliqn bushels, 2 percent below last year's production blit
. 24 percent,above the, 1948-57 average. .
. ,,)
,
I'
..
, ..
,.
. : ..
.. i
'INnED' STATES "
..
:
,',' ',' , '
.:
CROP
.
- . " ,
Aoroago for' Theus.
. Harvo' "For Harv
,1958'
1059.
1959 ns porcent ot 1958
..
. ..
Corn, JUI ..
Vlhtii1.:t, Oats,
All
....
BlJ,.
WBu..
Cottbn, lj
.JI . Hay, 1>11
Ton
Soyb.eans.,
Peanuts, 2
.. '
Pota.toos, Irish
SrTeet Pota.toes Owl;.
Toba~oa, lUI
.Lb.
..
Y !I Pla.nted a.ore'age.
'.
,.
73,470 " 84,387
114.9
53,'517' 53,217
99.3 .
31,826 " 20 .. 823 ..... 90~G'
li,;379 ,15,,89,0
128 .0
73,G33 ;. 70,991' \ , 97 :2:
2'~;900
,1,734
22,917, . ; 92.0 1,68J. . 96.9 . ,
,1,<;67
1,3~7
95 .. 2
256'
274 . 102~9
l,C78 . ,
. 1 ,157~ ,
1
0
7
'
.
3.
t
all Grovm elo1'1~ for
purpo se s
I
"
:~
' ,
-,,.
, .I
,
,~
Yield.
1958
, lnd.July 1, 1959
Production in Xhou:
1958
rnd. Jul:
1, 1959
51.7
50.1
27 .3
21.7
44.7
-1.~7 -...
j
J
-35.0
..-1.54
... '
: 6;.5'
64"3
,1,511 1 f5L',2
3,799,844 4,224,450
1,452,2).8 , 1,155,132
1,422,164
-
121,924
I - ... -- ... 17,434 .1,736,204
- 1,009,525 --109,594
.'
T",
:
I, Ii ,5!1S.
1,783,199
..
"1,
I;
, _.J
. I,i
'.1' ..
;\
'.\:'
. . .\ ,'-
.'
;":' " ..
,; "
,. 1_,
..... .
.
I .~. :
-'1," .','.
,
.. '.) 3" ;: . 'i .~ I
.1
"
3/~
GJE(Q)~((;llA ce~(Q)IP'
J3 ."
~1fllNCG IE~Vll<CE
AGRICUl.TURAl. EXTENSION SERVICl:: UNIVERSITY OF GEORGIA AND THE
.,. pS,T.tAhTeEnsD,EPGAeRoTMrgEiIa'IT ClF AGRICUL.TURE
JUL 15 '59
U. S. DEPARTMENT OF AGRICULTURE;; .
AGRICULTURAL MARKETING SERViCE' .
SH)
EXTENSION
BLOJGu.1yAT1H3EN, Si
GA. 959
'1M
~~-:.:.L
~:~".'.
LIBRARIES
vEGETABIE CR~P RE1?OlU - "t1tY 1, 1959
GEORGIA: Extremely high temperatures and dry weather during late June did con..;. ,].' siderable damage to vegetable crops in southern and central areas,
the Georgia Crop Reporting Service said today. Harvesting has passed the peak as of July 1 on practically all vegetable crops in these areas except cantaloups and watermelons. Light volume is expected through July 15 for these crops. Harvest.ing of summer vegetables in the mountain areas is get~ing underway~ , .
UNITED. STATES:. Production of summer vegetables, excluding melons, in 1959 .is ex-
. pected to be 3 percent more than last year and 13 percent above
average, the Crop Reporting Board announced today. Forecasts prepared July 1 'normally account for' nearly two-thirds of the total summer production. Principal contributors to the increase over 1958 are lettuce, sweet corn, and onions. Partially offsetting are sUbstantially smaller crops of cabbage and cauliflower. In addition to those, crops for wh~ch production forecasts hav~ been made, acreage est~mates have been prepared for late ~ummer onions, green peppers andtomatoes. Total acreage of these crops is 5 percent above that harvested in. 1958 ..
"'-.
Summer melon production--cantaloups, honeydews and wate~elons--is .11 percent below last year mainly because of a 15 percent': smt.ller watermelon crop. No 'production forecast has been made for late summer cantaloups but acreage for harvest is up 2 percent.
LIMA BEANS: The first forecast for the summer crop reflects the continued down-
ward trend in production for fresh market. The indicated product1'on"
of 203,000 cwt. is l7'percent below last summer's crop and 35 percent below
average. Yields in the earliest southern States have been adversely affected by
the hot dry weather. The New Jersey and Long Island crops are growing well
at this time. Harvesting is over in south Georgia and beginning in the West
Central area. Light harvesting is underway in North Carolina. The New Jeroey
crop is expected to begin around July 20 with the Long Island crop also ~:t.arting
during the latter part of the month.
.
.
SNAP BEANS: Production of snap beans in the summer group of States is forecast at 1,481,000 cwt., which is about 2 percent more than last yeo.r!s
but 1 percent less than average. The acreage for this group is down slightly from last year but this is offset by somewhat better yield prospects. In the New England group of States prospects are generally fnvorable. L1ght harvest has s~arted and will be most active after mid-July. The early Long Island crop was damaged by rainy weather. Peak harvest is expected during mid-July. In Upstate New York planting is expected to be completed by July 15. Some fields are suffering from dryness. Light picking has started and will be heaviest in late July and August. Early plantings in Pennsylvania are being harvested. Hot weather is reducing yields. Condition of the Ohio crop is very good with yields above 'llverage. Ho.rvest in Illinois is more advanced than at this time last year and drYness is affecting yields. In Michigan the crop is mostly in good condition. Earliest areas began harvesting around July 1 and volume production is expected by July 20-25. In the southern mountain area, which includes southwest Virginia, western North Carolina, eastern Tennessee, north Georgia and northeast ~lo.bama, prospects are variable with expected production slightly below last year. Planting will continue during most of July. Ha:rvesting is now in progress -andwill
continue,' 'during July and August. Hot,' ary' weather in late June o.dverscJ..Y;.~:ff~.c.ted
early cJ.ops but recent showers and cooler weather has resulted in some il'llprbvement..
WATERMELONS: Production in the early summer states is foreca.st a.t 18,800;000' cwt.)
..
which is 16 percent below last yeo.r bUt a.bout equal to OYeZ-age.
Hai-vesting in Georgia will continue active until around July 15. Recent 'extremely
hot weatper ca.used vines to die faster than usual and melons to blister. In
South Ca.rolina the crop was damaged by dry weather during June and prospects are
slightly below a month earlier. Early fields show more d.o.ma.ge than lo.ter.plant-
i~~s. Peak ,harvest in the BI.rnwell-Ho.mpton area will be during the first half of
J~y anQ the Pageland area will be heaviest during the second half of the month.
In North carolina, high temperatures and dry soils greatly reduced. yields. :Crops
in Alabama, Mississippi, and Louisiana ~ere adversely affected by heavy rains in
ea.rly June and by high t'ElIllPerD,tures 'dUring .the second half of the month. Har-
vesting is in progress in t~~ ~o~the.rI,l.l'~:t~.ons of these statesj. central areas
Will be in" active harvest by.mid.-.July, with the northern area coming .in during the
second half of the month. Grow:CIig condftions in Texas have been favorable in
Llost areas. Crops in south Texas are fini shing up. Harvesting. i~. active in the
south central area13. Eo..st Texas is in light production with volume movement ex-
pected around July 10-15.
"
Acreage and Estimated Production Reported to Date, 1959 with Comparisons
CROP
AND
STATE
LIMh BEANS
-J__ .~_~ J\~E FO~ ~VEST
YlELD PER ~~~_~ __~~UcrIONt' '
I Average 1
I 100, I Av.
lInd. Average
R I~~~
I 19;~ 1p49-57 1956 ! 1959 ,49-59. 19561 1959 1949-57;
, - Ilcres -
i - Cwt. -
i - 1,000 cwt. -
Summer:
New York . J. 1,540
New Jersey ..: 1,960
Ohio . . . ..1 ' 580
Maryland
.
I
.!
North Carolina !
Georgia. . . .
Group Tota.l
SNAP BEANS
I
: Summer: ~ New Hampshire
!I !
;
280
MaSsa.chusetts ..", 1,330
Rhode Island
260
Connecticut. .j 1,090
New York, L. I ..! 2,880
..! New York', Upsto.tei 10,740
, Pennsyl:vo.nio.
:2,980
Ohio . . .1 3,370
Illinois .....j 1,270 Michisan .. "1 2,530
Virginia . . ." 660
'j North Carolina.-. 7,400
Geergio. .
2,~20
Tennessee.. " 1,620
lUo.bo.tlO. . . .j 1,290
Colorado . . . .1 810 Group Total .1 40,530
CABBAGE 1
f,ate Summer: "Pennsylvo.nia . Indio.no. . . . , Illinois . . . Iowa. . . . . . . North Carolina. . Georgia ColortJ.do . . New Mexico. Washington California .
Group Total
CANTALOUPS
4,180 2,130 2,700
970 4,190
730 3,270
330 1,530 2.370 22. ~90
600 1,300
280 1,400
220 950 1,100 11,000 2,300 3,900 1,300 2,700' ,750 6,800 1,300 1,400 1,200 700 37,300
3,600 1,700 2,900
800 3,700
600 2,700
5501' 43 1,400, 32
--- 36
40 45 35 33
24 25 46 46
I I !
,
I
280 j 35
40 40
10
11
11
1,500i 35
40 40
47
56
60
220 I 36
40 40
9
9
9
1,000! 35
40 40
37 38, 40
iI 1,300i 42
11,000 42 2,200 43
40 45 42 451 45 45!
117 44 58 451 462 495 128' 104 99
3,800 40
35 401' 133 136 152
1,200 28
33 33
35
4 3 . 40
2,800,1 31 750 I 30
I 31 33,1
35 30
77 20
84 26
92 22
6,500 i 34
40 40'1 251 272 260
1,100' 28
28 30
56 36 33
1,300 36
45
37 1'
58
63 48
1,200 22
I 700 I 45
36.850 37
25 25 50 451
28 36
d 30 30
35
2
19 40 1.494 1.449 1. 1
I
185 180 215 180 1 205 190
160 170
160 150 100 100
220 230
666 516 366 210
595 551 128 128 592 540 60 50 594 506
Early Summer:
i South Co.rolino. . 5,910 7,400
Georgia . .. . 8,530 9,000
Arizono.,other .. 7 680 1:0 500 Group Total. '0 22,120 2 .900
_.
-/ --
- --- - --- - ---
WATERMELONS
.
I, Early Summer:
I North Co.rolino. -.! b:-, ;L60: 15,000 - 13,500 50
South Carolino. .II 41~890 42,000
Georgia . .. ., 54,000 63,000
I 35,000, 54
49,000 78
Ala.ba.ma . . . . 17,460 21,000 19,000 i 91
Mississippi. . 11,040 ,16,000 12,000 I 70
60 - --55 555 900
60 55 ',' ,2,264 2,520
85 70, 4,190 5,355
95 90 1,577 1,995
65 55
773 1,040
Arkansas" . 10,320 13,000 11,500 85
85 85
874 1,105
Lou!siano. .. . 4,430 4,200
4,200 77
80 75
342 336
I Oklohomo. . 14, 520 11, 500
9, 200 I 64 ' 65
Texas. . . . lO9,220 119,000 107,000 47 - 50
70
946 748
50 5,096 5,950
Ari zona. . . . . . 5, 170 7,400 6, 500 I 146 ... 95 160 757 703
California. . 10 480 11 000 ),;1..800 140 160 170 1 464 ~ ,
"
Group Total
9, 0 323, 100 27, 700: 5
9
7 - - - - -- - --
11 Includes processing.
ARCHIE IJUtjIEY
~gricu1tura1 Statistician In Charge
,
L. H. HARRIS, JR. Vegeto.blc Crop Estimo.tor
Go-
GIE(Q)~CGllA C~(Q)IP ~!r 'YIffi$:Jll~(G JE~VllCC[ NlhllSlTY OF GEORGIA
AGRICULTURAL EXTENSION SERVICE UNIVERSITY OF GEORGIA AND Tt,lE STATE DEPARTMEtJT OF A::iRICULl'URE
..IUL 1 '59
. S. DEPARTMENT OF AGRICULTURE P.ICULTURAL MARKETING SERVICE
19 EXTENSION BLDG., ATHENS, GA.
I'
Athens. Georgia
LIBRARIES
July:13. 1959
GENERAL CROP REPORT AS OF JULY 1. 1959
Heavy rains the latter part of May and first few days of June caused considerable damage to Georgia crops. By the last of June many areas in the southern half of the state were dry to very dry. The lack of moisture together with high temperatures caused ad..:litional damage to most growing crops. Corn in particular has been damaged severely by the adverse weather. The outlook for corn and cotton was very spotty on July 1.
LEAF PRODUCTION UP: Current indfcations point to a Georgia flue-cured tobacco crop of 104, 725, 000 pounds, 17 percent above
last year. the Georgia Crop Reporting Service said today. This will be the largest crop since 1956 when 128,040.000 pounds were produced, but it will still be 11 percent below the 10-year average production of 118, 066, 000 pounds. The yield per acre this season is forecast at 1, 475 pounds compared with last ' year's record high yield of 1.545 pounds per acre.
CORN DOWN 22 PERCENT: The 1959 corn crop is currently forecast at' , 67, 344, 000 bushels, a decline of 22 percent from
last year's record crop of 86,752, 000 bushels. Corn was damaged by excessive
rains in May ,and lat-er by hot. dry weather the last week to ten days of June. The crop is very uneven. Current indications point to a yield of 23. a bushels
per acre compared with the 1958 record high yield of 32. a bushels per acre.
Despite the' sharp decline from last year, both yield per acre and total production are expected to be above average.
WHEAT PRODUCTION ABOVE LAST YEAR: Wheat production in Georgia, this 'year is now estimated at '
2.100,000 bushels compared with 1.633.000 bushels produced last year. An increase in acreage harvested from 71, 000 a year ago to 100, 000 this year more than offset a decline in yield per acr'e' from 23. 0 in 1958 to the current e'stimate of 21. 0 bushels.
GOOD PEACH CROP: Georgia's 1959 total peach crop (including farm and commercial production) is estimated at 3,400.000 bushels.
Total production last year amounted to 4, 000, 000 bushels. 0uality of this year IS crop has generally been abov,e,a year ago when a period of heavy rains during harvest caused some soft peaches. On the whole, prices have also been somewhat b~tter than last year.
"
"
CROP
GEORGIA CROPS
..... Acreage (000)
Yielc,l
Production (000)
1959
Indic.
Indic.
1958 1959 0/0 of ' 1958 July 1 19-58
July 1
1958 '
1959
1959
Corn, All Wheat. Oq.ts Rye ,Barley Tobacco, All Potatoes, Irish Potaote 5, Sweet Hay, All Peanuts. Alone Soybeans, Alone Peaches, total crOp Pears. total crop Cotton. Planted
Bu. Bu. Bu. Bu. Bu, Lb. Cwt. Cwt. Tons
Bu. Bu.
2, 711 71
276 13 10
59. 1 4.8 11 630 592 115
2.928 100
,259
16 13 72. 1 4. 1 10 632 580 109
' 108
, 141 94
123 130 122
85 91 101 98 95
388 730 188
32.0 23.0
23.0 21.0
33.0 ' 32'.0
12.5 12.5
29.0 29.0
1,540 1.473
46
47
48
45
1. 02 1. 00
86. 752 67.344
'1,633 2, 100
9. 108 '8, 288
162
200
290
377
91,018 106,210
222
191
528
450
641
630
4,000 3.400
98
95
ARCHIE LANGLEY Agricultural Statistician In Charge
CARL O. POESCHER Agricultural Statistician
UNITED STATES -- GENERAL CROP REPORT AS OF JULY I, 1959
Total crop production second only to last year's phenomenal record now se~m~ .~iJ<.ely for 1959., Planted acreage of 340 million' is above 1957 and 1958 but, well: b.elow other recent years. It now appears that the harvested acreage for all., ~r9.p.~ will total 32.5 million, slightly above the low levels. o~ the past 3 y~ars, b~( sm~U~e.r-:than: ottter years since 1939. Crop development up to July has been mainly. 'favorable but top soil moisture deficiencies in the Northern Plains, Mid-
dIe: Atlaptic, . Southeast, and parts of the Ohio River Valley take on added signifi-
cance as the period of hottest weather and highest plant moisture requirements approac~es. The composite' yield per acre based on all crops will probably be exceeded only by last year I s extremely favorable showing.
Winter wheat showed a slight further decline as hot weather, short topsoil rnoisture, : ~nd damage from streak mosaic all took some toll. Production ,of wint~r wheat is the ~ifth largest of record, but apring wheat production is, .the . ". fou~t~ Efrnallest in the last 2.0 years. A sizeable reduction in sorghum and soybean acreage practically assures a smaller output this year. .The corn crop' .
looks record high by a considerable margin with a 15 percent increase in acreage and g.enerally favorable development to date in the Corn Belt. Oats produ:cti~n . no""'{,looks to be the lowest for 2.0 years on the smallest acreage harvested in this
century. Barley yield prospects are 'average on a slightly increased acreage.; Hay tonnage is expected to ,Qe a tenth.l;>elow last year's record production. Pasture ~nd fO"1',age :growth was ;retarded by dryness in the middle and lower Atlantic Coastal areas, Northern Plains and Southwest but are generally seasonal: or better in other sections.
A record corn crop of 4. 2. billion bushels is in prospect bas'ed on July 1
conditions. This prod~ction of all ~orn would be well above the record 3. 8 billion
bus.hels last year and far above the 3.3 billion average. A 14 pe'rcent increase
in pla;q.ted acreage following the removal of acr,eage allotments in commercial
areas accounts for this larger production than last year. The yield per harvestec
acre,..indicated at 50. 1 bushels, is below ..the recor-d 51. 1 last year but far abo.ve'
the 40. 6bushe~ average. Go~n was planted by about the usual date but many.
sections have a sizeable pro'portion of both early and late corn because wet
weather interrupted planting during the last half of May.
,
.'.
"
I
Thi's:,year's peach crop is forecast at 75.8 million bushels, 4 percent less
than ~.n Jun.e 1 but 7 percent more than last year. The.July 1 forecast excludes
pr,oduc-tion eliminated through the "green drop" program put into effect under'
Th~ P~ach Mar.keting Order for California Clingstone pea,ches. This removal
program is re sponsible for the reduction from the June 1 forecast. Peach pro-
duction, excluding the California Clingstone crop which is mostly for canning,
is now :placed at 48.8 million bushels, 2. percent below last ye'~r's production but
, 24 percent above the 1948-57 average. "
,',
CROP
1.oroago ~~ Theus.
I .. H' . arv.
1958
.
'tt___
For na.v.
1059
tBmD STATES
1959 ~s ~ ..yield..
ofp e r c e n t
1958
I
1958'" d. uly 1, 1959
Produotion in ~hou:
,;
1958
Ind. Jul:
I, 1959
Co~, All
Bu.
73,(.70 ' 84,387
114.9
Vlhea.t, All
BU.
53,S77
53,,217
99.3
oats, "
Bu.'
-al~8'26
28,823
90.6
Cotton,!!
U,'379
15,890
128.0
Ray, '.:11
Ton
73,033 .', ',70,991'
97~2
Soyboans, gj
:.2~;900
22,917 .' .; 92.0
Poanuts','?:z
. .1 , 7 3 4
1,681, 96.9
PotatoQs J Irish
1,:67
1 ~391
95.2
SweetPotatoos CWt.
266
274
102.9
---------_......:.-_-------_!_-- - Tobaco.o, All Lb.. I . 1,C78 . ., 1 ~157
107 ~3
'~-
y all 1/ Planted aoreage.
Gr~"m a.lonc' for
.purpo se s.
I tJ' I
':..
":
':
,'
51.7
50.1
27 1 3 44.7
21.7 35.0
..
_
1.67
1.54
_;_
_ ,.,1 ... _
I ;65:5 1,611
\_ : 64.3
..1 ,~42
3,799,844 1,462,218 1,422,164
-
121,924
4,224,450 1,155,132
- 1,009,625 109,594
.:..
17,434 ., 17,598. 1,736,204 1,783,199
,,,"
1
!. ':
..
..'
:.
. , . . ~"::,,,;,
,
. - .. -_"---_ -l.:.."~ - - -
~
3/5:'
". ; . - :1 1<,. ) ' . ( I-/ . <........~
~ ..
(
~
;~~,\,r~ ~.
,~,.~-~i!.~a ., "":. . "..\,\".
t ~ ~ ~~i ,~)L I :
I\II\,.'~.,,f'.";r,,~.'"\C ~~~(,!~I'I"hI."'JII~~'li"\:l~-,I,
.>.'~"~.,~> _\.;',~-~,I~.'":'''"'~.,\~,.;_~,"\'".
"of' \\\,,
,,/ ..
.r.;:
,1,,\
fL,'':'
\\.
1
,
.
"~',",,t~,--'.-e~\.~~".
.
.-'_.
-1
GEORGIA CROP REPORTING SERVICE
1< Y . ~ ~ I
'IV ,Jr-I~.' JERY t F.J . I
J .J
UII nr"ol"lV
nlA
0'
Reiease 1./15/.59
..j
jUL 1 7 '59 "I
GEORGIA CHICK HATCHERY REFORT
LIBRARIES
.. Athen's, Ga.,. July 15 - - A total of 6. 573.000 broiler chicks were placed'
with producers in Georgia during th~ week ending July 11, according to the
Gebrgia Crop Reporting Service. This. compares with the 6,776,000 placed the
p~evious week and is 4 percent less than the' 6, 869. 000, placed the same week
last year,.
.
Eggs set b-y Georgia hatcheries amounted to 8,741,000 compared with
9;',073, 000 the prev~ous week and is slightly les's than: the 8, 771, 000 for the
co*respondiJlg week last year.
' .:":,,
~,
,) T'he majority of the prices paid for Georgia produced hatching eggs were
reported within a range of 50 to 65 cents with an average of 55 cents for all hatch-
illg eggs and 53 'cents for eggs purchased at the farm from flocks with hatchery
oWned <;ockerels'; Last week the range was from 49 to 65 cents with an average
of 55 cents for all hatching eggs and 52 cents for eggs purchased at the farm
from flocks with hatchery owned cockerels. Most prices charged for chicks were
reported within a range of $8.00 to $10.00 with an average of $9.00 per hundred
compared with a ra,nge of $8.00 to $10.0,0 with an average of $9.00 per hundred
1aS,t week. The average prices last year-were 78 cents for eggs and $13. 00 for
chicks. 0
vieighted average price from the Federa1-~tate Market News Service for
broilers during the week ending July 11 was Georgia broilers Z 3/4 - 3 3/4 pounds at farm,,s 15. 46~ .
GEORGIA EGGS SET. HATCHINCS, AND CHICK PLACEMENTS ..'.
BROILER TYPE
-
EGG TYPE
Week Ending
Eggs Set !J
Chicks Placed for Broilers in Georgia
Eggs Chicks Set Hatched
1958
1959
1959 % 1958
of 1958
1959
1959 0;0 1959 1959 of 1958
Thou. Thou. Percent Thou. Thou. Percent Thou. Thou.
:
May 9 9,204 9, 570
104 6,934 6,996
101
May 16 . 9. 589 9,251
96 7,237 7. 165
99
May 23 9., 7~6 : 9.236
9.5 7. 113 :7,053
99
May 30 9,66S : 9.Z36 , .96 7, 151 .6.951
97
June 6 9,'616 : 9,276
96 7, 111 7,002
98
395 423 373 494
280 .435 Z39 ,l84 245 169'
June 13 9,360 9,312
99 7,063 '6,961
99
June 20 9,:082 9.210
101 7. 153 '6, 807
95
June 27 ".,. '.8, 658 . 9,210
106 6,878 .. 6,922
101
165 179 218 166
49 ..190.
July 4 8.741 9,073
104 '6'.7Z4 ' 6,776
101
113
97
July 11 8,:771 8,741
100 6.869 6. 573
96
36 191
-
11 Includes eggs set by hatcheries producing chicks for hatchery supply flocks.
ARCHIE LANGLE Y Agricultural Statistician In Charge
W. A. WAGNER Agricultural Statistician
u.._._----------------------------------_._-----.-----~- -------------------
S. Department of Agriculture
Agricultural Extension Service
Agricultural Marketing Service
State Department of Agriculture
319 Extension Building, Athens, Georgia
-._._--------------------------------------------------------------------
~GGS SE T AND CHICKS PLACED IN COMMERCIAL AREAS. BY WEEKS - 1959
P2
'.
Week Ending
STATE
June
27
July
4
July
11
~
June
6
June
13
June
20
June
27
July
4
July
11
EGGS SET - THOUSANDS
...
i
CHICKS PLACED - THOUSANDS
Maine
1,488 1,424 1,557
I, 275 1,310 r,228 1, 263 1, 186 1,222
Connecticut
1, 186 I, 144 1,094
482
590
635
568
620
551
Pennsylvania
I,. 225 .1,256
I, 194
844
913
677
735
814
719
Indiana
1,980 1,895 1,941
872
810
831
862
778
854
Illinois
222
184
205
123
100
110
136
99
106
If
Missouri
I, 823
1,911
1,899
733
742
839
799
818
754
.uelaware
1,77Z
1,671
I, 59Z
1,699 1,755 1,74Z 1,694 1,722 1,178
Maryland
3,001 3,009 2,989
1,832 1,905 1,869 1,963 . 'Z,OOI 1,894
Virginia
2,230 'Z,243 2,000
1, Z43 I, 168 1, 322 I, 124 1,066
993
West Virginia
354
3Z5
297
575
658
533
529
521
550
North Carolina
3,699 3,608 3,463
3,016 3,037 3,019 2,9Z6 2,981 2,919
30uth Carolina
5Z6
53Z
500
351
338
339
357
327
351
GEORGIA
9,210 9,073 8,741
7,002 6,961 6,807 6,922 6,776 6, 573
I
I
~-'lorida
Alabama
I
1.0
,j
Mississippi Arkansas Louisiana
,
Texas
)
t
Washington
I
)
:)regon
,:
California
366 4,030
3,032 4, 131
656
3,039 427
324 I, 331 .
374 4, 189
Z,900 4, 131
691 3, 108
351 352 1,475
342 4, 107
2,942 3,849
688
3,071 346 387
1, 311 .
178 3,413 2,485 3, 551
400
2, 312 377 268
1,033
223 3,461
2, 533 3,566
448
2,306 374 276 978
231 3,470
2,439 3,398
468
2,299 384 247
I, 103
206 3,461
2,256 3,231
487
2,367 341 26Z
I, 198
225 3,406
2,464 3, 580
449
Z,250 332 243
1,015
1723,394 2,370 3, 525
386
2, 301 306 238
1,0Zl
)
.).
)
TOTAL 1959
46,052 45,846 44,515
}
~
C
,~'
~
TOTAL 19 S8
1959 % of 19 5- 8.-
48,628 47,71Z'
.-
95
96
47,176 94.
..
34',064 36, 562
93
34,452 36,90.0
93
33,990 36,889
92
33, 597 36,237
93
33,673 32,977
35,436 34,912
95
94
.-
GIE()~GllA C~O
lHING S1E1~Vn<ClE
J'It, AGRICULTURAL EXTENSION SERVICE
j
2.1.11 U,NIV!EpSn:V OF O,IORGIA AND;;T'HE"
'.;, .v...
sTATI DEPARTMENT ()Il' AGRICULTURE
Athens, Georgia
lJ'~" iE:s ' .,
. U. S. DEPARTMENT OF AGRICULTURE "AGR,ICUL.TURA1. MAAKllt:iNG SERVICE:
'.,',' 111 EXTENSIO~ BLDG ATHENS. GA. July 20, 19/59
" :r..' Thi'~' su~rricir'y o~,p~':lit~Y.~~~~.~~a~,;on,o~' hat'c'~~r,y p~o'duetio~.~, po~ltry'" <
slaugl:'ter~ egg p~od4-ctlon,. pertJnent prlce. dat~ CW,d,'~~-qf~~onth:stQ~~ge' stocks
is 'b~ihg 'furnished you in ~,c~~i:l~n'~.ed fo~p-i ~o enable :Yo~ to h,~ve ,a rea'dy current
,r~f~r~n~~..", "';',", ,!' ;),'i:l '
"";",,
'co
"'~''''''''
. . ~,.' ',' ,.,
f " ,
", ": "~~"
I' ""I ( ' ,(
... ~,
POuLTR.f.'SUMMA~:Y, 'i~pe.
,(~9:~9..t'
\.
I.~' :1...
.'I~.\",j....\.":~.:'
I : .. : : ' ',::"'" ,',
<,
:','
" bilk-in' ':TuM' ", :'0 6 ',:'Jiii:' thr~u"''h':rune .;"o/g ,of',':'; ,
',', II.' ',\ tie'm:'"
,. 1958 11: I i9' 59~i ",l~,cst,~ 19'58 1.1 19592/' "', Jaii"",'l
-
-
year
-
-:' ,y~aJ:':; .:
,Thou. , :,Tho,u'. Pet., Tho,u., Thou.' , 'Pet.
Chicks Hatched by Com,mer dal'HatcheriE!'s :,J ... % ...
....
Broil'e. r Type - , ' (If" I
- -................... ........
.' ,:i
. .. ./;:" '
. I.'"
, , _.' . ...., ....
j (' ....:
' ,1
.,
"
Ge~:t:~ia
,... 30,A36 30,038 99 164,:991 178,823 108
Uniteu State s
177', 588 166,250 94 949,760 1,000,881 105
~s~ Type Geor,gia :'United States
\,: tl
Co'r;n~~rcial Slaughtere.!
I
,
" 714 40, 376,
,,722 101
26r ,
590 "
I:
66
.. ~. ~.: . . . '
';. ,'JO'
. . . , :: .,
':. ~, 738 ' .,12,.407 ' 184', ,~,94, 0,60 . 462, 917 ,',' 94
, :'1',
Young Chickens , 'Ceorgfa' - " -'ltnlted States
'26, 63.7 28, 277 106 134" 866 ~41, 716 " 105,:... 13'1, ,60:~ 149, 7QO , 11.1: -699,792 194,628 114
. Hens ,and Cocks
. 'Ce6t:gia
"
,Unit'ed States
,.
I",:
,'. t
:. 'f
Egg', Pr:oduction:
'ci~orgia
;- ,0:
"
,
, South AtlantieY ,
263'
7, 2.50
263,
7,'6~'5
.Mil.
o,
Mil.
9' 10
',
. , ..
1,~9
511.
574
H)O
105
11~
112,
, :', " { ,
.,
,
''
'
1,789
---.. . . 'Mil.
,2,683 " .. 151 }:
.. - - -
I'
. ,
,
, Mil.
,If. _,1-
.: " . '.~ \ t, ~~
672 ,), 1~6.
r" :':',
792 118 ~, 53~,.' ''< '113;' .
':Unit'e..d: States
5, O,3?, ' .. 5,13,2 102
31,571 33,083 105
2r 11 . R,eyi,sed.
'J . \ .1"
'.
Preliminary" 3/ Fe~eral-State Market News Service ,...:... ~"or
the purpose ofthis report a commercial poultry slaughter plant is defined as a
plant which slaughters a weekly average of at least 30,000 pounds live weight .,'.':
while, i,n o?eration. (Converted bom w~ek1y to, monthly basis.) 41 ,South, Atlantic
states: ,Del., Md., Va., W. Va.; N. C." S. C., Ga., ~",la.:, '
MID- MONTH PRIC.s;S RECEIVED AND PRICES PAID
,
.. , ' ,
,',
,\
.. . "Geo~~'ia " '
'\
,'
~ ,United States ,
.
:, ' .,ltem " ~" ..:' ..~. " , J'une 15, ,May 15, _, June ...l5 June',lS May 15 ,Jun~ l~' "',
",
. l : .'
19.58
1959 ' 1959' 1958 ' 1959 1959' "
.,
.
,-
:
,,
,,
Prices Received:
.:-;CentS ' ' Cents ,
. Cents Cents
,
:
Cents Cents
Farm Chickens (lb)
Com. Broilers (lb) All Chickens (lb) All Eggs (dozen)
17.5 20. 1 20.0 52.4
13.0 15.2 15. 1 36. 1
13.5 15.0 15.0 37.2
16.0 21. 1 20.4 35.2
1.1.4 16.0 15.5 25.1
10. 1 15.8 15. 1 24.9
Prices Paid: (per 100 Ib Dol.
BrOiler grow. mash Laying mash Scratch grains
5.10 4.80 4.35
Dol.
4.90 4.75 4.20
Dol.
4.90 4.75 4.20
Dol.
5.01 4.47 3.99
I
Dol.
I
4.89 4.51 3.94
Dol.
4.87 4.45 3.93
.... _--.----_
_-- .. _--.--.---------------_ .. ----------------------
For this project State funds were matched with ~~ederal funds received from the
Agricultural Marketing Service, USDA, under Provisions of the Agricultural
Marketi.ng Act of 1946 .
... _... _--, -------------_._---------, ------.-.------------------------------
End-of-Month Stocks of .Poultry, Poultry Products, Meat and Meat Products Unite1i St~tes
Shell eggs: Incr~ased by 51 thousand cases; June 1958 increase was 147' thousand
cases; average June increase is 198 thousand cases.
Frozen ~ggs: Incre~sed by 32 million.pounds; June 1958 'increase was 34'million
, : .pounds; average June incre'ase is 21 million pounds. '
', :
Frozen poultry: Decreased by 2 million pounds; June 1958 decrease was 6 million
pounds; average June decrease is 9 million pounds.
"
Beef: Decreaifed by 22 million pounds; June 1958 chanie was an increase of 8
million pounds; average June change is a decrease of 11 million pounds.
~: Decreased by 11 million pounds; June 1958 decrease was 33 million pounds!
average June ~ecrease is 56 million pounds;',
.
Other meats: Decreased by 14 million poW)ds; June ,1958 decrease was' 2 'million
poun~s; avera:ge June decrease is '4 million pounds . ,
Commodity
Unit
. June .
.:1954-58av.:.
Thou.
June 1958
Thou.
May 1959
Thou.
June, 1959!! '
Thou.
Eggs: Shell. . . . . . . . .~ Case Frozen eggs, total. . : Pound
1.610 110,120
852 134,218
1,004 119, 273
1,055 151,344
Whites
: do.
Yolks . . . . . . . .: do.
Whole or mixed. . . :, do.
53.081 41,101 68,375
45,379 37,789 46,056
33,214
33,363 48,902
40,807 44,239 61, 134
Unclassified
: do.
1, 551
4,994
3,794
5,164
Total eggs2/(case eq.).; Case
Poultry, frozen:
Broilers or fryers .. ; Pound
Roaster s. . . . . . ..: do.
Hens, fowl~
: do.
Turkeys
: do.
Ducks........ : do.
:---------------------------------~---.-----
6,026
4,250
4,024
4,886
:-------------------------------------------
16,029 5,268
24, 142 63, 516
6,619
14, 564 2,414
22,281 80, 314
2,788
24,612 9,916
57,652 67,688
3,230
24,204 , 9, 133
58,881 65,240
4,816
Unclassified1 : do.
Total poultry
: do.
Beef: Frozen, In cure
and cured
: do.
24,260
17,620
35,939
34,631 .
.-----------------------.-------------------
139, 834 139, 981 199.037
196,905
:-------------------------------------------
115, 718 108,427 173,196
150,848
Pork: Frozen. . . . . . ..: do. In clire' & cured. . . .: do.
243,205 77,458
155,358 54, 578
307,512 57,848
~
2~3,828
54,412
Other meat and meat products. . . . . .
Total all red meats.
do. do.
82,724
77, 140 107,964
93.608
.. . ---5-1-9-',~1-0-5----' 3-9-5-;-5-0-3-----6-4-6~,-5-2-0------5-3-2-,-6-9-6-
!! y P;reliminary.
39:5- Frozen eg'g;-~-~~;ertedon basis of
pounds to the case.
ARCHIE LANGLE Y Agricultural Statisticlan In Charge
RAYMOND R. H,bNCOCK - W. A. WAGNER Agri~ultural Statisticians
.
.,:E~
<GI(Q).~<IGll~<O 2" JUU~L i\
Y ,,....'"
AGRICULTURAL EXTENSION SERVICE UNIVERSITY OF GEORGIA AND THE STATE DEPARTMENT QF AGRICULTUR~
Athens, Geol"gia
1..5
~I&:JP>(Q)~1rllNG SE~VllCIE
U. S. DEPARTMENT OF AGRICULTURE AGRICULTURAL MARKETING SERVICE 319 EXTENSION BLDG., ATHENS, GA.
July 20, 1959
PULLET CHICKS F'OR 'BROILER HATCHERY'SUPPLY FLOCKS June 1959 - United States
The indicated domestic placement of pullet chicks for broiler hatchery supply flocks by "leading primary breeders of ,broiler replacement stock totaled 2, 392,000 chicks during June"19 59. Tilis was 26 percent 'less than do'mestic placements of 3, 234,000 chicks in June 1958. Total placements (domestic plus exports) were reported at 2, .575,000 as compared to 3,409,000 a yea,r earlier.
Domestic placement of pullet c'hi'cks' d~ri'ng 1958 are published for the
fir st time in this report. The placement data include pullet chicks sold during the month, plus the number of pullet chicks expected from eggs sold during the preceding month.. The conversion from eggs to expected pullet ch\cks was made on the basis of 125 pullet chicks per case of hatching eggs sold. The primary breeders included in this report account for a very large percentage of total supply of replacement pullets for broiler hatchery tlupply flocks. Sales .of replacement pullets by these breeders provide an indication of the potential number of pullets available for addition to hatchery egg supply flocks several months before the pullets will actually move into the flocks.
Pullet Chicks 11 Placements for Broilt:lr'Hatchery Supply Flocks
- (Reported by leading breeders)
-
Total
Domestic
Month
...
1957
1958Y
,
1959
1958
'.--
-
1959
1959 as
'/0 of 1958
Thou.
Thou.
Thou. ,
Thou.
l'hou.
Percent
January........ February....... Mar ch. .. '. ...... April. ......... May........... June ..........
July.......... August . . . . . . . . . September ...... October .... ~ ..~ . November ...... December ...... Annual T ota1. ..
1,886 1,997 2,538 3; 033 2,899 2,060 1,676 1,410 1, 935 2,297 1,926 2,238 25,895
1, 982 2,li4
2,281 2,414
3, 132 3,450
3, 331 3,765
3,641 3,007
3,409 2,575
3,071
2,668
.
~
~
,.2,718 .
2, 585 2, 153 2, 165
.~ -
33, 136
1,842 2, 162 2,997 3,234 3, 522 3,234 2,892 2,486 2, 546 . 2,473 2,048 2,004, 31,440
1,884 2,256 3,209 3, 573 2,861 2,392
,
..
102 104 107 110
81 74
: , .,
"
1/ Includes expected pullet replacements from eggs .sold during the preceding
month at the r.ate of 125 pullet chicks per 30-dozen case of eggs. 21 Revised.
ARCHIE LANGLEY Agricultural Statistician In Charge
W. A. WAGNER Agricultur-al Statistician
:.'
CHICKENS TESTED
.. .14
G~.9R.GIA;. In Georgia 253.0'13 chickens for supplying broiler' ~atctling e~gs' were
testeA for pul10rum disease during June 1959--37 peJ;cent more .than
the 185,343 teste:d in June 1958. Testings of egg-type chickens for June were
25,
032--4~ percent
more
than
th.e.
17,445 tested '.'.
in
June
1a.-st..year.
UNITED STATES: There were 1. :609,452 chickens for supplying broiler hatching
. . .'
eggs tes,ted in June 19~9--up 23 percent from June .1958. The
cum~ative t.otal. forthe.t.esting year July 1958 through June 1959 of Z7, 205,494
was
2
,
'
5. ,percen
t, more t
h
a
n
during
th'ese
months
a
.year ,
earlier.
.
:( I~ the, State.s for which comparisons are availabl~, 323; 650 chick~~s 'were
tested -in .tune for supplying eggs for egg-type chicks--up 12 percent from June
1958. The number tested July 1958 through June 195.9 of 13, 159, 8~0 was about
1 per~. ent le'ss than .the number tested during this . p. eriod a year ea~.lier.
This report is made possible through the c~operation of th~ r,latiotial Poul~~y~inprovementPlan official State agencies, the Animal Hu.sbanclry
'.
Rese8:rc~ Division, Agricultural Research Service and the Agric~ural Esti~atel
Division;' A~ricultural Marketing Service.
.
~~
Geor~~a_-_~Chickens 'Tested by Official State Agenci~s
" .-
For Broiler Production
Month
By ont~s
. 1957-58 : 195.8-59
CUl1}ulative
. 1957-58 : 1958-59 ..
July .; : 20Z, 194
Aug. . , :,230, Z9Z Sept. , :' .334, 5Z2
i53~ 86'5
Z40,301.
413,1.64
2Q2,194 432,486 . 1.67,008
Z53,865
.49'4,167
907,431
Oct.
: :306,795 458,.~42 1,073.. 803 1, 3'65, 873
Nov. : 254,554 388, 136 1,328,357 1,754,009
Dec. .: 25Z,517 432,318 1, 580, 874 2, 186,327
Jan. :: 414,416 564,491 1,995, Z90 Z, 750.818
Feb. ': Z75, 7.50. 482,21Z 2,271,040 3, 233,030
Mar. ': 255, 111 400,437 Z, 5Z6, 151 3, 633,467
Apr. May
: Z11.09.3' 275,Z75 2,737,Z44 3,908,74Z : Z54,024: 24Z,067 ~, 991, 268 4, 150, 809
June
185,343 1.53,013 3,176.611 4,403,82Z
Egg TyPe Chickens
'Sy'l\4onths' 19~7-.58 : 1958-59
] .~--- -
17,274
30~ Z9'9
47,73.6
4Z,581
18,286.. 3'5; 65Z .
27, 24Z
41,043
8,3Z5
26, 186
14,836
~,778'
61,618 . '34, '194:'
13,675
5, Z80'
; lZ,086
4,994' '1
57,4Z6
6,779' '\
10, 849
5, 561
. 17,445
25,03Z
United States - Chickens Tested by Official State Agencies
For Broiler ,Production
. For Egg Type Chickens
Month ----
-. by MQnths 1 I ,;
.
:.
. - . by Months 21
July
1957-58
..;
:
: 1, 310, 378
.
:
1958-59
. 1957-58
:
1,628,IZ9 I
363,753
.
:
1958- 59
..
500. 558
Aug. : 1,600, 805
1, 596,79Z
676, 162
599,607
Sept. : 2.310.549
2.643,740
1.251, 370
1,243.658
Oct.
: Z.723,936
3, 119,754
2,379,471
Z,318.2Z9
Nov. Dec.
: 2,Z25,580 : 2,208,307
2.951,368 Z.794,873
I Z,483,280 2, 586,456
2.349,994 2,487,248
Jan.
: 2,014,868
Z,601,9Z7
1.741.051
1,648.909
Feb. : 1. 28Z, 382
2.363, 505
454.617
756,864
Mar. : 1, 587,391
Z,320,302
485, 136
4Z1,587
Apr. : 1, 701. OZZ
1. 928, 397
Z45,750
267,870
May : 1, 554,643
1,647,Z55
276,008
241.636
June : 1.310,490
1. 609,452
289, 142
323,650
:
11 All States except Mont., N. Mex. Ariz . Nev.
2/ All States except Ohio, Del.. Okla. Mont., N. Mex. Ariz. Nev.
Ga
--".....-...=----. "1
'
....
"
... '. -.....~" \.,,~'"\'.'.r'"
"'
f'
-::
.,/"'~H->- ~,~
I . . f
I
",
_ ~. _...
...
,f'
I
' ,
I
I
"\
,~'
I
J
1 .... , \ ,~~ _
,-',
\~.
.~
\,-
:
.
{
,.. '.
'. (,~~:1.~.'~.
iI
,;'
..' .
;"','
:,,'\'~' :
.
.""'t'l.-". ,~"'~I1~
I "I<.e,"
I0_ .. ....1~. I
"d' It ',\, J
'"'
~.:..r:!
~
-
G E 0 R G I A C R 0 PRE P 0 R TIN Q. 5 IL :R: VI eJ!~'
FF1< ' \/ \/\1I~~J ~J
JUL-2 3;59
-r r rI Jr/\\ '-...I-J~
r r" l~\:,"~-'",,~
'91(
1.
"'~~~~~:'4'."'';
'.
Released 7 /22i 59
GEORGIA CHICK HATCHERY REPORT
j
Athens, Ga., July 22 -- A total of 6, 554,000 broiler chicks were placed with producers in Georgia during the week ending July 18, according to th.e Georgia Crop Reporting Service. This compares with the 6, 573,000 placed the previous week and is 3 percent more than the 6,340, 000 placed the same week last year.
Eggs set by Georgia hatcheries amounted to 8,337,000 compared with 8,741,000 the previous week and is 3 percent less than the 8, 560,000 for the corre sponding wee~ last year.
The majority of the price s paid for Georgia produced hatching eggs were repo'rted within a range of 50 to 65 cents with an average of 55 cents for all hatching eggs and 53 cents for eggs purchasedc;t the farm from flocks with hatchery owned cockerels. Last week the range was from 50 to 65 cents with an average of 55 cents for all hatching eggs and 53 cents for eggs purc~lased at the farm from flocks, with hatchery owned cockerels. Most prices charged for chicks ,were reported within a range of $8. 00 to $10.00 with an average of $8.75 per hundred compared with a range of $8.00 to $10.00 with an average of $9. 00 per hundred last week. The average price s last year were 76 cents for eggs and $12. 50
for chicks.
, Weighted average price from the Federal-State Market News Service for broilers during the week ending July 18 was Georgia broilers 2 3/4 - 3 3/4 pounds at farms 14. 82f.
Week Ending
GEORGIA EGGS SET, HATCHINGS, AND CHICK PLACEMENTS
BROILER TYPE
Eggs Set lJ
Chicks Placed for Broilers in Georgia
EGG TYPE
I Eggs Chicks Set Hatched
1958'
1959
1959 0/0 of 1958
1958
1959
1959 %
of 1958
1959
1959
Thou. Thou. Percent Thou. Thou. Percent hou. Thou.
May 16 9, 589 9,251
96 7,237 7,165
99
May 23 9,766 9,236
95 7, 113 7,053
99
May 30 9,668 9,236
96 7, 151 6,951
97
June 6 9, 616 9,276
96 7, III 6,002
98
June 13 9,360 9,312 , 99 7,063 6,961
99
June 20 9,082 9,210
101 7, l53- 6,807
95
June 27 8,658 9,210
106 6,878 6,922
101
:uly 4 8,741 9,073
104 6,724 6,776
101
July 11 July 18
8,771 8, 560
I 8,741
8,337
100 16,869
97 ,1 6,340
6, 573 6, 554
96 103
373 494
280 435
239 184
245 169
165 179
218 Z/ 166 81_ 190
113
97
36 191
103
61
II Includes eggs set by hatcheries producing chicks for hatchery supply flocks. '[I Revised.
ARCHIE LANGLEY Agricultural Statistician In Charge
W. A. WAGNER Agricultural Statistician
u. S. Department of Agriculture
Agricultural Extension Service
Agricultural Marketing Service
State Department of Agriculture
319 Extension Building, Athens, Georgia
"-'-EGGS SET AND CHICKS PLACED IN COM.M.ERCIAL AREAS. BY WEEKS - 1959
Pag-e 2
.
.-
.-
."
Week Ending
.,
!
3TATE
July
4
July
'. 11
July
18
June 13
June
lO
June
27
Ju~y
4
July
11
July
. 18
EGGS SE T - THOUSANDS
CHICKS PLACED - THOUSANDS
Maine
1,424
1, 557
1, 512
1, 310 1,228 1,263 1,186 1,222 1,202
Connecticut Pennsylvania
I, 144 1,256
1,094 I, 194
989 I, 163
590 913
635 677
568 735.
..
620 814
551 . 607
719
833
Indiana
1,895
1,941
1,798
810
831
862
778
854
825
Illinois
184
205
233
100
110
136
99
106
129
I-
Missouri
1,911
1,899
1, 892
742
839
799
818
754
908
.~
Delaware Maryland
1,671 3,009
I, 592 2,989
1, 585 2,978
I, 755 1,742 1, 694 1, 722 1,778' 1, 591 1,905 1, 869 1,'963 2,001 1,894 2,055
~
Virginia
2,243
2,000
1,940
1, 168 1,322 1, 124 1,066
993 1, .11.7
West yirginia
325
297
307
658 . 533
529
521
550
565
North Carolina South e:a-rolina
3,608 '532
3,463 500
3,462 487
3,037 3,019 2,926 2,981 2,919 2,930
338 . 339
357
327
35i '366
GEORGIA
9,073 8,741 8,337
6,961 6,807 6,922 6,776 6,573 6, 554
Florida
314
342
312
223
231
206
225
172
106
Alabama
Mis sis sippi Arkan6a.s Louisian.a Texas Washingt.on Oregon California.
4, 189 2 , 9 0 0 :. .
4, 131 691
3, 108 351 352
1,475. :
4, 107 '2,942 3,849
688
3,071 346 387
1, 311
4,024 2,Q39 3,829
662 2,915
3'9 329 1,416 .
3,461 2,533 3, 566
448
2,306
374 276 978
3,470 2,439 3,398
468
2,299 384 247
I, 103
3,461 2,256 3,231
487,
2,367'
341 262 1, 108
3,406 2,464 3,580
449
2,250
332 243 1,015
3, 394 2,370 3, 525
386
2,301
306 238 1,021
3, 363. 2,292 3,483
354
2, 157 351 -. 203
945
.'
TOTAL 1959 . TOTAL 1958' .'
1959 % of 1958
45,846 47,712
96
44,515 47,176.
94
43,488 46, 546
93
3.4,452 33',990 33, 597: 33,673 32,977 32,936
..
36,900 93
36~ 889 92
36~ t31 ~3'5, 436
,1 .~
. '.
93
95
34,912 94
33,846. 97
.
2
G1E(Q)JR{GHA CIFlCO>1P' 1R1EIPO~1rllNG S[~VHCIE
AGRICULTURAL EXTENSION SERVICE
U. S. DEPARTMENT OF' AGRICULTURE
UNIVERSITY OF GF.ORGIA AND THl!
...,
AGRICUl,TURAL MARKJ;TI~GSERVICE
STATE DEPARTMEHT' OF ~GRICUL;jtURE': \;0.
.:. . :.' ..... ": .' ~ 319 E}(TENSION BLDG:, ATHENS, GA.
Athens, Georgia
... ' .
. ':' .::" ;'. '. '. ~"
',
July 22, 1959
..
.... ~.,
' . .TALL FESCUE SEED F.O~CAST ~. S.OUTBERN. AREAS '
~"...
, '. :.. _.
:
~. !-
:. ...._ ..
at GEO~QiA~. Production of' ['all Fescue' Hi <Georgi8,Js" forecast 1,330,009/Pounds"
'.:,;" ~ompaz:ed ~th 1~505.rOQO. PQUIlds "in 1958 . Weather conditions were ..
general~,taYdrable during the growing season. Frequent, heavy rain~.,during the
harves~il'lg .season made it di~:fj,~~J;.1l<'t:Q~pr..odU'cers. .to 'carry. out harw'st-ing opera-
tions ori' 'sclieduie and shattering was severe in some areas. The acreage harvested
for seed 1s estimated at 7,000 or the same as for 1958. The yield ~er acre of
190 ~upds is. 25 pounds. below 'last season. , . . . '
... "
"
)
.:
,~
~ " .
' .
I~
'.,
. 'nl~, 1959 crop ot tfI,J.l fescue seed. in 9. Southern 'States~ forecaB~ at l7,820,QOO poun~s,. is 26:~ercent.under the .23,966,000 poUnds harvested last yelifr' and 18 '.
percent. -pelow the fiye,:,y.ear average.:: .. Reductions i'n acreage,' particularly in Ken-'
tucky" 'and generally.: sllIa.ller yields contribu.ted to the decline in this year' s
.
crop.,~.A report on th& ,late h.ai-vested tall fescue"'seed crops in Idaho:, Washingtoni~
and 9regon '411 be i:sS\ied on August' 9..3. The'. 1958' estimate' for thes~:~three Stat~~ _..
totaled 2,475".600 pounds. . .,
-): .. :.: . . : 1.
.
....
....
.... _......
.
.' ":'.: ~ !
1n 'Talf fescue' $. ab111ty. t? p'r,?d}1ce early. ~p;t'ing. groJith resulted a .sparse " ..... _.
development 'ot seed. heads this year. The early growth was over-grazed in many
areas to carry 11vestock through a period of hot, dry weather. Lashing winds and
-rains in late May and early June also shattered out same seed in the ripening
heads. Further, some stands of tall fescue were included in the Conservation
Reserve and could not be harvested for seed. However, weather during the harvest
period favored recovery of seed.
The Kentucky crop is off about one-third from last year, Missouri and
Tennessee are down one-fourth and Georgia and Alabama are down about one-twelfth.
In contrast With these declines, an increase of 5 percent is forecast for
~outh Carolina. The larger acreage ha.rvested 1n this State more than offset the lower yield per acre.
Harvesting of this season's crop began a few days later than usual but earlier than last year. The average beginning date of harvest this year was as
follows: June 15 in Georgia and Alabama; June 17-18 in Arkansas, Mississippi, and South Carolina; June 21 1n Kentucky and Tennessee; June 24-25 in Missouri and Oklahoma.
Carry-over of old crop tall fescue seed qy Southern growers on June 30, 1959 is estimated at 73'7,000 pounds and compares with 936,000 pounds a year earlier.
CARL O. DOESCHER Agricultural Statistician
ARCHIE LANGIEY Agricultural Statistician In Charge
(over)
UNIVERS~TY OF GEORGIA
JUL 24 '59
t1BRAR',',
-",
I
.,
, Tall Fescue Seed': Acreage Harvested, Yield per, Acre and Production.. -
- - "
-"- -
-
-
-
-
-
-
Average
---
1953-57, Annual 1958 and 1959 - -------------
-
-
-
-
-
-
-
-
-
: _ _A..r~age_h~ry,e.t~_d _ .:. _ Xi~l2:. Roe!:. ~c!.e _ _ :~r.Q.d~cli.Q.n_oi..l~a!! ..e~d_
:
: " ' :Indi- :
: :Indi- :
:
: Indi-
State :Average: 1958 :cated:Average :1958 :cated:Average: 1958: cated
- - - - _:1923.:.51:
.;.12,52, .:..12.5~-2.7_:
:~92.9_:.!92.3.:.51 .:.. I __ .:.. _12,52 1,000 ,000 1,000
Acres
,'
Acres Acres Pounds FoundS Pounds pounds pounds pounds
Mo. S. C.
Ga.
Ky. Tenn.
9,100 7,100 8,600 45,400
' 3.5,200
12,000 10,000 ' 209 10,000 11,000 177 7,000 7,000 175 49,000 36,000 244 17,000 16,000 195
200 175 1,919 ,2,400 .1,750 210 200 1,275 2,100 2,200 215 190 1,546 .1,505 1,330 235 200 11,093 11,515 7,200 220 175 2,963 3,740 ,2,800
Ala.
6,800 7,000 6,500 218
Miss. ' ,:3,000 2,000 2,000 153
250 240 1,483 1,750 '1,560
160 160
446 320' ,320
Ark.
Qk!a.:..
___
4,500
g,14
3,000
___7Q!J_
3,000 _1.l..0Q9_
_117!92_
_
_1~7o0_
170
_12.0_
_
_
780
~2g
__
!5?10
__
510
15_
Total
_9_S!a!e! ~og,~ _17.1.7_ 22J..5O_ _2~3___2g3__123__21,~21 _2~,2,6._11,~2Q_
.
/0
:~,
G~ ORGIA CR OP RE POR TING SE R VICE
r",- ,'i\,..', _
" "ro..' ' \ "'J
'J -, '''~'i,i\~'/ ' .,....: .-<:; ):,' ... .\-....~.;.rJ ".~r'.)\ . .. ~"-,.-.dI
"r'
J...
.ufiIYERSnv OF C
JO.'L "2';759
>.' - -
,.
"-~'h"-e',:,'!...'..:."<":Jt\-l('/"=\.-l,/=',\:/.'.~(::',~~.:::_,.
Dr JO ' . J ':.' ,; r J . .. ' r') ~
.
'I ~' ":
~ .-:..-J
~
LIBRARIES
l' ,
;,
!,;,
,,
Released: July 23, 1959
. .'/,'.. J
1958 PRODUCTION BY COUNTIES
.
\' ,
These estimates include all counties with a production of 300,000 or mbre
cOtnmercial broilers. Production for those counties in which less than 300, 000
bir,ds were p,roduced are included as other counties. These estimates are 'b'ased
on 'information furnished by Hatcherymen, Feed Dealers, Processing Plants,.
Producers, County Agents and other' Agricultural Workers.
:.
Cherokee County ranked first with a production of 26, 200, 000 birds, followed in' order ~y Hall, Forsyth, Whitfield, Jackson, White, Habersham,
Franklin, Lumpkin and Gwinnett.
County
,
~aOILER PRODUCTION
. ,- --- ,-.........-- ------- --
-
-~ --~
- ---
-- '
Number,' Rank
County
Number
,Rank :,
Cherokee ", 26,200,000
I
3,600,000
23
Hall Forsyth
.~. W. hitfield
J'ackson White
25,200,000
2
21,000,000
3
13,600,000
4
12,100,000 ,
'. 5
11,500,000
6
3,570,000
3,360,000
3, I 50,000
.':
3,040,000
2,830,000
'24 25 : '26 '
'17
28
Habersham
11,000,000
7
2,640,000
29
Franklin
10,500,000
8
2,620,000
30
Lumpkin Gwinnett
10,000, 000 ;." 9
I'
8,400,000
10
Z,620,000
31
2,600,000
32
Gordon Carroll
7.. 900,000'
11
" '7, 100,000
12
1,890,000
33
,'
1,780,000
34
Murray
6,800,000
13
1,580,000
35
Pickens ... \.: ;',
Dawson
6,800,000
14
,"
6,300,000
15
. 1, 570,.000
36
I :. I ~ I; 570,' 000
31
Gilmer
5,000,000
16
1,470,000
38
Marion
4,830,000
17
1,470, 000
39
Madison
4,410,000
18
1,410,000
40
Elbert
4,300,000
19
1,260,000
41
Banks
4,200,000
20
1,050, 000
42
Coffee
4,200,000
21
1,000,000
43
Union
3,670,000
22
960,000
44
____ ._M.
. _. M (Over)
_
u. S. Department of Agriculture
Agricultural Extension Service
Agricultural Marketing Service
State Department of Agriculture
------_ ....----- .. _---3-1-9-_E.x-t.e-n-s.i-o-n--B-u-i_ld.i_n_g.,_A._th-e-n-s-,--G-e-o--rg-i-a-------------
County
Macon Bibb
. t.
Newton Taylor Turner Lincoln Ware Heard Troup Jasper it"'loyd Oconee Irwin Emanuel -Atkinson Telfair Laurens Upson Pike Polk Baker Sumter Thomas
1958 BROILER PRODUCTION BY COUNTIES
N.umber
950,000 :9,~O, 000 920,000 890,000 890,000 840,000 840,00.0 820,000 790,000 790,000
Rank
45 46 47 48 49 50 51 52 53 54
!
!I County
j
i
i
I
!! Terrell
Ii Appling
i
I
I Coweta
! j
I Henry
!
i
i
i
i
Webster
I
,1 Tift
I
i
I
l
Wilcox
i
I
i
Wilkes
I
I Clay
I
i Liberty
Number
450,000 440,000 430,000 420,000
4~0,000
400,000 390,000 380,000 370,000 360,000
730,000 730,000 710,000 600,000 580,000 560,000 540,000 520,000 500,000 490,000 480,000 470,000 460,000
55
I! Crisp
350,000
56 j Morgan
!
340,000
! 57
Greene
330,000
!
i
58
Ii Brantley
320,000
59
~
i
Berrien
!
60
! Dodge
,.~, 'r.
310,000 300,000
61
I,!
I
Chattooga
j
300,000
~2
i t,I!
I
I
!
63 I
i
64
!
i
65
I
i
i
Other Counties
i
66
!
!j STATE
67
I
!
TOTAL
7,739,000 292, 119, 000
f
I
Rank
68 69 70 71 72 73 74 75 76 77' 78 79 80 81 82 83 84
I 1
"
ARCHIE LANGLEY Agl'fcultural Statistician In Charge
w. A. WAGNER
Agricultural Statistician
...
3/0
~.~3(GIE(Q)~CGllA (CJR{Q)~ ~JEJP>(Q)IRrrllNCG SlE~Vll<C[
GRICULTURAL EXTENSIQN S~RVICE : UNIVERSITY OF GEORGIA AND THE,
STATE DEPARTMENT OF AGRICULTURE
Athe~s, Georgia,
.
195
JUl29 '59
,~~ARIES
'" u. s. D'EPARTMEN1' OF AGRICULTURe:
AGRICULTURAL MARt<ETING SERVICe: 3UtEXTENS'ION BL.DG ATHEt.s. GA .
July 27, 1955i'"
rt
Georgia: The 1959 calf crop for Georgia is eXpected to total 615,000'head - one
,percent iess th~n the 1958 crop ,of 679,000 head. Compared to the
10year ~:verag~.. (1948-57) "~alf "crop' of, "558,00.0 hea~, 'this year's calf'crop is up
21 percent. ':
':.
.
United States:
The 1959 c~lf crop is expected to total 41,328,000 head, 2 percent greater than the 40,514,000 calves born in 1958, and 7 percent above the 10-year average,
according to the Crop Reporting Board. This is the first increase from the previou~ year si~ce the record crop of 42,601,000 head in 1954.
The larger calf crop this year is the result ,of a larger ,number of cows and heifers 'on farms and an increase in the calving percentage. Cows and heifers 2 years old and over on January 1, 1959 totaled 47,190,000 head comp~red with 46,520,000 head ~n 1958. The expected number of calves born and to be born in 1959 expressed.as a percent of cows and heifers 2 years old and older January 1,
1959 was' 88 percent compared to 87 percent in 1958 and 1948-57 average of 86 percent. The current percentage was equaled in 1942 and 1953 but never surpassed
in tlie 35 y~ars of record. This percentage is not strictly a calving rate since
the January 1 inventory of cows and heifers 2 years old or' over does not include
all the heifers which give birth to calves during the year, and it includes sdme cows that are sold before calving. The percentage, which shows trends in pro~
ductivity over a period of time, fluctuates from year to year due to variations
in cow slaughter and in Withholding for breeding ~erd replac~ment.
Southern States: ~,
The estimated 3,347,000 'calves for the South Atlantic States exceeds a year earlier by 1 percent while the 10,997,000 calves in the South Central States is
4 percent over the 1958 crop. The 16 states in these two regions account for
35 percent of the u. S. total. In t~e South Atlantic States the calf crop
~xpressed as a percent of cows and h~ifers 2 years old and older is 79 percent ~nd in the South Central States, 86 percent.
ARCHIE LANGLEY Agricultural Statistician In Charge
RAYMOND R. HANCOCK Agricultural Statistician
l:: (.'::~ '.~
" t!~ "".; ~ .~I ':"{ ~
:
, . ?F'rj
r~... ~T~'!': .J'.~l /l':r,)~~ .:~; ~~~; I
Calf cr~ .J~~port, July 1959,
:!.~... ' '.~' ;,',,1: ,~.. ' :.:,'. :'...;;",J ,.~~~
- - -'''7' . -:::.~
State': .:
C2owy-rasnd. "'&7h-eoM-~i.-f~er-r.'"Q,-':::',:'.~'':-cCoa-wl",sy-eas-nbd-orh-ne
-as-~rce~o1-":::''''
i
f
e
.
rs
2 yr~~&: ] : ' - .
-'-. -.:-:'.t':7,~'-::"".r": . ,;':, Ca1ve~~"pc>,r~';:, . . ~ .., '\'. ~ ... ". ... ~. ~
and :
.J:L J!Il~_i__ ':" _:J4..e:: la!l~l.!
.:.
_ ~ j'_i~!":'::~'.
division :10-,.ear:
:
:10-year:
:
:10-year:
:
:average: 1958 : 1959 :average: 1958. ; 1959 :average: 1958 : 1959
:1948-57:
:
:19'8-51-:'
':'.;
:1948-57:: gj
i,OqO. ... ; ~ ~~?O0 .t~q90. 1,09~ - - - - - - - - - - - - - - - - - - - - - - - - - ,.. - - - - - - - - r-- - .-; - - . ~ """"":
.
1,?OO ..
J'
,
. ' .....
'
l;OO(}:"
head .head head PercBIlt Percent ferc.nt,' head pead. .. f head,.
Maine' . .:
N. H. . . : Vt. . . : Mass. . :
128":
71 303 128
118 . I 113 85
64
60 84
298 289 81
110 loB 82
8 4 : 86
82
85
82
84
83
82
109 99 ...... 97
60 52 51 246 244 :.,243' 105 ..91.... ... 89"
R.I. .. :
20
17 ..' 17 81
81
82
. 16 14 14
Conn.:: 119 110" 105 82
79
83
97 87 81.
N. Y : 1,468 1,473 '1,448 86 . 85
85
1,266 1,252 1,231
N. J
: 158 . 15.4 '152 79
81
82
125 125 . 125
S- - Pa. .. N.A. Ohio . .
:
:~--
31,,0M52
1,150
-
-
131,;14ll25l:~~;'-"
1 1Z2: -'414 1-;094 -
85
86
S4-
8"6-
-
_
-
...
S~' ~-
-
-
87
--8~-
-
-
-
896 -2-91 - .L9
2,~0~652S93'
...976 -2 9f3
- .L9b3
Ind. . .':. . 951 898 . 868 90
88
89
852 790 773 '
Ill. . . :' 1,446 1,420 1,398 99
90
89
1,307 1,27~ 1,244
Mi ch .. ' :: 994 937 919 86
86
87
851 806 Boo
Wis. '. . :_ g,.z.26 _ 2,2.91 _ 2,607 _ 91
23
32.
~32.7 2,~1.z. _~3~6.
E.N.C . .:.. _7J..0b__bJ.377__biS8b__S'2.
92.
~__ ~ _ J20_bJ..257_ 2,.!2
Minn. ' .. : 1,738 1,7S'1' 1,749 92
91
91 .. 1,599 1,621 1,592
Iowa . .: 1,953 1,942 1,984 93
95
95
....1,822" 1,845 ..l,885
Mo. . . : J.,794 1,834 1,930 92
92
90
' .. 1,64~- 1,687 1,737
N.Dak .. ~: 871 974 980 89
.90 89
'.' 776. f377. 872.
S. Dak. .:. 1,372' ]',530 1,575 90
93 ..... 94
1,231 1,423 1,480
Nebr. .' .: 1,772 1,819 1,872 90
92-::' 93
1,597 1,673 1,732.
Kans . . . :_ !,~92. _ !,226 _ !,578 _ 20__ ~ 20~ ~ _.3J.
1J..514_ !,37~ _1J..468
W.N.C. :_11,192. _11,~0 _11,6S' _ 21
22
9g
.!~lg1....10,~2 .!0~...76.~
N.C . . . :_~,~1_~,38~_~,55!t _ ~O
~1
..3.!
!bJ..~7_1,15 !6J..82.~
Del. . . :
~1 41 40 00
B"l . 82 :',':.' .:'. 33 . 33 33
Md. . ' . : 281 306 302 85 .'85
88 .'. :. ~38 '. 260 266
Va . . . : .717 740 732 83
.84
85,
592 622 622
W. Va . . : '324 . 316 30B 84
82:..84
274 259 259
N.C. ..: 494 585 598 78
81
79
387 474. 472
S. C. . .: 280 351 341 78
77
80 .. ,
219 270 .273
Ga. ..':
Fla... :__
702
~6.!
_
838 1,Q,3.
_
833 1,2.92
_
7.95
881
861.
3255.98__
~7t
10
6~5
7~7
s. A. :_ ~,I0Q, _ !t,g;f _ !t,g5~ _ ~7
18
72
2J..82.9- ~,30~ _3J..3~7
Ky . : 923. 900 995 07
91
92
. . 806 "ff79 915
Tenn : 939 1,003 993 86
86
89
j,:' 812 863 884 .
Ala
: 877 1,048 1,059 78
81
83
683 849 879
Miss. .: 1,150 1,473 1,431 73
73
75
846 1,075 1,073
Ark. . .: 776 870 839 82
80
81
632 696 680
la. . . : 993 1,198 1,160 78
77
79
Okla.. : 1,576 1,577 1,662 89
90
92
776 922 916 l,4Q~ 1,419 1,529
:= := Texas .. : 4,697 4,403 4,683 83
88
88
S.C. ::)1,2)2: ).g,~3~ :=:tg,~2g := ~2:= := := ~:= := := :=8b
3~09 3,875 4J..121 := :9J..8b5-lQ,~7rr !0~27
Mont. .: }.,055 1,202 1,210 91
92
94
9bb 1,10b 1,137
Idaho . : 514 612 632 88
92
93
453 563 588
Wyo. . . : 544 552 562 8!~
89
90
457 491 506
Colo . . . : 880 857 901 87
91
92
765 780 829
N. Mex. . : 681 631 676 80
85
85
547 536 575
Ariz..: 462 419 426 79
80
79
364 335 337
Utah . .: 333 356 360 86
86
87
287 306 313
Nev . . : 298 311 3J.5 77
80
80
230 249 252
Wash. .: 499 523 541 86
90 __ 87 ~~_ 431 471 471
Oreg..: 639 708 752 83
86
8 6 - 533 609 647
Calif. .: 1,2,92. 1,754 1,772 84
86
86
1.l,.343 1,2.08 1.z.,524
West :: 1,2.0Q, := 1,2:2~ := ~,!41 := ~5:= := := ~8:= := := :=8~ := := := :=6J..31.7:= ,25!f :=7J..119
-
U.
-
S.
--
-:-4-4,8-3-2
46,520
----
47,190
----
-
86
--
-
-
87
--
-
-
88
--
-
-
-
38,507 40,514
-------
41,328
---
Y Not strictly a calVing rate. Figure represents calves born expressed as per-
centage of the number of cows and heifers ""2 years old and over on farms January
1.
gj Calves born before June 1 plus the number expected to be born after Ju..l1e 1.
........ .... \ote&&&., ..... ~
~
_10;;11 "'--~ .....'LI..........
.. ~oL .. ;r-- . . - . . - . . . - _.... o.-
I~ ,'" ,\, ..".... -"
1/,..
~
(
~' - -1"' .'""".'\"'1 'i " l
-.I. .:
~I~/.
~
(
:~
r" ~ "',
~.'k,I ~
....~)<-J...... ,
I /.:" v4- . .
.~~ ~-; ' \ :,\ \.I\, ''~,\:,
"'J I
I'. ' ('.1.
'~,l I
.'. .\ ",.,~>- "-.: '\"'~I
I ""t!)
1.4" ',,,. / ,
I,:" \.: t.',. ", "... 1
:.', ,".~..\~
t_'
'".,\.
/
~ ,..~.,.f..\_..-~-~.,.~,
't.~(.:..~.
GEGRGIA CROP REPGRTING-S-ER-VlACE
. EEJ< Y ~\VERS\TYOF lor lKGlA
~v
~ JU~:'~"~9
rLf-\-rCr ~RY
Released: 7/29/59.
GEORGIA CHICK HATCHERY REPORT
Athens, Ga., July 29 -- A total of 6, 298, 000 broiler chicks were plac.ed
with producers in Georgia during the. week ending July 25, according to the Georgia Crop Reporting Service. This compares with the 6, 554,000 placed the previous week and is slightly less than the 6, 329, 000 placed the same week last year.
Eggs set by Georgia hatcheries amounted to 8,231,000 compared with 8,337, 000 the previous week and is slightly less than the 8, 25~ 000 for the corresponding week last year.
The majority of the prices paid for Georgia-produced hatehing' eggs were reported within a range of 45 to 55 cents with an average of 53 cents for all hatching eggs and 53 cents for eggs purchased at the farm from flocks with hatchery owned c6ckerels. Last week the range was from 50 to 65 cents with an average
of 55 cepts for all hatching eggs and 53 cents fot eggs purchased at the fa:rm. . from flocks with hatchery owned cockerels. Most prices charged for chicks wer'e reported withip. a range of $7.00 to $9.25 with an average of $8.25 per hundred compared with a range of $8. 00 to $10.00 with an average of $8.75 per hund~ed last week. The average prices last year were 74 cents for eggs. and $12.00 for chicks.
Weighted average price from the Federal-State Market News Service for
broilers during the week ending July 25 was Georgia broilers 2 3/4 - 3 3/4'
pounds at farms 14. 98f.
'
. GEORGIA EGGS SET, HATCHINGS, AND CHICK PLACEMENTS
Week Ending
BROILER TYPE
EGG TYPE
Eggs Set !!
1958
1959
1959 0/0 of 1958
Chicks Placed for
- Broilers in Georgia
I Eggs Chicks Set Hatched
1958
1959
1959 % 1959 1959
of 1958
Thou. Thou. Percent Thou. Thou. Percent Thou. Thou.
May 23 May 30
9,766 9,236 9,668 9,236
95 7,113 7,053
96
7, 151 o~-951
99
280 435
97' -_. 239 184
June 6 9,616 9,276
96 7, 111 6,002
98
245 169
June 13 9,360 9.312
99' 7,063 6,961
99
165 17.9
June 20 9,082 9,210
101 7, 153 6,807
95
218 166
June 27 July 4
I 8,658 9,210
106
8,741 9,073
104
6,878 6,922 6,724 6,776
101 101
81 190 1842 / 97
July 11 8,771 8,741
100 6,869 6, 573
96
36 191
July 18 8, 560 8,337
97 6,340 6. 554
103
103
61
July 25 8,254 8,231
100 6,329 6,298
100
131 138
!-! Includes eggs set by hatcheries producing chicks for hatchery supply flocks.
2/ Revised.
ARCHIE LANGLEY Agricultural Statistician In Charge
W. A. WAGNER Agrichltura1 Statistician
-u-.
--
S.
-----------
Department
--------------
of Agriculture
-
-------
-
-
-
-
-
------------Agricultural
-------------------
Extension Service
Agricultural Marketing Service
State Department of Agriculture
319 Extension Building, Athens, Georgia
-------------------------------------------------------------------------
.
.
. ~
EGGS SET AND CHICKS PLACED IN COMMERCIAL AREAS, BY WEEKS - 1959 Pag...e Z
;-
,
..
..
Week Ending......
..
:
,
,
-
STATE
July - July
11
18
July
25
June
20
June
27
July , July
4
11
July
18
July
25
:
EGGS SET - THOUSANDS
,
-,
CHICKS PLACED - THOUSANDS
Maine Connecticut
1,557 1,094
I, 512 '. 1,409
989
958
1,228 I, 263 I, 186 1,222 1,202 ..1,212
635
568
620
551
607
629
Pennsylvania
I, 194
I, 163
1,349
677
735
814
719
833
707
Indiana
1,941 1,798 1,753
831
862
778
854
825
878 ..
Illinois Missouri
205 I, 899
233 1,892
. 196
1,902
110
136
99
106
129
108
839
799
818
754
908
865
~
Delaware
I, 592 I, 585 1,483
1,742 1.694 1, 722 . I, 778 I, 591 I, 625,
Maryland
2,989 2,978 3,010
1, .869 1,963 2,.001 I, 894 2,055' . 2, (\(ll
V.irginia
2,000 1,940 1,984
1,322 1, 124 1-, 066 . 993 1,117 . h-272
West Virginia
297
307
284
533 ' 529
521
550
565
515
North Carolina
3,463 3,462 3,447 - .
.3, 019 2,926 2,981 2;'919 2,930 2,764
South Carolina
500
487
489 ..
339
357
327
351
366
354
GEORGIA
8,741 8,337 8,231
6,807 6,922 6,776, 6,573 6, 554 6,298
"
Florida
~
342
312
234
231
206
225:
172
160* 187
Alabama
4, 107 4,024 3,912
3,470 3,461 3,406 3,394 3,363 3,295
Mis sis sippi
2,942 2,939 3, 001
2,439 2,256 2,464 2,370 2,292 2,'214
Arkansas
3, 84.9 . 3,829 3,756
3,.398 3,231 3, 580 3, 525 3,483 3, 597
Louisiana
688
662
685
468
487
449
386 . 354 .. 423
Texas
3,071 2,915 2,907
2,299 i,367 2,250 2, ,30 1 ; 2, 157 2, 142
Washington
346
379
405 "
384
341
332
306
351
303
Oregon
387
32.9
325'
247
262
243
238
203
237
California
1... ~ I}
1,416.
I, 331
I, 103 I, 108 1,015 1,021 : .. 945 -1,045
.,
TOTAL 1959 TOTAL 1958
44,515 47,176
43,488 46, 546
43,051 45, 166
33,990 33,597 33,673 32,977 132,990*.3.2.,.671 36,889 36,237 35,436 3,4,912 33,846 33,378
1959 % 0 f 1958
,.
94
93
95
92
93
95
94
97
98
....
7
ts-
UUITED sTATEs DEPMTUEi11' OF ItGRICULT'Umi:
AGRlCULTURAt MARKETING SERVIcE
WASHINGTON, D. C. '
HONEY REPORT - JULy 1959
'q
'~[[:('uIA
'5
.. tfl-!'!/t'S Ju1l.y 31, 1959
The number' of colonies of bees on hand July 1 in the United States totaled
5,437,000, the 'Crop Reporting Board announced today. This is about the same as on July 1 a year ago. Colony numbers were above last year in 4 regions of the Nation and below in two regions. Increases were 3 percent in the West North Central and the South Central and 2 percent in the South Atlantic and Western States. Decreases were 6 percent in the East North Central and 3 percent in' ,
the North Atlantic States. These estimates are based on reports fram over 7,l06
beekeepers, including both farm and non-farm apiaries.
Colony losses during last winter and this spring averaged 15 percent of the colonies entering the winter compared with 16 percent a year earlier. Winter and spring losses were 23 percent in the East North Central States, 22 percent in the North Atlantic, 18 percent in West North Central, 12 percent in South Atlantic, 11 percent in the West and 10 percent' in the South Central States. Over 4,300 reports were received on causes of winter and spring losses. Reported causes of losses were 26 percent from starvation, 24 percent winter killing, 19 percent queenless, 4 percent from insects, 3 percent fram foul brood, 2 percent from spray poison, 2 percent fram dYsentery and 20 percent fram other, causes.
The condition of colonies on July 1 was reported at 86 percent compared with
88 percent last year. Condition of colonies was poorest in the West at 83 percent of normal, Which is ,6 points below a year earlier. In the West North Central it
was 2 points below last year and in the North Atlantic region 1 point beloW. Colony conditions were reported the same as last year in the South Central and 1 point a.bove in the East North Central and South Atlantic regions.
The July 1 reported condition of nectar plants was 77 percent compared with 84 percent last year. Nectar flow has been light in many areas of the
Nation. In California hot, dry weather in the late spring and early summer limited the nectar flow. Yield of orange honey was light and qUl.lity below normal. The yield from sage was pa.rticularly disappointing. In the North Atlantic and North Central regions the beekeepers experienced a long, severe winter resulting in hea.vy colony loss. Clover stands in Minnesota were reduced by droughty soil- don-' ditions, but bloom on the remaining acreage was heavy. In Iowa, Michigan, and ' Wisconsin'clover honey fiow to date has been good, and prospects are for a good crop. In Ohio and Indiana. clover bloom was heavy and coincided with a. period 'of favorable weather.
In the South Atlantic States the honey crop was generally good although excessive rainfall reduced the crop in Georgia. The sourwood cFoP in North Carolina was below normal. In Florida. rain and cold weather resulted in a below normal citrus flow. In many areas of ,the South 'Central States the honey flow to date has' been limited because of too much rainy weather early in the season followed by too dry soil conditions 1n.ter on. In Texas a heavy nectar flow was obtained from vetch. In Idaho a light honey flow has started and prospects indicate c favorable season.
(See the reverse side for information by States and regions)
REISSUED THROUGH GEORGIA CROP REPORTING SERVICE -- 'July 31, 1959
"
. ,I., "'"
,'..
"f
., ....
..
"
..'J~'.' .. ; \".: i :' ~. ...
__ ~!P!I!S_O! ~S-'l~_CQ~~I.QN~~!QO!P~~A!D_~d!A!!f~_O! ~Y_1__
State
:
Colonies o~ .bees " .. zCol~n1es : Cond1tion:Condit1on
o.nd
:- -195g -:- -1959 ... -:- -195~ - -: . test :
ot :of nectar
division : :
11:
gJ : 195
:Wij}ter o.nd: colonies :plo.n'l}s
.' ,.
:
:
: spring of: July 1, :July 1,
-
.- .. -
-
...-.
,-
'
-.
,-
:
-T
h-o
u. -sa-n: d-s ~ .l:no.u...sc- .n-ds..;
:
"'_P..e...r-ce-nt-
.
.'
-
: .....,."r.l:eo::?rrt::c:;.;.e8.n_;;t1.:/;,0~~:fED..er-. c10e'rVu:;~t0,.,o_f:"-
n10vorr.::mt;0. a-l,'-
~;f.'
.'~ f Jf .'.~ '; :~(,<. ~\
Vt. . .
11
11
' 100
20"
80 ...' 88.
Mass. ..' , ." , '. ;1.9
R. ' 1'. , ' "
2
18
. 95 ' . '22'"
.83 ' _ 88"
2
100
"30 "
90. . 90 .
Conn.
15
13
87
'31'" 89
83
N. Y.
191
187,
95
23
87
86
N. J.
~a~
,31 ~43.
33 .
J~~3-
107 ,':. . 120_ ~.
!1B5
" 9 4 . "87,,
89
-13i)J;-
oNh. iAo-tl-.
-
-
-' -
-
-
-
<+34 301 -
-
-
-2<+b281 - -
-
-
2.7 89- -
-
.. --
22 24-' -
-
-
Bg8e- -
-
i I ' -,-84
"'-
Ind.
184 ,.; 178
97
',22
91,
90
Ill.
1~3
153
94. ',' 19, 86,, 81
.,Mich.
155
".147 .
9 5 : . 22
69.; 86 .
m--- - - - l~J:..fI"..N7" CeDt7" -
-
-
~ -'
10 6
:::?- ... -
MtD'n7 - - - - - - - -
-
.--921~0~822--- -
"
9984- -
-
-
-
.24, 23- - -
-
g85a- -
-
-
. 81 -84"
-
- -It- - - - - 18- -:- -, - S9- - - - -if -
IoWa'
164
151
92
' ~5
88
" 88'
Mo:' ..
N. D6k.
122
122
100
.28
32
114
11
85 I
62
12
89
'72
S. :J;>ak.
49
59
120
15
75, '!
63
Nebr'.
~s.:.
li-_N.:. g,e!},t.:.
64J3.
!612
97 2.7
112
7J.9
123
18
86
~
~1
-;:,~
76
8~_
7__
Del.
,
3
3
100 '
10
9<+
75 .
Md.'
,
29
30
103
15
95
82.:
Va.. W: Va. "
.. 139
136
98
103
,101
98'
12
~9 ,
71
16,
82
74
N'. C. .' ,
s . C'_ ,....
183 .
2io
115
58
60
104
1 2 , 90
' 75
.7
88
72
E- -'- - - -fi-.- Go.
.
213 '
209
98 '
7 , . 89
74
R~~Y~7t-l:- 7-"'---,-
-~
--
-. .
--
I ~~
-'llS"
-
-
-
-
--l~J~.~I8~-
-
-
-i~-
-100-
~
-
-
-
-
-
-
-
15-
-
-
-
~-
g3-
-
-~'-
:- -
-7~-
Tenn.
155
167
loB
14
87
81
Ala..
191
185
. 97
7
59
80
Miss. . ;, ,
73
78
107
7 , 93
80
Ark.
'.
'. 88
89
101
1 3 . . . 87 . '83
La.' ,
88
92
105
6
90
81
Okla.
'
. 46
4 3 , 93
.' 14..
85 . 81
~~~~nt.- - - - - - I ~~ - - ~y-~l}- - - -i~- - - - -,IS- - - - ~- -.- - .-:-~~-
Mont7 - -"7 - - - - -'-"g - - - ~ g2- ,- -'-105- - - - - -9-.- - - g5- - -,- -85"-
Idaho
186
2 0 1 ' 108
1 . 2 ' 91 '
87
Wyo. Colo.
.
37
" .. ' 6 7
37
100
68
101
. 14
91, <
79
'8
82"
69
N. Mex.
11
11 . .,.100 " ;.11:" 82 "
74
Ariz.
95 . 91
'96
"11'
81
74
Utah
54
54
100
20
83
68
Nev.
9
9
100
6
87
76
Wash.
97
100
103
14
83
83
-- - - - - Ii- - - - - - - - Oreg.
53
~- ~_!_'-~ - - - - - -~ 1,~*
55
104
-14~~- - - -i~-
14
93
86
~- -~1_
u. S.
5,420
5,437
100
15
86
77
--~--------------------~-----------~-----
y. Revised.
y Prel1m1no.ry .
YPercent of colonies entering winter, as reported
..
- -----_.
--
CGIEJ)~(GllA <C~(oI? ~IEJP>(Q)IRr1rllNCG 5)[~VllCJE
AGR Ic:ULT!JRAL E.X:TENSION $~,R.v..I~~,
UNIVER~ITY OF :GEO,RGtA AND THE
J
0' $TATE DEPA~TMENT AGRICULTURE
j Athens, Georgia
...: . y. S. Q'r:~RTME",,:r OF, AG~ICt,I~!,IJR~ ..
~GRICULTURAL MARKETING SERVtcE 31e EXTENSION BLDG., .ATI'IENS. G:A.
July 1959
CORN': ACREAGE PLANTED '~JITH HYBR'rns., INCREASES IN 1959
GEORGIA: The acreage of corn planted with hybrid seed in Georgia this year
is estimated at 2,443,000 acres according to the Georgia Crop Reporting Service. This is an increase of 175,000 acres from last year and is
the largest acreage ever planted with hybrid seed in the state.
The proportion of corn acreage planted with hybrid seed dropped from 83.0
percent'in 1958 to 82.5 percent in 1959. Prior to the current year, both the acreage an~ percent planted with hybrid seed had increased steadily since 1941 when the first estimat~ was made. In that year .7 percent or 28,000 acres was
planted with hybrid seed.
UNITED STATES I Corn acreage planted with hybrid seed increased sharply
this year in line with the increase in all corn acreage.
Hybrids were planted on 81 million acres compared with 70 million last year and 68 million in 1957. The percentage of total corn acres planted with hybrids edged upward to 94.8 percent compared with 94.0 percent last year.
The commercial co~n section$ in all. areas of the country have been planting
nearly all'acreage with hybridQ for some years. About the only opportunity for further exp~sion in percentage hybrids is in the relatively minor producing areas of t~e Southeastern States, the Rocky Mountain States and western Dakotas where the pybrid fract~on ranges Qelow four-fifths. The more important producing Coastal areas of the Southeastern States; eastern Dakotas End most irrigat~on . sections of the Rocky Mountain States are' planting mostly hybrids.
Percent
PERCENT .OF CORN ACREAGE PLANTED WITH HYBRID SEED
Percent
100
TATES
75
- "".- ~ - ' - --_.~-----
... ~
. .... ;,..,, .
100 ... 7
- ---
. 75
50
50
25
25
1947 1948 1949 1950 1951 1952 1953 1954 1955 1956 1957 1958 1959
UNIVERSITY OF GEORGIA
,JUL 18 '59
LIBRARIES
'..
:.1 ':.: " ::.....;( ~: ;i' .~... ,. /. r.~.,. ~':: :';:1f .'i1 1'''i.~~:: ':}~~I' " 'i.
- 2-
CORN ACREAGE PLANTED WITH HIBRID SEED, 1941 - 59
'.: ..' :Percentage .: ~ndicat:ed-::-. : ::, . ,:PerQentage.: Indicate<l
, :AA Corn: Planted: :Hybrid Corn:: . . . :All. Corn': _Planted : Hybrid Corn Year :A:creage: With : Acre8ie : :Year :Acre~e: Witt! ,,: Acreage
: (000) :Hybrid:Seed: (000)::
: (OOQ).:Hybrid Seed: (000)
ARCHIE LANGLEY Agric~tural Stat~stician In Charge
CARL O. DOESCHER Agricultural Statistician
.~ .
_I
.
~:. 'I.
...... ., ~. ~! ~ :".~.
--.:;:-=-
-..... ._, -------.----- - - -
. . --,;'~1
~ ,,~i'f\.
"'~"'"':.,.,'"
i; /-:' .,I I~,
:.
'r'"
,.
;.
,
....~....~ ..
.. ~.
II I'~ <i.J.'..'
' .... ... "'- . ~l r. , ", '.,
~,II
;,.,.:..,1''~.~';"..";..~,~\x--'_ ',t "1.,)1\-\\,.'~o"t'\..,.~.~'r-''~.,,.I:,1
\ r!";': l~ /.
,
t
"'V;~
,.It. \'
'of' I ',h' .. ... 1'\
I
w
,lG:~._> _ ":w"-''", \l( t,:"" . . ; ,~;;:
~..:.10It \1
.
",\ ,,:,-. '(:~IJ .-"
~ A':.~~ Al.j...., .....
3/S
GEORGIA CROP REPORTING SERVICE
\YEEJ<LrY J r ' \/ J \ C' 1 ( FGiO!?bl"
I
C r t R r)-\ - ::)\JG (,'59I
I
r;
u Released: 8/5/59
..
GEORGIA. CHICK HATCHER Y REPORT
, Athens, Ga., August 5 -- A total of 6.033,000 broiler chicks were placed with producers' in Georgia during the week ending August I, according to the
Georgia Crop Reporting Service. This compared with the 6,2.98,000 .placed the p'~eviou~ week and is 3 percent less than the 6, 193,000 placed the same week ~ast year.
. Eggs set by Georgia hatcheries amounted to 7, 771,000 compared with 8; 2.31, 000 the previous week and is 6 percent less than the 8, 302., 000 for the
corresponding week last year.
The majority of the prices paid for'Georgia produceu-n"3:tching eggs were
reported within a range of 45 to 55 cents with' an average of 52. cents for all hatch-
ing eggs and 50 cents for eggs purchased at the farm from flocks with hatchery
owned cockerels. Last week the range was from 45 to 55 cents with an average
of 53 cents for all hatching eggs and 53 cents for, eggs purchased at the farm
from flocks with hat~hery owned cockerels. Most prices charged for chicks
were reported ,within a range of $7.00 to $9.00 with an average of $8.00 per: hun-
dred compared with a range of $7.00 to $9.2.5 with an average of $8.25 per hun-
dred last week. The average prices last year were 72. ce:otQ for eggs alld $~ 1. 50
for chicks. ,
.
.
Weighteq average price from the Federai~Sta~'Marke~ News S~r~ice for
broilers during the week ending August 1 ,was :Geo'tgia~'broilersi '3/4 - ,3. 3/4
pounds at farms 15. 15~.
,
GEORGIA EGGS SET. HATCHINGS. AND CHICK PLACEME NTS
.
''
BROILER TYPE
~
.. ~ .,
. ,;,. . .' .
. .
. . EGG TYPE
Week Ending
:
I Eggs Set !!
1958
1959 1959 0/0 of 1958
Chicks Placed for B~oilers in GeorR;i,a
1958
't-959
1959 Ufo of 1958
Eggs Chicks Set Hatched
1959 1959
;
;
May 30, June 6 June 13 June 2.0 Jime 27 July 4 July 11 July 18 July 2.5 Aug. 1
Thou.
9,668 9,616 9,360 9.082. 8,658 8,741 8,771 8, 560 8,2.54 8, 302.
Thou.
'9.2.36 9,2.76 9,312. 9,2.10 9,2.10 9,073 8,741 8,337 8. 2.31 7,771
Percent Thou.
96 7, 151 96 7. 111 99 7,063 101 7, 153 106 6,878 104 6,724 100 6,869 97 6,340 100 6,32.9 94 6, 193
Thou. Percent Thou. Thou.
6,951
97 ' , 2.39 . 184
7,002.
98' . .' 245 i69
6,961 __ 99-
165 179
6,807
95
l18 166
~, 92.2. ' 10l.. . , ~ 81
190
6. 7'16 , " 101
6, 573
96
: 1842.i 97
96_ 191
6,554
103
103
61
6,2.98
100
131 138
. 6,033
97
143
72
r/1/ Includes eggs set by hatcheries producing chicks for hatchery supply flocks. Revised.
ARCHIE LANGLEY Agricultural Statistician In Charge
W. A. WAGNER Agricultural Statistician
-u-. -S.._D-e-p--ar-t-m--e-n-t -o.f-A--g-r-i-c-u-lt-u-r-e----------------A--g-r.i_cu--lt-u-r-a-l-E-x--te-n-s-i-o-n--S-e-r-v-ic-e--
Agricultural Marketing Service
State Department of Agriculture
319 Extension Building, Athens, Georgia
--------------------------------------------------------------------.----
- GCS SET AND C
STATE
"" I
July
18
...,. .',
, ' July
25
Week Ending
!
Aug.
1
June
27
I
EGGS SET - THOUSANDS, -
,I
.
July
4
July
11
July
18
July
25'
CHICKS PLACED - THOUSANDS
Aug.
1
.
"
Maine Connecticu.t
1, 512 989
1,409 958
1,412 1,032
1, Z63' 1, 186
568
620
1,222 '1,202
551
607
1,212 629
1, 160 638
Pennsylvania Indiana
1, 163 1,798
1,349 1,753
1,256 1,811
,
735
814
719
833
707
718
862'
778
854
825
878
797
Illinois
233
196
224
136
99
106
129
108
111
Missouri
1,892 1,902 1,795
799
818
754
908
865
845
Delaware
1,585 1,483 1,590
1,694 1,722 1,778 1, 591 1,625 1,550
. f ,",~.,
Maryland
2,978 3,010 2,952
1,963 2,001 1, 894 2,055 2-,. 001 1,898
Virginia
1,940 1,984 1,942
1, 124 1,066
993 1, 117 1, 272 1, 026
West Virginia
301
284
287
529
521
550
-565
515
484
North Carolina
3.. 462 3,447 3, 516
2,926 2,981 2,919 2,930 2,764 2, 576
South Carolina
487
489
454
357.
327
351
366
354
331
GEORGIA
~,337
8,231
7,771
6,922 6,776 6, 573 6, 554 6,298 6,033
Florida
312
234
295
206
2'25
172
160
187
144
Alabama
4,024 3,912 3,948
3,461 3,406 3,394 3,363 3,295 3, 177
Mississippi
2,939 3', 001 2,887
2, 256 ' 2,464' 2,370 2,292 2,214 2, 132
Arkansas
3,829 3,756 3,825
3,231 3, 580 3, 525 3,483 3, 597 3,358
Louisiana
662
' 685
664
487
449
386
354
423
363
Texas
2,915 2,907 2,783
2,367 2,250 2,301 2, 157 2, 142: 2,250
Washingtol\
379
405
310
341
332
306
351
303
287
Oregon
329
325
317
262
243
238
203
237
213
California
1,4-16
1,331
1, 355
1, 108' 1,015 1,021
945 1,045
872
TOTAL 1959 TOTAL 1958 1959 0/.; of 1958
43,488 46, 546
93
43,051 45, 166
95
42,426 43,809
97
33,597 33,673 32,977 32,990 32,671 30,963 36,237 35,436 34,912 33,846 3.3,378 32,440
93
95
94
97
98
95
GEOJR<GllA (CJRCOJPJ
AGAICULTURAL EXTbe',ON SERVICE '
UNIVERSITV OF GEORGIA AND THE
STATE DEPARTMEN"t OF AG,UC:ULTUAa
Athens, Georgi~'.," ,:
..
.,: ,F~ PRICE REPORT AS OF JULy 15, 1959
, .GEORGIA: The All Commodity Index of Prices'Received by Georgia tarmers
declined t~e points to ~52'}')ercent'ot its 1910-1914 average dma-,
ing the month ended JU],y 15, 1959. ,Lower p,r.ices tor cotton, cattle, and hogs'
were primari~ responsible for the 'decll~e in the Index. Partially offsetting
were higher prices for peaches, eggs,' and tobacco. "At mid-July, the Index was
11 points' (4 percent) below a year earlier. "
"
The mid-July price received by f,armers for cattle, calves, and hogs de-
clined sharply from the previous month. The mi,d-July 1>rice of $14.10 a hundred-
we;l.ght tor hogs was the lowest mid-month average since April 1956 when. the! .'
average price was $14.00 a hundredweight., The average price ot $19.30 and., .
$25.10 a hundredweight received tor beef cattle and calves, respectively, vas'"
below all preceding months in 1 9 5 9 . "
,
,mUTED .sTATEs: During the month ended July 15 the Index of Prices Re-
ceived by Farmers dropped 1 percent (2 points) to 240 per-
cent of its 1910-14 average. Primarily responSible for the decline were lower prices for hogs, potatoes, oranges, beef'cattle, and watermelons. Par~ tially offsetting were higher prices for eggs,':cot'ton; and milk. The mid-July
index was 4 percent below a year earlier and the lowest since December 1951.
'!'he Parity Ratio' held. unchanged from a month earlier' at 81. perce~t,under a year earlier.
.
Summary Table for Georgia and the United States
This was 5
u
Index
;
-:
JU1.Y 15:
June 15 :
1910-14 ,~lOO: 1958 :.. 1959 :
UNITED STATES :
:
:
JUly 15: 1959 : :
240' ,
Recor-aH1~7
Index: nate: '
i
,
1
GEORGIA
..
..
Priees Received:
All Commod1ties All Cro'Ps :
26~:
272:
255: 275 -:
252 .- -2
Livestock and :
Products
: 241:
211:
205:
295 :Se
1/ Prices Paid, Interest, Taxes, and Wage Rates based on data for the
dates. gj Also May 1959. ~ Also April 1951.
ARCHIE LANGIEY Agricultural Statistician In Charge
'.
. RAYMOND R. HANCOCK 'Agricultural Statistician
"
,',
.,
. PRI~S REcEIVED BY rA1lUll:RS JULYi:l'~'~' 1959 wrm COMPlJUSCNS
'J 'J) _......
, _ : - _.
,.,_.._,__
, - { ' --'--:'-C~..----.
---
---_.
'f' )
CCM.4:0DITY AND UNIT
" 'r
Average
~ .
or'
,.
l ' ,GEORGIA __..
'
" _._ ,..:..~!~. aUTED ~S " j' ,
I
I
July 15 June 15 ' July 15 Average July 15 June 151 July 15
1910-14 1958 1959
1959
1910-14 1958
1959 1 59
Wheat, bu.
$ 1.23
1.90 1.77
1.74
0684 1.54
1.59 1.70
Oats, bu. Corn, bu.
~,
$
$
Barley, bu.
$
.57
.81
I .91
1.54
1.10
.65 1.34 '1.05"
: 1..6~29
1.00 I
.399 " .642
.519
.575 1.18
.923
.511 1.16
.882
610 1 . 13
895
Sorgh\D1l Grain, cwt. $
2.25 2.10
2.05
_
1.82
1.85 1.78
Cotton, lb. Cottonseed, ton Soybeans, bu. Peanuts', 1b
12.1
$ 23.65
$
_
5.2
32.0 _
2.30 _
34.5 _ 2.15, _
33.5
12.4
.t
_
22.55
I - 2.10
I _
4.8
30.77 45.00
2.11 -
31.48 _. 2 . 0 9
11.7
34. 05 42. 00
2. 05 -
Sweetpotatoes, cwt. $
.84
5.45
_
Lespedeza. Seed,All ,owt$
_
_
5.00 ", _
1.50 " 5.85
_
_
4049 _
6.10 _
Hay, baled, per tonI
All
$,
Alfalfa.
$
Lespedeza
$
Soybean & Cowpea. $
Peanut
$
27 .60 25.60
35.8034.00
28 .80 27 .50 30.00 29.00 22.00 23.00
27 .00
34.50
29.50 30.50 24.00
_
17 .10
17.90 18.40
_
17.10
1804019. 00
.:..
21.00
20.30 20.80
_
28.40
26~60 '26.70
_
20.80
19.80 20.10
Wool, lb. Milk Cows, head Hogs, ewt.
39.0 45.0
$ 33.85 150.00 175.00
$ 7.36 21.80 15.50
46.0,
I 170.00
I 14.10
18.3
_
7.27
38.0
212~00
21.70
42.9 44.1 237.00 23S. 00
15.00 13.30
Beef Cattle, owt. $ 3.96 18.40 20.90
19.30
5.42 22.20
23.60 23.10
Calves, cwt.
$
23.00 26.60
25.10 . '6.75 25.20
28.50 28.10
Milk, Wholesale, cwt.:
Fluid Mkt.
$
Manu!.
$
All
$
_ _ 2.43
5061 5.85
3.27 3.15 !/5.n !/S.75
Turkeys, lb.
28.0 25.0
Chiokens, per lb.:
Fam Com'l Broil.
All
13.3
16.5 18.2
18.2
13.5 15.0
15.0
Eggs, J.U1, doz.
21.4
50.8
!I Revised. 51 Pre1 iminary EstElate.
37.2 I
_
II
~2 / 5.75
,
I
23.0'
13.5 lS.0 lS.0,
40.5:
, .1
.,
_
4040
4.15
_
3.05
3.02'
1.60 I 1!l3' .85 /3.70 513. 88
14.4 I 24.5 "22.S 22.4
I
: '.
_ II 15.2
_
19.3
10.1 15.8
10.8 16.1
11.4
18.7
I 21.5
36.8
I
11S.1 I 24.9
I
I
15.4
I 30.2
PRICES PAID BY FAlM:RS FOR SElECTED PEEDS JULy 15~ 1959 vTiTiI .COMPllRISCNS
.-
KlND OF lEED
MiBed Dairy Feed
.All Under 29% Protein
16% Protein 18% Protein 2~ Protein 24% Protein
H~h Protein reeds
to-tonseed Meal (41%) Soybean Meal (44%)
Meat Scrap
~
July 15
I 1958
, GEORGIA
I June 15 1959
I
I
m ITED STATE S
I I July"j July lS
- 1959 I
1958
Ii
June 15 July 15
1959
1959
3.95
3.90 4.10 4.10 4.45
3.90
3.80 4.00 4.05 4.25
Dollars Per 00 Pounds
;1
3.90 i I 3.69
I 3.80 j'
4.00 I
II 4.10
4.25 I I
3.63 3.61 3.96 4.CJ7
3.70 ' 3.65'
3.61 3.89 3.crt
3.67 3.63 3.57 3.90 3.94
I I I II I I 4.05 4.05
4.05 4.05
4.05 4.10
4.01 4047
4.18 4.15
4.20 4.26
Grain Br-Produots Bran Middlings Corn Meal
Poultry reed Bro ller Growing Mesh Laying Mash Scratch Grains
fHaH:1ed)
.All other
3.25 3.50 3.50
5.20 4.90 4.40
3.30 3.60 3.35
4.90 4.75 4.20
3.25
2.74
3.55
2.94
.- 3.30
3.38
4.85 4.75 4.20
I 5.08
I 4.56 4.01
I I I 45.00 40.00
44.00 !
31.00
J
I
45.00 33.00
II
I:
27 .80 27.30
2.85 2.96 3.24
2.77 2.93 3.25
4.87 4.45 3.93
4.85 4047 3.93
I 28.10
26.10
28.40 26.10
<GJEo)~CGllA (C~(Q)JP> ~llE~JP>O llNCG SJE~Vll(cJE
AGRICULTURAL EXTENSION SERVICE UNIVERSITY OF GEORGIA AND THE
,AUG 1 2'59
- .. . l \ , . . .'
U. S. D~PART.MENTOF AGRICULTURK AGRICULTURAL MARKETING SERVICE
STATE DEPARTMENT OF AGRICULTURE
LIBRARIES
lit EXTENSION BLDG., ATH~NS, GA.
A'th. ens,.Ge..org1a ,
,_
' ,l August 10'J 1959
, GEORGIA .,;" AUGUST 1 CorrON REPORT ..
~: " I
-\
:
"..
-
~~rg:ie.1 s 1959 ,c'otto~' c~~p' '18 ,: :f.or~cast-, 'at 585,.0~~' ba~~ based' on infonl1.8r
tion repor~e.d by crop, resl'ondents 'as: of August 1" the Ge'orgia" Crop ReporliIltf .,.
Service said today.' This is 233~oo.o bales, or66 percentjCmorethan last year's
small crop of 352,000 bales, but is 11 percent below the state's 1948-57
average crop of 655,000 bales.
_.
._.'
....
__ . , . . . . , " ' : "
",
.. J'
,
M;
.. ' . . ~
,"
';.,
"
.. -
., I'
. }'resent prospectE? on,Georgia faI'!!lS-p01nt to a yield Qf.,4Z5. p,oUIida per acre
vh1:ch 1s .exceeded by only, the "record hlgh .1958, yield of 443 pounds per acre.
Farmers ~re ,expected to harvest 660,000 acres of cotton this year, an i~crease
"of' ~-79,QOO, acres from' the '-record low of '38~;000 'acres h8.'rvested on Georgia farms
last year.
.
IS:-
Final out~urn,of the crop comp~ed with this forecast will depend upon whether the'yar10us factors, affecting the cr,op' during,the remainder of the
season are more or less favorable than normal
. WILLIAM ,E. KIBLER
Agricu1turai Statistician
ARCHIE LANGLEY
Agri~u1tura1 Statistician ~ Charge
,\
GEORGIA MAP - SHOWING AUGUST 1 CQNDITIO~ BY CROP REPORTING DISTRICTS
z I.
111999555198---78,6.r6(1ff~0o
\\~. '"
Nbn
..
- , co.t.,'tI~
...
I
...
II~ ..~ ...
I
....
STATE: 1959 - 81~ . '. ".. \
1958 - 1')1J
1957 - 18t:fp
.
....
pistrie,ts. shown are crop' -
reportihg d~stricts and-NOT
.G~ngre~sJ,onal Pi6tr1ct6.. ~\ "
'.... I'"
1959-80'f0
1958-8~
1957-78%
VII
ALBANY
1959-8~
1958-7810 1957-8010
VIII
1959-78% 1958-76%
1957-7810
VALDOSTA:
SAVANN~sf
IX
;;;
11995598-8-38%~
fY: -,
See
1957-68% J( reverse side
d'~
for
r~
UNITED STATES
Information
,',
.. r~. .",
I. '
,:
. UNI~D' STATES - .',CO'I'l'ON REPORT AS OF AUGUS~ '1,' '1959~,'~ ':' "
't.
I'.
The Crop Reporting Board of the Agricultural Marketing Servi~e makes the
following report from data furnished~by ~rop correspondents, field statisticians,
Bureau of the Census, Commodity Stabilization Service, and cooperating State
agencies. The final outturn of. cotton compared with this forecast will depend
upon whether the variol.\S in:t'luences affecting the crop during the remainder of
the season are more or 'less favorable than usual.
---:
V - - -_-!:.c::..e!i~-_-_-_-_-l.- -ant Yield per - -:- - - Prod~ction-
State:_ ~rye!t~d__: For :_ ~!~d_a~r~ __:2.00-!b.:.. !r2s! !!elg~t_b!:~s_
:19~8-57: 1958 :ha.rvest :1948-: 1958 : .1959 :19~-57: 1958 : 19~9
:average:
: 1959 :57 av:
: ~ndic. :average :
': indic.
- - - -:-1;000- -1;000- 1,000 - - - - - - - - - - - - -1;000- - -1;000- - 1,000-
acres acres acres Pounds Pounds Pounds bales bales bales
N. c. : 623
263
395 324 466
S. C. .: 939, 352
565 310 406
Ga. .: 1,144
381
660 284 443
Tenn. .: 717
400, 515 392 501
Ala : 1;345
530
815 312 398
Miss. .: 2,116 1,125 1,440 396 409
419
419
256
345
370
598 299
435,
425
655
352
585
522
572
419
560
418
844
439
710
505 1,710 961 1,515
Mo. .: 470
295
400 396 446
Ark. . : 1,826 1,015 1,295 386 436
la . : 764
364
495 396 392
Okla. : 982
410
600 184 365
Texas .: 8,460 5,395 6,300 232 383
558
386
275
524 1,429 925
465
624 297
316
367 313
362 3,956 4,308
465 '1,415
480
395 4,750
N.Mex. : 234
176
198 582 820
800
275 301
330
Ariz. .: 436
377
380 831 931 1,011
740
734
800
Calif.
943
732
875 748 1,049 1,086 1,424 1,604
1,980
Other
States
gj
78
34
58 304 403
413
48
29
50
U. S : 21,076 11,849 14,991 329 466
4..,4 14,046 11,512 14,815
.~----------------------------------------
Amer.
E~t. ~ 57.3 76.2 66.4 435 525
519 49.7 83.6
71.8
Y Production ginned and to be ginned. A 500-pound bale contains about 480 net
pounds of lint.
.
'JJ~ Virginia, Florida, Illinois, Kentucky, and Nevada. Included in State and United States totals. Grown in Texas, New Mexico,
Arizona, and California.
CROP REPORTING BOARD
.,
."3
~
~
. ,~ ~
... ".~
"'"
'","'-
.~
)
(
--li.-ItAfl, _. :'\
-~,
I~,
:t
1''' ,
-" ~:",,~
.lo.. :
i ,.' '.
':\i""t'.
~Cli
~_'\.',
.,.
t, ( " I, .1.
~.'~,l
I I f \ ,I,
I
I. I
~
II,'t1!. .;!J"
'i.:I-~-'ql~''\\~'v'"',\,,-~\...~.\.~..,."r/~'_ "\.~'.;.~.4\~
..... ... :'~,:.,:::'," (oj~.{~I\, ,., ~~,~::~\\{''"'~'''~'
E. , .
'" \.1. C ~'<,:'\, ,
(.
GEORGIA C:ROP REPORTING SERVICE
I~-
\;VEE'LJ.<J;L-rY( ." ,I
-
J ' . "'-.' Jtr
.
r~"J~' \t,~,
..:.--J
:
fllJG 1 3 '59
I
Relea-sed: 8/1Z159.. ,, r
UBRARIES
GE'ORGlA CHICK HATCHER Y REPORT
" Athens, qa." August lZ -- A total of 5.807.000 broiler chicks were placed
witl) pr~ducers, in Georgia during the week ending August 8. according to the
Gedrgi~ Crop Reporting Service. This compares with the 6.033,000 placed the
previous week 'and is 3 percent less than the 5,969. 000 place~ the same week
last year.
'
~ggs set by Georgia hatcheries amounted to 7,419,000 compared with
7,171, 000 th~ previous week and is 7 percent less than the 8,010,000 for the
corresponding week la,lt, year.
..
.
.
The m~jority of the prices paid for Ge~rgia produced hatchi~g eggs were
reported within a ;range of 45 to 55 cents with an average of 51 cents for all hatcb
ing egg8. anq. ~9 cents fo.r ~gRs pur,ch~~,ed ,at .tt~e farm from ~ock~ with, ~~tch~ry :
owned eocker.el8. Last week the range"was from 45 to 55 cents with an average',
of 5Z cents for all hatching eggs and 50 cents for eggs purchased at the farm '
from flocks with hatchery owned cockerels. Most prices charged for chicks wer~
reported within a range of $7. 00 t~ $9.00 with an average of $7.75 per hundred
compared with a range of $7. 00 to $,9. 00 with an average of $8.00 per hundred
last week. The average prices last year were 70 cents for eggs and $11.00
for chicks.
-
Weighted average price from the Federal-State Market News Service for
broiler.s during the week ending August 8 was Georgia broilers Z 3/4 - 3 3/4 poUJlds ;at farms 14. 61~. -
".,
'
4
GEORGIA EGGS SET, HATCHINGS. AND CHICK PLACEMENTS
"
Week En4ing
June .6 June 13
Jun,e ZO June Z7
July 4
Jwy n
July 18
July Z5
Aug. 1 Aug. 8
BROILER TYPE
EGG TYPE
- Eggs Set 1/
.'
1958
Thou. 9,616 9,360 9.082 8.658 8',741 8,771 8,560
8, Z54 8.30Z
8,010
1959
Thou. 9,276
9.31Z
-9.Zl0
9,Z10
9,073 8.741 8.337 8, Z31 7.771 1,419
1959 0/0 of 1958
Percent 96 99 101
- 106
104
100 97 100
94 93
Chicks Placed for Broilers in Georgia
1958
Thou. 7. III 7,063 7, 153 6.878 6,724 6.869 6,340 6,329 6, 193 5.969
1959
T ou.
7.00Z
6.961 6.807
6.9ZZ
6.776 6,573 6, 554
6.398 6,033 5.807
1959 %
of 1958
Percent 98 '
99 95 101 101
96 103
100 97 97
Eggs Chick. Set Hatched
1959 1959
Thou. Thou.
Z45 169 !
165 '179
Z18 166
81 190
184
97
96 191
165Y 61
131 138
143
7Z
ZIZ 124
1/ Includes eggs set by hatcheries producing chicks for hatchery supply flocks.
r/ Revised.
ARCHIE LANGLEY Agricultural Statistician In Charge
W. A. WAGNER Agricultural Statistician
-u..
. ------._--------------------------------------------------------------
S. Department of Agriculture
Agricultural Extension Service
Agricultural Marketing Service
State Department of Agriculture
319 Extension Building, Athens. Georgia
._---------------------------------------------------------_._--------_.-
STATE
EGGS SET AND CHICKS PLACED IN COMMERCIAL AREAS: BY W
..
.""
,
.
..
Week Ending
July.
. Aug.
,
' Aug.
July July July July Aug. Aug. ,
2.5
.1
8
4
11
18
25
1
8
EGpS SET .. THOU.SANDS
CHICKS PLA<;ED' - THOUSANDS ,
I
Maine
Connecticut
Pennsylvania
Indiana
Illinois
Missouri
Delaware
Maryland
Virginia
We st Virginia
North ;aro1ina
South Carolina
GEORGIA
Florida
. Alabama
Mississippi
Arkansas Louisiana
"
Texas
WashingtonOregon
California
I, 4.09 958
1,349 1,753
196 1,902 1,483 3,010 1,984
284 3,447
489 8,231
234 3,912 3,001 3,756
685 2,907
405 325 .
I, 331
L 412
1,032 1,256 1, 811
224 I, 795 1,590 2,952 1,942
287 3, 516
454 7,771
295 3,948 2,887
3,825 664
2,783
310 317 1,355
1,334 921
'. 1, 173
1,604 145
1,776 1,550 2,900 1,907
314 3,323
463 7,419
324 3,769 2,752 3,666
599 2,706
370 313 I, 211
I, 186 620 814 778
99 818 1,722 2,OO} 1,066 521 2,981 327 6,776
225 3,406 2,464 3, 580
449 2,250
332 202* 1,015
1,222 551 719 854 106 754
1,778 1,894
993 550 2,919 351 6, 573
172 3,394 2,370
3,525 386
2,301
306 238 1,021
I, 202 607 833 825 129 908
I, 591 2,055 I, 117
565 2,930
366 6, 554
160 3,363 2,292 3,483
354 2, 157
351 203 945
I, 212 629 707 878 108 865
1,625 2,001 1,272
5i5 2,764
354 6,298
187 3,295 2,214
3, 597 423
2, 142
303 237 1,045
I, 160 638 718 797 . 111
845 I, .550 I, 898 1, 026
484 2, 576
331 6,033
144 3, 177 2, 132 3,358
363 2,250
287 213 872
I, 163 487 673 736 130 857
1,573 2,033 1, 116
445 2,551
348 5,807
158 3,098 2,045 3,287
374 2,014
335 165
959
TOTAL 1959
TOTAL 1958
.
)
1959 % of 1958
~
*ReJrised... _
. 43,051
42,
..
4.26
45, 166 43,809
.....
-
95
.
.
.,
97
40, 539 .42,407
96'
33,632* 32,977 32,990 32, 671 30,963 30,354
.35,436 34,912 33,846 33,378 32,440 32,003
95
94
97
98
95
95
"
.'
f
IS"
._~
.GEOIGBAJC.ROlP'. .
'.Jm. .lEJPO.lmI.RNG
.SJEJR{VRC!.
.
I.
oN. ......
,.
-AUGIRtJfcu~L.,".I'TiYu.ROAFL;GE.~OTRGIA'AND
VIl.._ .."",.,, THE : .'
T
~ ' V~S. HPARt.NT 'CW:AGRICULTUR,
, '.l:.
. AGRICULTURAL MARK.TING Sl:lAVICi
"\~' "",1'.:DEf!iAltT. .NT CW AfIltICUL.TUR, '" . '<~ ' . J ;
'. '.It EXT ION BLDG.;, ATHENS. GA
~ '.:'._'~....... .~, ..... -
...,
'J'.y .. " " - ' ':.' , : . : ; ' ,
, ... " ,
-~ " . ' .
'A~t U;. l959' ..~ .. '
,
,-.: .
.... "
VE"GET4.BLE .CROP ~REPORT' F,OR AUGUST'. i, 1959
;
J~~(.'"
'-it.
O '
" ~ BEANS: Production ot 1~ beans in tije !ummer group of, States f.s~ '!l;o.~ ;'.! , .'~ '. ::; ~I~
'.
e~t1mateq .at ~09,000 cwt, 15 'percent lesll than 1958 and,)3, P.8.r,c,e..n.t ,<:..:/ ,
.bel~ aVerage. Expected yields are close to average, but tresh ;IIlarket..~c!.~~~ ~ '..." ~
h~s declined in recent year.. Wet July weather on Long Island and dry cq~,;t;Q11:S." '.:
in Ups~ate Helf York wer.e rather unt~vorable, but a lIati.factory :crop' i.~ .s~.lJ::.1.,r.t.J.5..)
.pr~spec,:Lt.... Har.y.est, is..underway-OR. Long ls~andf . Peak movement, f~ -New .~~r~~ ..i~/;!.~
'.e~i.C.t..tidtba .. week .of...August.17,..with huvest extending -into Sept;eiDber.~. ,~ve-~
moisture caused some loss from mold.. ~a1ns af'te:r ~uly 10 were beneficial in
<' Maryland and average yields are' indicated'.. HarvEist"is well underway'. in North . .
~.aroliQll~ with some production expected into October. A better than aver~"':'crop ~ in pr9Bpect:. Growing oonditions in Georgia have b~en variable. In-'the ettiit~~:.
:areas some fields quit producing beoause of dry weather, and in other moeas' ~8ec'ts ~d diseases were prevalent. Many near normal yields are being harvested. . 'Thei", ~.~.t '
West"Centra1 airtlas should furnish supplies through August and part of Septembe~. '. .\:
".'
' I , ,..
: : . " . ' . c ~ " _
SNAP B~SI The 8UD111e1:' Stat~s are harves't~ a 1,S13,OOO cwt. crop of' '8nap:'b~'W.t-.:;
" ~.
this season--4 percent above 1958 production and 1 percent above' '''''','
average.. The Virginia ~rop is later than nomal. August V01U11le will be' largeir" ",' ; .
than usual. In North Carolina, growing oonditions improved mater-ial1Y' during':" ~.:_<.
July. Dry weather hurt early fields in the Hendereon"ri.lle area. Very good- y.fEr~QS: .
ar~ indicated for late maturing fields. In'Oeorgia; light harvesting' is expe~t-~~ ~.
from late plantings until frost. Excessive' rains during peak harvest- reduced oi..l~l..,~ .:
production on early fi.elds. Snap beans developed well in Tennessee dllringJt4r:~;t: '.'
and harvest is. past the peak. Some sections of Alabama were too dry for'belt ,,' ,. ,
,growth during the past month, but a satisf!c~or.Y:. yie1q, i. in~~ated. . Hea"T yi'elds .
'tahnrdo'uggoOh'dSeqputaemlitbyera, r'.e,'r..ep:ort..'e.d,..-1.r"i.' C. .o'lorad.o'
wh.'e,"re
"m,odd.er' ate"
.
supplies
. ,...... .
should: COntinUE": .-
.
~" ~ ~w_._ w
..
\
~GE.: .PrOdu~tion in the l!1!. summer' state! is now expected to to~. ., . :'.: ;'.' .
.". ~
... 3,570,000 cwt. 7 percent lesll than last year and 10 percent ,below., '
.,verage .i In Pennsylvania, cabbage is in generally good condition but .late fields need rain. Vol:uiiie movement ;1s now underway. Harvest is active in Indiana....
W.eather in the major prOducing area of Illinois has favored good growth. In.;
~~th C~olina, yields have been light on early fields but favorable July.weather
iljtproved prospects for later planting~. VQlume movement is expected by mid .August.'-
a~est . ~ Georgia vas about complete by August 1. Exces.iye moisture in .1ate .' . .
July caused considerable damage in the few fields remaining for harvest. . In .. ." '.
COlorado yields and quality are 80od. ShiIJllents are expected to increase steadily
. ~rough August and peak in S~ptelt1ber~
..... . . . . ..
.".
-. ; . :;.
. . ..... '"
,'(.- '
,
.... l' . ;
WATERMELONS: The tinal forecast for earg~ summer watermelons, at 19,152,000 ewt.,
is 1; percent less than 19 production but 2 percent more than.. .
average. Yields :show little change from 1958 in most States but size. are .':... ' ..
frequently rather small. Acreage was cut rather sharply this year. In North
Carolina, most of tbe eastern commeroial crop has been harvested. July ,weather' '.. ":'
waS favorable, but melons were generally .maller than usual. Harvest in South' .....
Carolina was nearing completion by August 1. ,'Excessive rains followed by hot,: ,,'
d17 wea1!her during the growi~ season resulted in only fair yield-s in marty fiel,ds:.
ffarvest from late fields in Georgia 'is expected to end around inid-AugU'St." ~te ". ,.' .
~~anted fields have produced an excellent yield. Wet weather in J~e foll-owed 1:>1.
otary, hot July oonditions cau.ed many small'mel'Ons in Alabama. In northern' c'ounties
Mississippi harVest started about July20. Peak harvest in southeastern' ~cf ..
cen~ral counties occurred about mid-Ju1l... ~~~..Fodueing ar.eas of Arkansas' were' ,
shipping in volume' about 'A~st'l~' JulY rainS .aided sizing of melons. Harv.e'st
tr~ :the major proc:\ucing area of north oentroal Louisiana will be' ~earing com-.-:"-.":
pletion the first week in August. Melons grew slowly early in the season and many
~re still rather small at maturity. MovBllent in Oklahoma was slow until the
,first week in Augu8t. Most growers will realize a good yield, but insects and
fungi caused some damage. Texas has produced a good quality crop. Earliest areas
in south Texas wound up harvest early in July. Central areas have provided good
movement since early July, and ealt Texas movement started by mid"Ju1y. These
areas are expected to oontinue shipments into August, while northwestern counties
will ship through August.
ARCHIE LANGLEY Agricultural Statistician In Charge
L. H. HARRIS, JR. Vegetable Crop Estimator
L1B/-a'klfS
Acre'!,ge al1(L~tiJnatecl Product.ion: Re~rted to Date, 1959 with Comparisons
i
ffioo~noo
: STATE -
veraget Ind.
1949-57 1958 1959
-Z7ma.. Be~1l~ '~suaaner) - 1,000 Cwt. -
NF york....... 1,540
600
,~SO '1 43
40 40 ,~ 65
24
22
N~w Jersey 1,960 1,300- - 1,400 i 32 '35 . 33 L - 61 46 46
QlUo. ..
580'' - -
--- ~ 36 - , ~ ~- 2,1
M~land........ 1,130
900
800' i 26 ~8 ~ 25. ~ 29
Nprth Carolina. 1,410 1,600 1,~ j 22 30. 25 j '33
"ORPIA. .. .. .. 5,620' , 4, 100 4,SOP i 18 22 , ,18:l 103
i . SnB.D "B"eans b:roup Total... 12,300
9,100
' 8'.850,~ 25, ,27,,' 24 i' 312
"(~wmner)
N. Hampshire... 280
280 J 280: 35 ,40 40 ~ 10
M~sachUsett8.. 1,330
1,400 , 1,500 ~ 35
40 35,' ~ ". 47
-
.-
25 20
48 40
103 81
246 209
, .. ,
I I 11 $6 " 52
Rhode Island... 260
220
220 i 36 '40 40~' 9
9
9
Cpnnecticut.... 1,090
9$0 1,000! 35 . 40 ,40 j' 37 38 40
N~ ~ork, L.I.. 2,880 1,100, 1,300 i 42 . 40 '45 I 117 44 58
N.YOrk, Upstate 10,740 P~nnsylvania.... 2,980
ll,OOO 11,000 ~ 42
2,300. 2,200 j' 43
42 45: 451 462 495
45 45 i,' 128 . 104 99
O~o........... 3,370
3,900
3,800 ~ 40
35' 40 f 133 136 152
IlJ.inois....... 1,270 1,300 1,200: 28 33' 30 i 35' 43 36
~chigan....... 2,530
2,700
2,8oo! 31
31 '33! 77
84
92
Vp-ginia....... N9rth Carolina.
~CROIA~.......
660
75Q
7,400 6,800
2,020 ,1,300
750 ~ ", 30 '35 35 f 20
26
2~
6,500 i, 34' 40 "45! 251 272 292
1,200 i' 28 ' 28 '28' j 56 36 34
T~nnessee...... 1,620
1,400
1,300 ~ 36
45 40 1 58
63
52
A+abama ~.... 1,290 1,200 1,200 j 22 25 25 ~ 28 30 30
Ctl1orado.. 810
700
7OO! 45 50 50'!, 36. 35 35
"Oroup Total... 40330 37,300 36,950 j 37 39 4ft 11,494 1,449 1,513
,:
CabbaCle 11 (Lat~ er)
fennsy1vania.... 4,180 ~~iana........ 2,130
3,600' 1,700
3,200 i 119 ) ' 185 180! UI.1$1 1,500 ! 139 215 200!, 288
666 576 3~ 300
~~n~is
;. 2,700
towa........... 970
2,900 800
2,900 ! 181 750 i 143
205 160
190 170
ri
486 140
595 128
551 128
&prth Carolina. 4,190 - 3,700 '3,600 j 144 160 160 j' 602 592 576
9~ORGIA.
730
600
500 ~ 93 100 110 f 68 60 55
--. ~91~raQ9....... 3,270
2,700
2,200 j 242. 220 230! 796 594 506
~,w Mexico.....
330 '
- - , -:-- ~ 108 -- -- '1'" 36 -
}lashington ~.. 1,530 ' 900 1,000,! 181 210 230 [ 267 189 230
Q~rornia .... ~
~~roup Total...
;.'1 . . .
2,370 22,390
2,700 2, 700'~ 2)2 240 240 i $49 648 648
Ion S 19,600 18,350 1 178
\vYvIQ ~+:. eYme
196 195 1 3,983 3,838 3,570 (Early Swmner)
~orth Caro1.ip.a. 11,160 15,000 '13,500! 50 '60 '55 I 555 900 742
Sputh Carpliha. 41,890 42,000 35,000 ~ 54 ',60 55 \ 2,264 2,S20 1,925
"'ORGJ!l........ 54,000 ~~bama 17,460 ~88issippi.... 11,040
63,000 49,000: 78 85 80 J 4,190 5,355 3,9~0 21,000' 19,000 ~ ,91 ,95 90 j 1,577 1,995 1,710
16,000 ,12,000! 70 -, 65 ", 60 'f 773 1,040 720
A:rkansas....... 10,320 . 13,000, 1l,500! 85 'r85" 90 i ' 874 1,105 1,035
19uisiaQ.a,... 4,430 ,4,200 4,200 [ 77" '80 "75 j' 342 336 315
~lahonia , ~.. 14,520 1l,5OO .9,200 ~ 64 ' 65' 75' ~ 946 748 690
1~xas ~ ~, ~ 109,220 119,000 107,000 1 47 ~'50 ' 50 1 5,096 5,950 5,350
~rizona......... 5,170
7,400" 6,500 ~ 146
95' '. ISo j 757 703 975
galifornia..... 10,480 11,000 ,11,800 ~ 140' 160' 150~, 1,464 1,760 1,770
~
.
II"Group Total 289,690 323,100 278,700! '65
Includes Processing
r'
69" 69 :k~8,836 22,412 19,152
"
:;c~.
..
\
.t . .1
;, ~-;
3/ r-
..- \
~
GJE<OlRCGHA 'ce~(Q)JP> r;.=.?_~'ll"nNG.'SIEIlRVntIE ,
AGRICULTURAL IEXTEN$IO....IERVICE U+l1VE:RSITY'eI' ~eoRGIA AND THE
,
- , S. DEPARTMENT 0'" AGRICULTURE'
I: ,
GRICULTURAL MARKETING SERViCe:' .
ST'ATE DE~A'~TMENT OF AG",ICULTURE
Athetls, .Georgia.' , ..:
.....
GENERAL CROP RE
"G 13'59 11. EXTENSION BLDG., ATHENS; GA'; ,
, diIr" r~': L1BRARIES
. '.
t ..
.t"f't
iF
1, ..'1959'
,
August 12,., ,.'
195. 9
",
" ,-.1
,
'i
"
.' Prio~p.ec,t;s fOr most', c~ops iiftproved.. dUrin's' JU~'.'~~e tp' f.av~a~le"weat'her gdn~ '.
ditions. ' Rainta~l, ~n the form of thundershOwers, was ample: during most weeks. ' ..
which promot~d .,good growth and development. qn p~~ctica;Lly all Georgia crops'., I .', '.
Corn, pean~ts, .tobacco and pastures made verfl.gC)od 1mp:r-ovement during' July. ',Near. '
record 'high)rields are.indicated for most Georgia crops. ,
.., .. '.;' . '.' ,
GOOD CORN ~OP: ~rent .indications point to the sec.ona. largest' corn ct-op' ever produced in Georgia. Corn production in Georgia this year is.
now forecast at 73,200,000 bushels, a decrease 01'.13,552,000 bushels from 18~t'
year's record crop ~t.86i752,ooo bUShels. The yield per acre' ot 25.0 bushels ~11
be the third highest of record, surpassed only by last year's record yield of' .
32.0 bushels and the., 1957 yield of 26.0' bushels. The decrea'sed yield wi 11 offset the 8 percent increa~e in the acreage for harvest estimated at 2,928,000 acres. An unfavorable season ,has contributed largely to the decrease in corn yields.
ABOVE AVERAGE' PEANt1r CROP: The production ot peanuts in Georgia this year is tore,:,
;
cast at 550,000,000 pounds, 10 percent below last .
year's crop bu.t approXimately 10,000,000 pounds above average. The yield per
of acre at l,100.poUnds promises to be the second highest eyEtr produced in Georgia, "
being surpassed only by last year's record high yield 1,190 pounds per acre. ... ' I
Jiarvesting of this year's crop is well underway in southern sections ot' the stat~'" :
';rhe acreage ~or picking and threshing at 500,000, is 3 pe.rcent below last year's
~15,000 acres and 28 percent below average. ", ...'
.
f(.
,
i ..
I
~..
#.'.
TOBACCO PROSPECTS IMPROVE: The tlue-cured tob~.~~o cr9P l.n Ge~rgia, cUrrently . ,
estimated' at 106,500,000. poupdl!l,.1s nearly 19 percnt
larger than ~st' year's crop of 89,610,000 pounds.' Yield per acre is currently
of~stimated at 1,500 pounds, ~h1ch is a small increase over the July 1 estimate , . 1,475 pounds, but slightly below the record high. 9.f 195.8 'yield of 1,5~5 po~s'" :...
Favorable growing c~nd1tions during July iDiproved Yields on .late planted 'fields' ,
1n most areaE!. The increased production tor 195'9 is' 'a~tributedto a larger
acreage as Georgia tarmers harvested 71,000 a~r'es in,19;9 compared w:l:th 58,000 in
1958.
."
,.
.' '
"
#
SMALIER PECAN .CROP: August 1 conditions indicate that, Georgia's. p~~e.n gr.owers ..
will harv:est . Q..crop ot, 35;000,'000' pounds this year, which .
represents a decline of 22"'perqent from.. the revised. estj,mate ot 45,000,000 pounds
produced duripg 1958. This 'year's crop .is 25 million pounds below:.the record .
..
,,7 l11gh production "of 60 million po~ds produced in 1951"aftaabouti percent below
~e 1948... average crop cit 35.4 mi 111on pounds. Prospe cts .in ,centra1. and
northern counties are generally better than those in southern: areas. ' .
~
, ~
t'
. GEORGIA_
_"
.
- - - - - '-f-~ - - - - - - - - - - - - - - - - - - - - - - -~ - - - - - - ------ ~
:ACREAGE,: , ,.
:, "
~,
JROP
, ': (000), :.... YIELD. PER ACRE
: TOTAL PRODUCTION (000) ~
AND
UNIT
1959 . ..
.
1958; Indicated;
Averag~;
1958
.' -'Indi-"
; cated
,~l, .....
,9
WHEAT ~ .bu:: 100
16.7
32.0 23'.0
1959 ': 1948-57 :
Z5~O~' 54,-176
21.0, 2,099
.': . : l!...
~.
66,75273,200 . 1,633' 2,100' '.
OATS bu.: 259 ~IEY bu.: 13 ~YE ~ bu.: 16
28 .0 23 9 .... , 10:0
33.0
32.0' 11,'412
.29. "Q._.... 29.. 0 .... '" ''189',
12.5
12.5
.~ 78
..~.,~...... a,,~~
: '! 290
'377'
162
200
'fAY, ALL tons: 632
.73 1.02
1.00
679
641
636
'lOBACCO,ALL 1bs: 72.1 1,248 1,540 1,498
119,353
91,018 107,985
PalATOES, IRISH. cwt. : 4.1 46
46
53
312
222
215
1:1 11 POTATOES1 SWEET cwt : 10.0
42
48
45
corrON bale8 : 660 Y284
443
425
l!EAWTS(P&T) . 1ba.: 500
866 1,190 1,100
1,137
655 540,052
528
450
352
585
612,850 550,000
SOYBEANS
For beans SORGHUM
bu. : 82
11.1 125
135
536
1,125 1,107
For grain . bu.:
PEACHES
:
gj 581
888
693
~Toltal
Crop Crop
.
bbuu..:~
-
-
-
-
-
-
2,101
4,000 3,200
-
147
98
85
PECANS 1 PASTURE, CONDITION
b~s::
-
76
y y Pounds
1953-57 average
-,
-
91
85
35,370 _
45,000 35,000
_
_
ARCHIE LANGLEY Agr1eultural Statistician In Charge
WILLIAM E. KIBLER AgriCUltural Statistician
UNITED STATES - GENERAL CROP REPORT AS OF AUGUST 1, 1959
Totnlcrop production prospeets edged upward during July to within 3 percent
of last year's outstanding record. Rains in the South Central and Southeastern portions of the Nation boos~ed prospects for fall maturing crops, and la~e july showers. in the Ohio River Valley broke an extended dry period.
Toto.l feed grain tonnage seems likely to nearly equal last year. The record volume of corn from ~he sharply'increased acreage offgets reduced outturns of oats, barley, and sorghums. Corn prospects were down slightly from July 1
as reduced outlook in several,major produc;i.ng Sto.tes overbalancedgenerolly improve~ prospects in southern and ~~stern sections. Winter wheat showed a further decline during J-uly with Yields failing to reach earlier expectations in
most of the Cqrn Belt. A cotton crop 29 percent above lo.st year's small pro-
duction is in prospect with a record Yield on nearly a fourth more acreage. Large soybean and sorghum grain crops now seem likely as Yields prospects are
favorable on the reduced acreage .
CORN: Production of all corn is forecast at nearly 4.2 billion bushels--one percent under the July forecast but 10 percent above t~e previous record last
year. The small change' from last month's forecast resulted from the decline in Yield prospects in Illinois~. Indiana, Nebraska., and South Dakota being lnrgely compensated for by improvedprospects in Iown., Ohio, and Atlantic States. The
Yield per ho.rvested acre of..49.5 bushels is under the record 51. 7 .last year but far above the avero.ge of 40.6 bushels.
PEANUTS: Based on August 1 conditions it is estimated that 1,496,000 acres of
peanuts will be picked and threshed this year, 2 percent below the
1,523,000 acres p1ck~d and threshed lo.st year and 20 percent below average.
Acrea.ge in the Virginia-Co.rolina area. is about the same as lo.st year. In the
Southea.st area., where peanut acreage plo.ced in the Conservation Reserve was rela-
tively heavy, ,acreage is down 3.4 percent. Production of peanuts is estimated at 1,121 million pounds, about 6 percent below the 1958 production of 1,836 million but 5 percent above average. Production in the Virginia-Carolina area is esti~ted a.t 543 million pounds, about 2 percent below the 1958 productio~.
In the Soutneast area, indicated production of 198 million pounds is down 12
percent from 1958.
PECANS:Production is forecast at 138 million pounds, 21 percent less than lo.st
,year, and 8 percent below a.verage. All Sta.tes east of;the Mississippi
River expect 0. smnller crop.than last year with their combined production only
about ha.lf as large as in 1958. West of the Mississippi, all States expect a
somewha.t larger crop with their production tota.ling about one-third more than in
1958.
UNITED STATES
Acreo.ge :
Yield
:
Production
CROP
: Un!t: For Ha.rv.:
: Indicated :
: Indicated
1959 : 1958 :August 1,1959: 195~ :Aug\!St__1L l259 1,000
a.cres
1,000
1,000
CORN, ALL
Bu. 84,381 51.1
49.5 3,199,844 4,113,410
WHEAT, ALL
Bu. 53,211 27.3
21.0 1,462,218 1,118,960
OATS
Bu.
COTTON
Bales
HAY, ALL
. Ton
y SOYBEANS, for beans, Bu.
PEANUTS
Ton
4!i.5 . 28.,823
14,991 10,991
44.1 466 gj
1.61
36.4
.21,968 .. 24.2
24.2
1,496 1,205 1,154
1,422,164 11,512
. 121,924
514,413 1,835,800
1,048,533 14,815 109,339 531,439
1,126,995
POTATOES, IRISH POTATOES, SWEET
Cwt. 1,391 181.1
Cwt.
214 . 65.5
116.1 65.2
265,129 11,598
245,992 11,852
TOBACCO, ALL
Lb. 1,151 1,611 1,611
1,136,204 :1.,863,801
Y fI For Pi cking and Threshing.
Pounds.
..
I
.....
""'"
. ",~,.." ,
GEORGIA CROP REPORTING SERVICE
<: I \f ,;,~, ~-;""'::::..""','1:I.,~"" \~!.-J,,-oJ ,I ~/'\-,.
"
I
:.
"I.
",..';~:;r
.J'
:i (
:..
10'
"'" '"\.'...
t.".e:;-\~
.
.\,t'-
.I
..
: t ' ", \,.' ,
. ~... I.' .._ .d . .\: .. ,
' - .. , . -
,:.
7~.'1t:~'1 ',."'~;~\':~;::::11,: f,: I; J.;l ,li.,
;.;-J-, . "
I' "
".:,.,/ ". . rj'',: ',: " ':' j r , .\f . ~ ",,1J;I:~
,\",'," \.~,"' \ \" , ) ..!..:
I.''~.' . ;",
',"1 :
'
-'
,0
,
'
W- "".,~~ r J~ , ~ :~" :."
,;0.
".
\ i\'l. 1..I.-''''''
,
+
."'.:''~,l
~ .~....,, I' '" >:
' '.
.'. '..,
' 'I
r'
0'
~
' , "..
.c-J
~JS-
.';~
AUG21 '59
Released: 8/19/59'
GEO~GIA CHICK HATCHER Y REPORT
L1BRARIE.s
,
,
, Athe,ns, ,Ga., August 19 -- A total.of 5, 730, 000 broiler chicks we-re placed
wittt' producer s \n Georgia during the' week ending August 15, accordi'ng to the '
Georgia Crop Rep,or~ing Service. This compare s with the 5. 807. 000 placed the pre~ous week and is 2 percent less than the 5, 868, 000 placed the same week
last: year.
,
.
, Eggs set by Georgia. 'hatcheries amou.nted to 6,932,000 compared with .,.
7,419, OOO,the previous week and is 7 percent less than the'7,448, 000 for the
corresponding week last year.
The majority of the prices paid for Georgia produced hatching eggs were reported Within a range of 40 to 60 cents with an aver~-Q.f;..:il.,centsfor all hatching 'eggs and 49 cents for eggs purchased at the farm from flocks with hatchery owned cockerels'.. ~ast week the range was from 45 to 55 cents with an average of 51 cents for all hatching eggs and 49 cents for eggs purchased at the farm
from, flocks with hatchery owned cockerels. Most prices charged for chicks' ,
wer.e: reported within a range of $7.00 to $9.00 with an average of $7.75 per hun-
dred 'compar'ed with a range of $7.00 to $9.00 with an average of $7. 75 per hundred 'la~t ~eek. The average' prices last year were 68 cents for' eggs and $10.75 for chicks.
Weighted average price from the ,Federal-State Market News Service for
broilers during the week ending August 15 was Georgia broilers 2 3/4 - 3 3/4
pounds at farms 14. 50~. ' , . . '
," "
Wee.k Ending
GEORGIA EGGS SET, HATCHINGS, AND CHICK PLACEMENTS
I
I
. BROILER ,TYPE ' ' , ..
.. - '
-,,,,'
, EGG TYPE"
1; "'_
Eggs Set !.!
Chicks Placed for Broiler s in Georgi~
Eggs Chic.ks Set Hatched
I .-
1958 ;' 1959 ' 1959 0/0 1958
1959 1959 0/0 ,1959 1959
of 1958
of 1958
June 13 June 20 June 27 July' 4
July!11 July 18 July 25 Aug. ' 1
Aug. 8 Aug. 15
Thou.
9,36,0 9,082 ,~, 658 8,741 8. 77'1 8, 560 8,254 8,302 8.010 7,448
Thou.
9,312 ,9.210 :9,210 9,073 8, '741 8,337 8,231 7,771 7.419 6,932
Percent Thou. Thou,. Percent Thou. Thou.
", '",
99 7,06'3 6,961,
99
16,5 ' 179 ~
101 7, 153 6,807
95
218 166
106 6,878 6,922 = ",-_lQ. +.~'"
81 190
104 ' 6, 724 , '6, 776
101
184
97
100, 6.869 ','6,,573
96
96 191
97 6,340 6; 554
103
165
61
100 6,329 6,398
100
131 138
94 6, 193 6,033
97
143
72
93 5,969 5.807
97
212 124
93 5.868 5,730
. 98
168
97
11 Includes eggs set by hatcheries producing chicks for hatchery supply flocks.
ARCHIE LANGLEY Agricultural Statistician In Charge
W. A. WAGNER Agricultural Statistician
u-.-S-.--D--ep--a-rt-m--en--t -o-f-A--g.r-ic.-u-lt-u-r-e--.-------------A--g-r.i-c-u-lt-u-r-a-l-E-x--te-n-s-i-o.n--S-e-r-v-ic-e--
Agricultural Marketing Service
State Department of Agriculture
319 Extension Building, Athens, Georgia
.. ---------------------------------------------------- -------------r-----
EGGS SET AND CHICKS PLACED IN COMMERCIAL AREAS. BY WEEKS
.
Week Ending
1959
P 2.
STATE
Aug.
Aug.
Aug.
1
8
15
.
EGGS SET - THOUSANDS
July 11
r July 18
July 2.5
Aug. 1
Aug. 8
CHICKS PLACED - THOUSANDS'
Aug. 15
-
Maine
1,412. 1,334 I, 369
1; 2.2.2. ' 1,2.02 1,2.12 I, 160 1.. 163 I, 082.
Connecticut
1, 032.
92.1
773
551
607
62.9
638 ' 487
505
Fennsylvania
1,256
I, 173
1,235
719
833
707
718
673
757
Indiana Illinois
I, 811 2.2.4
1,604 145
1,654 2.16
854
82.5
878
797
736
791
106 , 129
108 . 111
J30
103
Missouri Delaware
1,795 1,590
1,776 1,550
1,624 I, 349
.
754 I, 778
908 I, 591
. 865
845
l,625 : 1,550
. 857 1,573
815 1,742.
Maryland
2., 952
2,900
2,771 ~
1,894 2,055 2,001 : 1,898 2,033 1,782
~
Virginia
1,942
1,907
1,813
993 I, 117 1,272 : 1,.026 1, 116 1,009
" est Virginia
287
314
287
550
565 . 515
484
445
528 .
North Carolina
3, 516 3,323 3, 172
2,919 2;930 2,764 2, '576 2,551 . 2,660
South Carolina
454
463
446 ,
351
366
354
331
348
292
GEORGIA
7,771 7,419 6,932
6, 573 . '6,' 554 6,298 6,033 5,807 5,730
Florida Alabama Mississippi Arkansas Louisiana Texas
295 3,948 2,887 3,825
664 2,783
3tA
3,769
2,7~~
3,666
599 2.,706
320 3, 6~i5
2,72A
3,399 505
2,497
172
160 . 187
144
158 . 177
3,394 '3,363 3,295' 3, 177 3,098 2,973
2,370 2.,292 2,214 ' 2, 132 2.,045 2, 169
~ 3, 525 3,483 3, 597 3,358 3,287 3,C77
386
354
423
363
374
413
2,301 2, 157 2, 142 2,250 2,014 2.,073
VI ashington Oregon California.
310 317 1,355
370 313 1,2.11
357 290 1,245
306
351
303
287
335
340
238 I, 021
.~
203 945
. 237 1,045
213 872
165 959
186 878
TOTAL 1959
,
TOTAL 1958
1959 % of 1958
42,426 43,809
97 -
40,539
4 2 , 4 0. 1
96
38,633 40,696
95
32,977 32,990 32,671' 30,963 30,354 30,082
34,912 33,846 3'3, 378 32~440 32,003 31,232.
94
97
98
95
95
96
',-
(GlE(Q)~<GnA C~C01P JR{JEJP>(Q)JRTllNG SlEJR{Vll<ClE
AGRICULTURAL EXTe:NSION Se:RVICe: UNIVe:RSITY OF GEORGIA AND THe: STATE DEPARTMENT OF AGRICULTURe:
I ,f
UNIVERSITY OF GfO
&d
U. S. DEPARTMENT OF AGRICULTURE AGRICULTURAL MARKETING SERVICE 319 EXTENSION BLDG ATHENS. GA.
Athens, Georgia
August 19, 1959
1'0-;
PULLET CHICKS FOR BROILER HATCHltRY SUPPLY FLOCKS
July 1959 - Unit'ed States
3/5
The indicated domestic placement of, pullet chicks for broiler hatchery supply flocks by leading primary breeders' of broiler replacement stock totaled 2, 279, 000 chicks during July 1959. This was 21 percent less than domestic placements of 2,892,000 chicks in Juiy 1958. Total placements (domestic plus exports) were reported at 2,408, 000 as compared to 3, 071, 000 a year earlier.
The placement data include pullet chicks sold during the month, plus the number of pullet chicks expected from eggs sold during the preceding month. The conversion from eggs to expected pullet chicks was made on the basis of 125 pullet chicks per case of hatching eggs sold. The primary breeders included in this report account for a very large percent~ge of total supply of replacement pullets for broiler hatchery supply flocks. Sales of replacement pullets by these breeders provide an indication of the potential number of pullets available for addition to hatchery egg supply flocks several months before the pullets will actually move into the flocks.
Pullet Chicks!.! Placements for Broiler Hatchery Supply Flocks
, Month
--- ------ ---------==- -- ------,
Total
-
1957
19582 ./ , 1959
1958
Thou. Thou.
Thou.
Thou.
Domestic
1959
.
Thou.
1959 as %
of 1958
Percent
January.', .. , ... 1,886 February.... , . , 1,997 March. , ........ 2,538 ~pril. , ......... 3,033 ~ay..... , ...... 2,899 June. , ......... 2,060 July, .......... 1,676 .t\ugu at ......... 1,410 ~eptember. . . . . . 1,935 October........ 2,297 ~ovember...... 1,926 December...... 2,238
Annual Total. . 25, 895
1, 982 2,281 3, 132 3,331 3',641 3,409 3,071 2,668 2,718 2, 585 2, 153 2, 165 33, 136
2, 124 2,414 3,450 3,765 3,007 2,575 2,408
-
-
.
1,842 2, 162
2,997 3,234 3,522 3,234 2,892 2,486 2, 546 2,473 2,048 2,004 31,440
1,884 2,256
3,209 3, 573 2,861 2,392 2,279
102 104 '. 107
110 81 74 79
l! Includes expected pullet replacements from eggs sold during the preceding
month at the rate of 125 pullet chicks per 30-dozen case of,'eggs.
ARCHIE LANGLEY Agricultural Statistician In Charge
W. A. WAGNER Agric ultural Statistician
t:.: .,".,0~ .'.,/:. :', ,~." ~
;,
I I~
: .. :'" ,,:. \'" 4'-."
..: ".\ ;'. ~~ - " ~'. - ,.;....
CHICKENS TESTED
.
....
....'
pEORGDAt~'. 'In Georgia 245,365 chickens for supplying broiler hatching eggs' ,were
,
teste,d:for pullorum disease during July 1959--3 percent less th!in
~he 253,865 tested in July 1958. Testings of egg-type chickens for July wer'e
1,i0, 259--3-3 ,perc~nt mO,re than the 30,299 tested in July last year.
UNITED STATES: There were 1, 533, 153 chickens for supplying broiler hatching
,;, " , eggs tested during July--down 6 percent from Ju1Y.1958. The
cumlilative total. for the testing year, July 1958 through June 1959. totaled
~7, 205. 491.up 25 rpercent from,the number tested during these'months a year
~arlier. .'
'
.
'..'
..
;
In the States for which comparisons are available 443, 579 chickens were
~ested in 'July, for' supplying eggs for egg-type ~hicks--down 11 percent from
July 1958. The number tested July 1958 through June 1959 totaled 13,159,81,0--
~bout 1 percent less than the number tested during this period a year earlier'. '
This report is made ,possib~e through the cooperation of the NationCl:I poultry Improvement Plan official State age~cies, the Animal Husbandry ~esearch Division, Agricultural Research Service, and the AgricUltural Estima.tes
Division, Agricultural Marketing Service. ,
Georgia - Chickens Tested by Official State Agencies
Month
-luly . Aug. Sept.: ' Oct. ' Nov.',,' " Dec. ' Jan. i'eb. ' Mar. A.pr.
~ay
June
For Broiler Production
, : :' Egg Typ'e Chickens
By Months.
Cumulative
By Months
1958-59: 1959-60: 1958-59: 1959-60 ~ 1958-59: 19~9-60
."
: 253,,865
: 240.302 : 413.264 : 458.442 : 388, 136 : 432.318 : 564.491 :482.212 : 400,437 : 275.275 : 242,067 : 253.013
245, '365
,'. ,
-
;
,-
~'
' 253, 8'65
494. 167 907.431 1. 365, 873 I, 754. 009 2,186,327 2,750.818 3, '23~" 030 3.633-.467 3.908,742 4,150.809 4.403.822
2~~, 365 r
,
, 30,299 42,581
35.652 41.043 26, 186 84. 778 34, 194
5.280 ' 4,994 ,6, 779
'5. 561 25.032
40,259
. ',.
,
~'
United States - Chickens Tested by Official State 'Agencies
~;--
.-- .. ---...
I>
:
For Broiler Production
:
For Egg-Type' Chickens- "
by Months !!
;.
by ,Months ZI '
. Month ,-
,',. :- I .:
:
6
:
.
1958-59 ' :
1959-60
~-'-~~
. . ' , 1958-59
,195"9~60 )'"
,July
: 1.628, 129
1. 533, 153
500, 558
443, 579
1\ug. 'Sept.
: 1,596,792 : 2.643,740
599,607 1, 243, 658
Oct. Nov. Dec. Jan. Feb.
: 3.119.754 : 2,951,368 : 2,794.873 : 2.601.927 : 2,363, 505
2,318,229
-
2,349,994 2,487,248
"I. 648, 909
756,864
Mar. Apr. May June
: 2,320.302 : 1,928.397
1.647,255 : 1, 609.452
421. 587 267,870 241,636 323.650
11 All States except Mont., N.Mex., Ariz., Nev. :Zl All States except Ohio, Del.. Okla., Mont . N. Mex., Ariz., Nev.
G...
E \.
O.
R
G
I
A
'
C
R
O
P
REPORTING SERVICE ~.
3J~'-
ttJ I /'1 r r \ \ I
\ j '1<':'
J .:.-J
r r C t I Ju;1-\-\--';,tcr~ I J ~ Jf'J\ \J/,'
AUG 27 '59
Released: 8/Z6/59
GEORGIA CI-tICK HATCHER Y REPORT
LIBRARIES
.
,
Athens, Ga., August Z6 -- A total of 5,370.000 broiler chicks were placed
with producers in'Georgia during the week ending August ZZ, according to the
Georgia Crop R~por~ing,Service. This compares with the 5,730,000 placed the
previous we:ek and'is 5 percent 1e~s than the 5, 6~0, 000 placed the same week
last year. . ' ... '
,
Eggs set by Georgia hatcheries amounted to 6,775,000 compared with
6.932.000 the previous week and is 7 percent less than the 7; Z94. OOO.for the
corresponding week las~ year.
.
. The majority of the prices paid for Georgia produced hatching eggs were reported within "a. range of 40 to 60 cents with an average of 50 cents for all hatch-
ing 'eggs and 48 cents for eggs purchased at the farm from flocks with hatchery . own.ed cockerels. Last week the range' was -from' 40' to 60 cents with an average ..
all of 51 cents for hatching eggs and 49 cents for eggs purchased at the farm
f:l:'om. flocks with hatchery owned cockerels. Most prices charged for chicks were reported within a range of $7.00 to $9.00 with an average of $7.75 per hundred compared with a range of $7: 00 to $9.00 with an average of $7. 75 per hun- ' dred last week. The average prices last year were 67 cents for eggs and $10. 50 ilr chicks .
. Weighted average price from the Federal-State Market News Service for broilers during the week ending August 2Z was Georgia broilers Z 3/4 - 3 3/4 pounds at farms 15.01f.
"
GEORGIA EGGS SET,' HATCHINGS, AND CHICK PLACEMENTS
BROILER TYPE
EGG TYPE
I Week
Ending I
Eggs Set !!
1958
1959
11959 %
of 1958
Chicks Placed for Broilers in Georgia
Eggs Chicks Set ,Hatched
1958
1959
1959 %
of 1958
1959
1959
Thou. Thou. Percent Thou. Thou. Percent Thou. Thou.
June ZO 9.08Z 9,Z10
101 7, 153 6.807
95
Z18: 166
June 27 8,658 9,210
106 6,878 6,92Z
101
81: 190
July 4 8,741 9.073
104 6.7Z4 6,776
101
184 . 97
July 11 8.771 8,741
100 6.869 6, 573
96
96; 191
July 18 8, 560 8,337
97 6,340 6.554
103
165
61
July Z5 8.254 8,231
100 6.329 6,398
100
131 138
Aug. 1 8,302 7.771
94 6, 193 6,033
97
192Y 72
..Aug. 8 8,010 7,419
93 5,969 5,807
97
Z12 1Z4
Aug. 15 Aug. ZZ
7.448 7.294
6,93Z 6,775
I 93
I 93
I
5.868 5,660
!
5,730 5,370
98
168
97
95 I ZlZ
144
I
!J Includes eggs set by hatcheries producing chicks for hatchery supply flocks.
2/ Revised.
ARCHIE LANGLE Y Agricultural Statistician In Charge
W. A. WAGNER Agricultural Statistician
-------------------------------------------------------------------------
U. S. Department of Agriculture
Agricultural Extension Service
Agricultural Marketing Service
State Department of Agriculture
319 Extension Building, Athens. Georgia
----------------------------------------------------------~--------------
EGGS SET AND CHICKS PLACED IN COMMERCIAL AREAS, BY WEEKS
-
~
Week Ending
STATE
Aug. 8
Aug. 15.
Aug. 22
EGGS SE T - THOUSANDS <
July 18
July 25
Aug. 1
Aug. 8
Aug. 15
Aug. 22
-
CHICKS PLACED - THOUSANDS
Maine
1,334 1,369 1, 118
1,202 1, 212 1, 160 1, 163 1,082
980
Connecticut
921
773
673
607
629
638
487
505
420
Penns y1vania
I, 173
1,235
1,298
833
707
718
673
757
859
Indiana
1,604 1,654 I, 521
825
878
797
736
791
767
Illinois
145
216
211
129
108
III
130
103
138
Missouri
I, 776 1,624 1,386
908
865
845
857
815
805
Delaware
1,550
1,349
I, 172
1, 591 1,625 1, 550 1,573 1,742 1,607
~
Maryland
2,900 2,771 2,651
2,055 2,001 1, 898 2,033 1, 782 1,967
Virginia
1,907
I, 813
1,607
I, 117 1,272 1,026 I, 116 1,009 1,060
West Virginia North Carolina
314
287
3,323 . 3, 172
282 3,033
565
515
484
445
528
463
' 2,930 2,764 2, 576 2, 551 2,660 2,581
South Carolina
463
446
401
366
354
331
348
292
272
GEORGIA
7,419 6,932 6,775
6,554 6,298 6,033 5,807 5,730 5,370'
Florida
,
324
320
361
160
187
144
158
177
205
Alabama Mis sis sippi
3,769 2,752
3,655 2,724
3,466 2,386
3,363 3,295 3, 177 3,098 2,973 3,019 2,292 2,214 2, 132 2,045 2, 169 2,035
Arkansas Louisiana Texas
3,666
599 2,706
3,399 505
2,497
3,248 465
2,405
3,483 354
2, 157
3, 597 423
2, 142
3,358 363
2,250
3,287 374
2,014
3,077 413
2,073
3,024 366
2,028
Washington Oregon
California
370 313 1,211
357 290
1,245
380 313 1, 251
:
351
303
287
335
340
292
203
237
213
165
186
161'
945 1,045
872
959
878
888
TOTAL 1959 TOTAL 1958
1959 % of 1958
40, 539 42,407
96
38,633 40, 696
95
36,403 39,950
91
I
,, 32,990 32,671 30,963 30,354 30,082 29,307, I
~ 33,846 33,378 32,440 32,003 31,232 30,025
I
I
.
97
98
95
95
96
98.
:,;
UNI
RGfA
3/0
SEP 3 '59
G1E(Q)~(GllA ,<C~~IP--lRt1P'(O~1rllN<G SlE~vn<ClE
..
. -... ... _.
..
ACJRICULTURAL EXTItNSION SERVICE
U. S. DEPARTMENT OF AGRICULTURE
UNIVE~S1TV CSFGEORGIA AND' TH! ...
: AGRI<:ULTU'ML MARKETING SERVICE
STATI:' DEPARTMENT OF AGR'ICULTURE
Athens, , ~org1:a
',,,' aXTIE'NS.ON..LDG., ATHENS, GA.
,
Se~t~mDer 'l~ 1959
GEORGIA ,:,TURKEY PR0DUarION UNCHANGED
Georgia: The 1959 turkey production in Georgia is expected to be 284,000 head, or the same as last year. Heavy breed turkeys will smount to 280,000
birds and light breed 4,000. The largest production was in 1952 when 618,000' head vere produced.
RECORD UNITED STATES TURKEY CROP EXPECl'ED
Un!ted states: Farmers are raising ~'l?out 82 million turlteys this year--5 percent
_.
,
. more:than in 195a, and, one percent more than the previous record
established in 1951 according to a preliminary estimate of the Crop Reporting :
Board. The total humber of heavy breed turkeys is about the' same as in 195~.,
With a sharp' increase in the number of heavy whites being offset by a decrease
in bronze and other heavy breeds. The nUll1ber of light breed turkeys being
?6 raised is' up ?6 percent fr~ las:t year, a~counting for 19 percent of the total
, ' raised comp~d.with percent in both 1957 aJl 1958.
He~ breed turkeys being raised total 66",427,,000, compared with 66,,121,000
raised st year. The number of heavy white turkeys increased,sharp1 this year,
accounting'for about 28 percent of all heavy breeds" compared 'with' 21 percent
last year.
;
,
Light bz:eed turkeys ra,ised are expected to total 15,448" 000,_ up 26 percez:1t
tr.om ~s~ year. Inoreases occurre~ in all regions except the North' Atlantic'.'
Turkeys being raised during 1959 are trom poults hatched from September'; ,
1958 through 'August 1959. The hatch for the September through December period
of 1958 was 65 percent above' a year earlier. This increase, about 2.1 million'
poults more than the previous year, accounted for 3 percent of the 1959 crop.'
The total turkey hatch January through May 1959 was 6 percent above last year.
_J~~~ch d~1ng June 1n!oS 3 pe+c~n~ J>.e).ow June ,l958, and the hatch in, JU1 was 9'
, . per~~nt below a year earlier. Eggs in incubators on August 1 were- 1 percent'
,~ss than August 1, 1958.
'
.
Pr1c~s received by farmers for turkeys March through July averaged 13"
percent less than the same period in '1958. Turkey-teed ratios have been below
a year ear.l1er sinc!! JanuarY' 1 9 5 9 . '
.'
In this report, light breed turkeys include Beltsville small White,
. Jersey B\1tf, Royal Palm, and Wild turkeys. Heavy breed turkeys include Heavy Wh1~eJ Brq~ze, .o~her Qeavy ~~eds and'Grosses With light breeds.
cARL o. DOESCHER
Agricultural Statistie1an
(OVER)
ARCHIE LANG~ Agricu~tural Statistician In Charge
- ....
.-.
.... , .0-;.
.. ~'. .... ,
- - - - - - _.- - - - - - - - - - - - - - - - - - - - - - - - ," -,..t State :
- - - -" Turkeys: Number Raised on Farms
, " , ..,. "..'-
.~ .
1-,
~
," ';' " ,
'::,'" and, : - __-1~!e-!'V-l - !?r!-:.e- 2:s- __-- .:.. - _- _1- 4g- ~t- _b~-!:-.d-.!-_- _:---T-.9- .t!-l_~ a.!-l_- bE.-e!- :.~-~~-_-_
Division:
e
:
:
:
:
:,~.as
______ .:.. _ 192.8__ .:..1:929__:__12.5. _ .:.. _12.52. _ .:.. 1:.92.8_ .:.. _ 1:.92.9_ ~_of ~
: Thous. Thous. Thous. Theus. Thous. Thous. Percent
Maine
: 94
62
4
2
98
64
65
N. H.
: 121
122
2
1
123
123
100
Vt.
: 71
52
1
0
72
52
72
Mass.
: 462
434
10
8
472
442
94
R.I.
: 27
26
1
2
28
28
100
Conn.
: 219
234
6
2
225
236
105
N. Y.
: 646
550
12
9
658
559
85
N. J.
: 150
150
13
13
163
163
100
Pa.
:_ !,~
!'ft
15
..9!!. __ !,~1!!. _ _1J..2.8
y~ _
N. Atl. :_ g,9~~
g,_2
~02.
!3! __ ~,!5~ _ _2.13285- __ y __
Ohio
: 2,402
1,935
091 1,123 3,153 3,05
97
Ind.
: 2,539
2,139
478
655 3,017 2,794
93
Ill.
: 981
963
113
120 1,094 1,083
99
Mich.
: 853
Wis.
:_ g,64~
E. N. Cent.:_ 2.,~~
690
149
200 1,002
890' 89
1,18.
l2.
128 __ g, 771 __3.1316
!41 _
2.,512 __ !,2.59 __ g,22~ __1l,Q41 _ !1.z...7~1 __ !Ob _
Minn.
: 9,313
11,347 1,22b 1,b49 10,539 13,49b 12g
Iowa
: 5,929
6,656
875
1,373
6,804 8,~
118
Mo.
: 2,957
3,087
174
424 3,131 3,511
112 \
N. Dak.
: 682
800
24
19
706
819
116
S. Dak.
: 616
729
32
68
708
797
113
Nebr.
: 1,055
1,016
24
40 1,079 1,056
98
Kans.
: 110
698
38
80
748
778
104
W. N. Cent ..:..-g1J..3g2_- _- _-gfiJ..g~-83-- 2J..323_-_-_3J..b23_-_-g3J..7!"5_-_2.~_-_-_~~-
Del.
: 113
12
399
3t>4
512
1+92
90
Md.
: 241
'200
8'7
43
328
243
74
Va.
: 2,021
1,602 4,455 5,133 6,476 6,735
~04
w. Va.
: 477
266
916
834 1,393 1,100
79
N. C.
s. C.
: 1,557 : 880
1,504
196
214 1,753 1,118
98
807
14
42
894
849
95
Ga.
: 283
280
1
4
284
284
100
Fla. S. Atl.
Ky.
: 165 :- 5,737 -
-
-
lEo
fi,967 -
-
97 b,165 -
-
212 b,34b -
262 -11.902 -
392 1i:-813- -
-
-1i5J0 -
:- - 334 - - - - 380 - - - -23 - - - -lb - - -- 357 - - -39b - - III -
Tenn. Ala. Miss. Ark.
La. Okla.
Texas
S. Cent. Mont. Idaho Wyo. Colo. N. Mex. Ariz. Utah Nev. Wash. Oreg.
Calif. West
: 170
: 203
: 181
: 2,044
:
42
: 847,
:_
:_
11,,3~2Q~
:..LO
: 179
:
6
: 1,312
: 74
: 100
: 2.591
:
2
: 508
: 1,462
:_11,~!
.:_12,_ ~
91
11
36
187
127
68
139
103
57
306
196
64
171
20
71
207
248
120
1,459 31
337
,303 2,381 1,762
42
31
74 74
866
187
127 1,034
993
96
~3,,2!.59Q1
__
!!.0Q
i:,g81
__
72. !,g82.
__ __
!3i,,1g230~
____37~751/~
__
!OQ_
y! _
23
1
3
19
2 0 ' 137
199
35
41
2,14
240
112
4
0
1
6
5
83
1,352
14
14 1,326 1,366
103
63
6
5
80
68
85
103
0
0
100
103
103
2,384
1
207
0
331 2,198 2,721
2
1
97 50
546
1
14
515
560
109
1,248
~,!7g
,2.92
141
243 1,603 1,491
~O. __ ..;; ~ __1~,.32. _l2{gl
12 __ !,191 _ _2Q,,lOg _ !9J.. Q2
93
..9~_
_
'
Umted States 66, 121
66,427 12,228 15,448 78,349 81,875
105
'">... ~
,/'","'
-~
u"i<!.::..~~tIl~' .,
'- \\.. l
,
-
~lj. '\,J,
\"t'
-\,,'
' - :."' .~WI- ~" ~,.' ~...\~ ~'.
, .)..\~\..
.-~'~
i . '\'" / -
,1"1'"
~.;f ....
3/S-
GEOR.,-G" IA
CROP
REPOR~s..E.ILV-lCE
IUNIVERSlh OF GEORGIA
~v Ej-EJ ;J-<\-LrYC, ~B~f J~Y SEP 4'59
Released 9/2/59
gEORGIA CHICK HATCHERY REPORT
,
Athens, Ga., September 2--A total of 5,331,000 broiler chicks were placed with producers in Georgia during the week ending August 29, according to the Georgia Crop Reporting .Service. This compares with the 5,370,000 placed the' Jirevi~s week,and is J percent lessthan the 5,493,000 placed the same week last year.
Eggs set by Georgia hatcheries amounted to 6,485,000 compared with. 6,775,000 the previous week and is 7 percent less than the 6,968,000 for the
corresponding week .last Year.
The majority of the prices paid for Georgia produced hatching eggs were reported within a range of 40 to 60 cents with an average of 51 cents: f'or all
hatching eggs and 49 cents for eggs purchased at the farm from flocks with hatchery
owned cockerels. Last week the range was from 40 to 60 cents with an average of
Sp cents for all hatching eggs and 48 cents for eggs purchased at the farm from
flocks with hatchery owned cockerels. Most prices charged for chicks were reported ~thin a range of :~7.00 to ;~9.00 with an average of ~~8.00 per hundred compared w1th a range of ~7.00 to ~~9.00 with an average of ~p7. 75 per hundred last week. The' ayerage prices last year were-66 cents for eggs and $10.50 for chicks.
Weighted average price from the Federal-State Market News Service for broilers during the week ending August 29 was Georgia broilers 2 3/4 - 3 3/4 pounds at farms 14. 90.
- GEORGIA EGGS SET, HATCHINGS, AND CHICK PLACEMENTS
BROILER TYPE
EGG TYPE
Week
~nding
!
J\U1e 27 JU.. ly 4 JUly 11' July 18 July 25 Aug., 1 Aug. 8 Aug. 15 Aug. 22 Aug. 29
.'
1958
Eggs Set 11
Chicks Placed for Broilers .in Georgia
1959
1959 ~o of 1958
1~9.S
- '19S9'
~
,
1.~59 c(
9'1958
Thou. Thou. Percent mnQ~ -. Th.ou. Percent
Eggs I Chicks
Set IHatched 1959 1959
Thou. I Thou.
8,658 9,210 106 6,878 6,922 . 101
81 190
8,741 9,073" 104 6,724 6,776 101 184'
97
8,771 8,741 100 6,869 6,573 96
96 191
8,560 8,337
97 6,340 6,554 103 165'
61
8,254 8,231 100 6,329 6,398 100 131. 138
8,304 7,771
94 6,193 6,033 97 . 192
72
8,010 7,419
93 5,969 5,807 97 212 124
7,448 6,932
93 5,868 5,730 98 168
97
7,294 6,775
93 5,660 5,370 95 212 144
6,968 6,485
93 5,493 5,331 97 161 168
11
Includes
eggs
set
by
hatcheries
producing
.
chicks for
hatchery
supply
flocks.
ARCHIE LANGLEY Agricultural Statistician In Charge
W. A. lrJAGNER Agricultural Statistician
)
tr.--S~--De~p~-ct-1t- -o~ f A~g-ri- cu-lt- ur- e ~-~-------A-g- ri- cu- ltu-ra~l -E- xte-n- sio-n-S- er- vic-e
\gricUltijrqi ~~ketlng Service"
State Depar~ment of Agriculture
~.
3i9 Extension Building, Athens, Georgia
-----~-----------------------------------
. EGGS SET AND CHICKS PLACED IN CQ1MERCIAL AREAS BY 'WEEKS
STATE
Aug.
~ug. ,Aug.
IS
' 22
29
Week Ending
July
25 '
Aug . ,
1
:'
Aug. '
6 ..
:Aug. ~
15
.
Aug~;
22
-
"
,AUg'.
. 29
t"
:
EGGS SET - THOUSANDS
CHICKS PLACED - THOUSANDS
J ,",
"
.' .
I
..
Maine
1,369 1;116 :513
1,212 .' 1,160 1,16.3 1;062
960 1,046
Connecticut
773 '673 . : 729
629
636 . : 467
505
420
469
Pennsylvania
1,235 1,,296 1,100
707'" .716
673 ' 757 ' ' 659:
714
Indiana Illinois
I
1,654 216
1,521 ' 1,554 '2ll ~,,', :l.90
678
797
108
III
'736
130
791 ,103' ,
i
767 138,
'-.
710 100 '
I Missour;i. .
Delaware , .'
Maryland Virginia
-
- ......
West Virginia '
1,624 1,349 2,771 1,813
287
1;386 . 1,332
1,172 1',171
2,651 2,568
1,607 1,352
262
237 "
865
845 . , .85.7
1,625 1,550 1,$73
2,001 :' 1,'898 2,033
1,272 1,026 1;116
515 484 . 445
: '815 ~ " : 805i
1,742; 1,607
,I' 782~. l!,967
1~009 1,060
. 528
463
768
1,569
1,934
1,001 486
.
,
North CarOlina '
3,172 3,033 2,7'84
2,764 ,2,576 2,551 2,660 2,581 2,396
!
South 'Carolina
446
401 387
.' 354 .. 3.~1 .
348
292
272.'
303
....
G!mGIA
:
.6,932 6,775 6,485
6,298 5,033 5;807 5,730 5,370 5,331
Florida .... '.'. Alabama MississiPPi Arkansas Louisiana Texas' Washington Oregon California
TOTAL 1959
TarAL 1958
1959 % of 1958
.' . 320
361 283
187
144
'158
177. : 205
170
3,655 3,466 3,386
3,295 3,177 3,098 2,973 3,019 3,034
'2,724 2,386 2,451
2,214 .2,132 2,045 2,169 . 2,03S 1,780
3,399 3,248 . 3,300 . ,
3,597 . 3~J58 , 3,281 3,011 '. 3,02~.: 2.,669
505
465 . 523
2,497 2,405 2,.225 -
. 423
363
2,142 . 2,250
374 2,014
. 413: .' 366
~,073
2,028
. '391 1,915
; 357
380 311
303
287
335 : 340' . 292
'277
290 1,245
313 259 1,251 1,084
..
237 1,045
213 . 165
872
'959
: 186 t 878
. 161 888,
200 . '800 ,
I
:
I-
38.633 36,403 34,230 40,696 39,950 37,908
32,671 30,963 33,378 32,440
30,354 32,003
3~,082 3~,232
' .2~,jO?: 28;325
. . . ..
'3F>,02S 28,883
.'
95
91 ,90
. 98
95.
. .'
;
"
95
. 9~ .'
98
... 98
.'
.- . -~.'
~
I
,
F
;
I ;.
:~- ,
/.
!
.
".,
~
E-.
~_
~ >-l lJ:: "
~
(.)
~
;~
3/,
CGE(Q)~GllA <ClR{(Q)l[).1O) m' 16~ 1rllNG SJE~Vll<CJE
AGRICULTURAL I!XTENSION SERVICE
UNIVI!RS'TY"OF GEORGI'. AND THE
STATE DEPARTMENT OF AGRICULTURE
Athens, Georgia
.
SEP 11'59
LIBRARIES
U. S. DEPARTMENT OF AGRICULTURE AGRICULTURAL MARKETING SERVICE 118 EXTENSION BLDG ATHENS, GA.
September 8, 1959
-.GEORGtLt- C'01'!I'GlV REPORTAS, OFL.BEPrEMBER 1
.\
Prospects on September 1 indicated a Georgia cotton crop of 575,000 bales (500 poUIids gross weight) According to information .reported by crop correspondentr to the Georgia Crop Reporting Service. The current production is 63 percent . above last year f s short cro~ of 352, 000 ba~es but 12 percent below the 10-year (1948-57) average of 655,000 bales. Indicated yield of lint per acre is 418 pounds and has been exceeded only by the 1958 record yield of 443 pounds. The acreage for harvest is estimated at 660,000 acres.
Weather conditions during At~t were generally favorab~ for harvesting operations and good progress was made in southern and central districts. Be-
tween' 35 and 40 percent of the crop was ginned in southern districts prior to September 1 and the central area had ginned about 30 percent. Harve,st,tns opera-
tions were becoming active in most of the northern area. The hot, dry weather during August in portions of the central and northern districts retarded vegetative growth and caused rather heavy shedding of squares and small bolls. Prospective yields were reduced below August 1 expectations in these areas.
Final outturn of the crop, c.ompared with the forecast, will depend on . whether or not the various factors affecting the cotton crop during the remainder of the season are more or less favorable than usual.
The Burea~ of the Census reports 133,000 running bales ginned prior to September 1 compared with 93,000 to that date in 1958 and 148,000 in 1957.
CARL O. DOESCHER Agricultural Statistician
ARCHIE IANGLEY Agricultural Statistician In Charge
GEORGIA MAP SHOWING INDICATED PRODUCTION 1959 AND FINAL PRODUCTION FOR 1958 &1957
1959 production indicated on September 1
- STATE -
1959 - 575,000 1958 - 352,000 1957 - 396,000
Districts shown are Crop Reporting Districts and NOT Congressional Districts.
)
\ VII
1959-69,000 1958-53,700 1957-55,000
VIII
1959-116,700 1958- 83,300 1957- 90,000
VALDOSTA
IX
1959-23,000 1958-14,800 1957-12,000
))[1
PLEASE TURN PAGE FOR UNITED STATES INFORMATION
,
.
UNITED STATES - C~ON EEPORT AS OF'SEPrEMBER 1, 1959
The Crop Reporting Board. of the Agricultural Marketing Service makes the fdl~oWing report fram data furnished by crop correspondents, field statisticians,
Bureau of the Census, Commodity Stabilization Service, and cooperating State
agencies. The final outturn of cotton compared with this forecast will depend
upon whether the various influences affecting the crop during the remainder of the
season are more or less favorable than usual. - - - - - - - -: Acres -:- - - L1nt-yie1d7 per- -
-:- -
-
-
-Production -g; - - - -
: for :_
!!.8!Y~s~e~ !c,e
:_ ~OQ-~oE?~ .6.r.s~ :!!e'!'g!!,t_b!~s_
State
- - - - - - - - - - - - - - - - - - - - - - - - - - - - - - - - - - y : :harvest : 1948'-51 : H':}l!ii'l: 1959 : 1948'-51: 1958:
;195,9
average : ~~q: indic.: average:,
.:
1,000
1,000 1,000
1959 indic. 1,000
acres
North Carolina: South Carolina: Georgia :
. . .. Tennessee :
Alabama Mississippi :
395 565 660
515 815 1,440
Pounds
324 310 284 392 312 396
Pounds 'Pounds
466
383
406
381
443 '418
501 550
398 421
409 533
bales
419 598 655 512 844 1,110
-bales 256
299
352 419
439 961
bales
315 455 515 590 125 1,600
Missouri .. :
400
396
Arkansas .. : 1,295
386
Louisiana :
495
396
Oklahoma . :
600
184
Texas ' . : 6,300 232
446
540
386
436 524 1,429
392
415
624
365
312
361
,383
345
3,956
275 925
291 313 4,308
450 1,415
490
390 4,525
New Mexico . :
198
582
820 812
215
301
335
Arizona . .:
380 831
931 992
140
134
185
California other States
.'J:/
815 58
148 1,049 1,086
304
403 393
1,424 48
1,604
29
1,980
48
-----------------------------------------
United States: 14,991 329
466 470 14,046
11,512
14,618
- Am;r:--Ewt.~7 -66.4 - - 435 - - -525- - 54"1 - - - 49-:1- ~ - -83.6 - - - -14.8
-yco-nAt-auig-nuss-ta-b1o-eustt-14.m-80l-:itne-.et-gp-oju-Pndr-os d-oufc-tli-oinn-tg.-in-n'Je/-dV-ainr-dgi-tnoi-ab,-eF-gloi-nrni-dead-,.
------- --
A 509-1b. bale Illinois, Kentucky,
!!J and Nevada.
Included in State 9J1d United States totals. Grown in Texas,
New Mexico, Arizona, and California.
CROP REPORTING BOARD
..
<GJEO)~(GllA C~(Q)IP' ~~llNG SI&:~VH<CJE
AGRICULTURAL EXTENSION SERVICE UNIVERSITY OF GEORGIA AND THE STATE DEPARTMENT OF AGRICULTURE
Athens, Georgia
SEP11 '59
LIBRARIES
S. DEPARTMENT 0'" AGRICULTURE GRICULTURAL MARKETING SERVICE 19 EXTENSION BLDG ATHENS. GA.
September 9, 1959
IS-
FARM P~ICE REPORT AS OF AUGUST 15, 1959
GEORGIA: The All Commodity Index 'ot Prices Received by Georgia Farmers declined
. three points to 249 percent of'its 1910-1914 average during the JIlonth ended August 15, 1959. Primarily responsible for the decline were lower prices for peanuts, corn, and tobacco. Partially offsetting were increases for cotton. hogs, and beef 'cattle. At mid..August the Index',was 16' points (6 percent) b~low a year earlier.
UNITED STATES: During the month ended August 15 the Index of Prices Received by
Farmers dropped one-half of one,percent (1 point) to 239 percent
of its 1910-14 average. Primarily responsible for the decline were lower prices for potatoes, cattle, and cotton. Nearly offsetting were increases for milk, hogs, and wheat. The August index was nearly 4 percent below a year earlier.
The Index of Prices Paid for Commodities and Services including Interest,
Taxes, and Farm Wage Rates "Tas 291 on August 15, down one-third of 1 percent (1 point) from July. It was 1 pel'cent higher than a year earlier. Prices paid for commodities were only slightly higher than in August 1958, but interest, taxes, and wage rates were all substantially higher than a year ago.
r,he Parity Ratio was 80 in mid-August, down 1 percent fram a month earlier, 6 percent fram August of last year, and the lowest since March 1951.
Summary Table for Georgia and the United States
Index : -Aug. -15 : - Ju1yr5-" :-Aug.15 1.9.J.0-J-1+__ -=,__ J-OO: 1958 : 1959 :. . _1959 UNITED STATES
Prices' R- e-ceive.. d) : 248
Record high Index : Date
GEORGIA
Prices Received:
, All Commodities 26
'252
All Crocs : 280
21
Livestock and
Products ' : 213 : 204
:
204: 2
1/ Prices Paid, Interest, Taxes, and Wage Rates based on data for
dates. gj Also May 1959. 'jj Also April 1951.,
ARCHIE LANGIEY
Agricultural Statistician In Charge
RAYMOND R. HANCOCK Agricultural Statistician
.,
......__. -'-
--",-., - _ -_ -. - _. PRICES RE:CEntD BY FARME:RS AUGUST 15, 1959 VITm COMPARISCNS
- - . ". ,'--" -_. -. ..,. _..
....
. -'" -~.
-, :-
--
.....'............. .._- _...--G-E_O.R_G.I_A- - .-.- '" ...-. i1i' '-'--" - _.L_N..I,D-:D'-S"T-A-'T-E"S_...-'.
cc:MdODITY ANDLNIT
Wh~~t';'b~=-" --.-....
I I : Average i Aug .15: July 15 Aug. 15 I I Average Aug .15 : July 15! Aug15
'1910-141 1958' 1959 1959 i 1910-14; 1958 I 1959 i 1959
II : f(."-l:231'-i~ea;:--i::;4-II-i~77--~"-"'~8a4t-i.64
i
j'"
i.jo;
1.75
Oats, bu.
,
. .$
.67 II
I.
.85 ~I
.69 I"
I'
.75:
'1
3991
I
.536 Il
i
.610;i .6a:!
Corn,' bu. . ..
$:
I .91
I
I
1.52; 1.32 i 1.28
Barley, bu. Sorghun Grain, cwt. Cotton, Ib
$'
IJ 1.15 I 1.00: 1.05
1
$:
j
!
II 12.1
I
2.251, 2.05
34.5 j 33.5
I 1.95
I 35.0
Cottonseed, ton
$! I
I
23.65: 49.00,
_
I 40.00
Soybeans, bu.
. II
$1
.I - I I I 2.10
2.10
Peanuts, lb.
I 5.2 I 11.0' _ ., 9.5
I
!
Sweetpotatoes, owt.
$:
I
Lespedeza Seed, Al1,owt.$ ; ..
I.84 :
5.00.
II
6.00
5.80
'
Hay, baled, per ton: All Alfalfa Lespedeza
Soybean & Cowpea
Pea.nut
Wool, lb.
Milk Cows, head
Hogs, cwt.
Beef Cattle, owt.
$1
26.00 : 27.00 25.70
$~
34.80 i 34.50 33.00
$.
28.00 i 29.50 27.50
$$1'
I 30.00 I 30.50
22.00 24.00
29.50 23.00
I
I,
$! I
I
I II 4C.0 46.0
II 44.0
33.85 1 155.00 ,II 110.'00
'! 170.00 I
i
$1 ,
I 7 .~61
21.50 : 14.10
14.20
I
$; 3.96 17.901 19.30 I 19.40
Calves, cwt.
Milk,Wbolesale,cwt.: Fluid Mkt. Mn.nuf. All
Turkeys, lb.
Chickens, per lb.: Pam Com'l Broil. All
Eggs, doz.
I
$1
Ii 22.80! 25.10 24.80
I
$$!;
$'1
J ,
- I i _ IIV 2.43
5.87 : 5.80 3.37; 3.25 5.78 !J5~70
I . ) ,26.0 23.0
I
I
i
I
_
:y'5.75
I 23.0
I
i:
:
!,
:
13.3
I
I
14.5
I:
I 16.6 I 16.5!
13.5 15.0 15.0
21.4 47.7 40.5
! 12.5 14.5 14.4
39.8
I
I!
II
i
I .642l
.619
I I : II ! _ I,
11 12.4
1.18
I' I
1.13 I
i. .855
~895
I
j
I 1.72 ' II 1: .78
1.13 .833 1.61
I 33.22
34.05133.28
I~I 22.55
I 47.60
42.00; 42.80
'I,I
-
I. 4.8
2.11 "I 10.9!
2.05,I 1.98 _ . II 9.54
III,
I
I
1.60 Ii
3.73
j
6.10., 2.94
i
i
I
I,
11
17.20
. I
i lS.40 i
.
19.40
iI
17.30
19.00 I 20.10
!I
II
!I
II
: ,I
18.3
20.00 27.S0 19.80
37.9
20.80 I 21.00
i 26.70 i 26.00
20.10 19J.0
44.1 iI 44.3
!I
212.00 235.001 236 00
II 7.27 20080
I 13 .30 14.00
I,
!
: i, 1 5.42
21.60
: I 6.75 iI 25.10
23 .10' 22.70 28.10 i 27 040
IIiI
I
II
,II ~
_ I: 4.61
4.43 j
3.13 , 3.05. _
y :V 1.60 : 4.05
3.90 'y'4J.0
JI I
i 14.4
24.8
:I
I
22.4 : 21.9
II,:,~
1j
11.4
14.0 17.6 17.0
I 21.5
37.7
,
1LRe.,!~scd.~_..~l.!.!:~~:i?t~3:.~y"~st~~~!_ ... _
-. " .-_... . ... ..., ... "..
PRICES PAID BY FARMERS FOR SELECTED lEEDS AUGUST 15,1959
WITH COMPARISCN S
._ -
----i: - . - - - - - - .-.-._.-. -._"-.'-'--"-'~~~Ill.
--'mm-n'-;UTES- -..- .
-.----- "-'- _._-_---1--'--0--- ,_..__ _ "'--"-'-"-'-'--r"'-'- --
- _.;".- ."--. -- ..
XJND OF FEED
I . Aug. 15 ! Jul,y 15 au. . 15 ; Aug. 15 ; July 15 i.Aug. 15
-
-
----.-0 ... . ..._.._ _ I, 1958. --+.I--...... 195._9 _.i... 1959 .... ' : 1 958 .~!- _1_9- 5- 9--_~: __ ,_1" 959 I
.1JlIDtpd b4tvPkd
r
!
Dollars Por.l00 Pounds'
11.11 Under 29% Protein
16% Protein 18% Protein 20J' Protein 24% Protein
H~h Protein Feeds
CO tonseed Meat (41%)
Soybean Meal (44%) Meat Scrap
BGrraanin By-Products Middlings
Corn Meal
Poultry Feed
Broiler GrOwing Mash Lo.ying Mash
Scratch Grains
lttf naled
..Jg.]'_Qa..'t;.aJ;l~!:.
) .
.__
4.00 3.90
4.30 4.15 4.50
3.90 3.80 4.00 4.10 4.25
33..9800
: Ii !
I 4.05 I
4.00
4.25
I
3.70 3.M 3.62 3.95
3.97
3.67 3.63 3.57 3.90 3.94
4.10 4.15
4.05 4.10
4.05 4.10
4.07 4.62
4.20 4.26
I i !I
3.30
3.25
3.30
2.71
2.77
3.50! 3.55
I
3.40 I 3.30
I 3.55
3.~
2.88 3.39
2.93 3.25
.'
I 5.20 II
4.95 4.45
4.85 4.75 4.20
...1I
4.75 I'"
4.75 4.20
5.11 4.58 4.00
4.85 4.47 3.93
II : I ;
I
I
i~ _.~4.05...0J.0Q!.<L.'.4.5..-0~0~.&{L1! .-.I_4-2..~5Q0O
I'
d
28.20 : 28.40
._V.tOO. ....:_.26. .1.0
...
!
3.66 3.61 3.58 3.86 3.94
4.16 4.20
2.75 2.95 3.25
4.83 4.44 3.93
29.10
.26.~0
'S-
------- .....":-
,..,.".. "-.- I
..
\
,.J
, -:"". 'I " ~.:'I\:",.'~,.'.,,'".
"'N'..\ ..,~......
w'"
...
.
~ :f ",
.'
;;.
.....
:.',
,t ' ;'
..>,
~t/.1
_;
,
\
,f
'':
-'h:.<~<,'""",
.I~'
.
,I,
: ",
'.
\\
II:~
,
.'
...
\ ", ,,,'I'
"."'
..
\' '... 'I. , t' ..
,~"
"\
~::
\..~.,.,,.
''. ,- n , i, , .
I
.........+ .' ~
t ... ....
GE..QRGIA CR OP RE POR TIN'G' ,S'ERMd;I~
'IV EEJ< Y ~
~tP 10'59
, . . LIBRARIES ~
bJ ;-\-r CbJ E Y R
Released 9/9/59
GEORGIA CHICK HATCHERY REPOR~
Athens, Ga., September 9--A total of 4~812,000 broiler chicks were placed
with Producers in Georgia during the week ending September 5, according to the Georgia Crop Reporting Service. This compares with the 5,331,000 placed the previous week and is 7 percent less than tl1e 5,179,000 placed the same week last year.
Eggs set by Georgia hatcheries amounted to 6,373,000 compared with 6,~85,000 the previous week ~d is 7 percent less than the 6,97;1.,000 for the corresponding' week last year.
The majority of the prices paid for Georgia produced hatohing eggs were
reported within a range of 40 to 60 cents with an average of 52 cents for all ha~ching eggs; and 49 cents for eggs purchased at the farm from flocks with
hatchery owned cockerels.. Last week the range was from 40 to 60 cents with an
l average of 51 i cents for all hatching eggs and 49 cents for eggs purchased at the
far.m from flocks with hatchery awned cockerels. Most prices charged for chicks
lolere reported within a range of $7.50 to $8.50 with an average of $8.00 per hundred compared with a range of $7.00 to ~~9.00 with an average of $8.00 per hundred last week. The average prices last year were 66 cents for eggs and $10.50 for chicks. '
Weighted average price from the Federal-State Market News Service for 2 3/4-
3 3/4 poUnd Georgia broilers at tarzr.a during,the week ending September 5 was
14.90.
Week Ending
GEORGIA EGGS SET. HATCHINGS. AND CHICK PLACErr!ENTS
BROILER TYPE
y Eggs Set
Chicks Placed for Broilers in Georgia
I EGG TIPE
Eggs Chicks Set Hatched
1958 1959
1959 %
Of 1958 1958
I 19S9 o1f915995%8 1959
1959
Thou. Thou. Percent Thou. Thou. Percent Thou. Thou.
July 4 July '11 July 18 ;
July,25 ' Aug. ' 1 Aug. 8
Aug. 15 Aug. 22 Aug. 29 Sept. 5
8,741 8,771 8,560 8,254 8,302 8,010
7,448 7,294 6,968 6,971
9,073 8,741 8,337 8,231 7,771 7,419 6,932 6,775 6,485 6,373
104 6,724 6,776 101 184
97
100 6,869 6,573
96
96
191
97 6,340 6,554 103 165
61
100 6,329 6,398 100 131
138
94 6,193 6,033
97 192
72
93 5,969 5,807
93 5,868 5,730 93 5,660 5,370
Y 97 212
124
98 205
97
95 212 - 144
93 5,493 5,331
97 161
168
93 5,179 4,812
93
91
154
11 Includes eggs set by hatcheries producing chicks for hatchery supply flocks.
y Revised.
ARCHIE IANGLEY Agricultural Statistician In Charge
W. A. v.TAGNER Agricultural Statistician
---------~----~-~------------------------
u. S. Department of Agriculture
Agricultural Extension Service
Agricultural Marketing Service
State Department of Agriculture
319 Extension Building, Athens, Georgia
-----------------------------~-----------
"
STATE
-
-.
Maine
Connecticut
Pennsylvania
Indiana . . ..
Illinois
liisS:Oltt'-i ',"-.
Delaware:
..
Maryland --
Virginia
Wes,t Viz:ginia
NOt:th; C~o;u.na .
South Carolina'-
GEORGiA ;... :
EGGS SET- AND CHICKS PLACED IN COMMERCIAL AREAS.. BY WEEKS
-'';:
EaGd SET - THOUSANDS
'. I.
Week Ending
,
.~.
CHICKS pTACF.n - 'lHOUSANDS
! Au~.
Aug.
Sept.
Aug.
Aug. Aug.
Aug.
Aug .
22
29
5
1
8
15
. 22
29 .
,
:
:
1,118 ' 613
1,298 1,521;
211 1,386. 1,172
2,65~
1,607 282
3,033 . 401
513 729 1,100 1,554 190
1,332 . 1,111 ": 2,568 .' 1,352
237 :2., 784
387:
1,099 746 976
1,303 172
1,294 1,138 . 2,708 1,289
196 2,961
385
.1,160 1,i63
61~ ." "-470*
718 " 673
- 797
736
111 . 130
845 - 857
1,550 i,573
. 1,898 2,033
1,026 1,116
484 . '.445
2,576 2,551
331
348
1,054* 485* 757 791 i03 81S'
1,742 1,782 1,009
528 2,660
292
. 980: 1,048
4201 469
.659 - 714
767 . 710
~38'
100
805
768
1,6,07 : 1,569
1,967 . 1,934
1,0-60:. 1,001
ll6J
&86 :
2,581 2,396
272 . 303
6,775 6,485 6,.373
6,033 5,80i 5,.730 5,~70 _ 5,331
.. -
Sept.
5
1,061 427 774 604 '. 156 724
1,326 1,871
984 467 2,405 263 4,812
Florida
-',
Ala-pama '.
Mississippi
-I
,
Ark.ans~s
Louisiana' . ,
Texas
"
Washington
Oregon
L.
California
,
361 3,466 2,386 3,248
465 2,405
380
313 1,251
- 283 :),386 2,451
3,.300 . 523
. 2,225
317 259r 1,084'
;,
407 3,106 2,318 3,122
417 2,172
303 253 1)332
144
158
3,177 ),998
2,132 2,045
3,358 . :.3,487
379*
2,250
287
.'"
213 913*
374 2,0+4
335 165 959
..
177 2,973 2,169
3,077.
413 2,073
,340. 186 ,878
205 ' . 170
3,019 - 3:,034
2,035 1,780 3,.024 i 2~869
..3P6 j - 391'
2,028 1,975 .
292 . 277
161
200
888
800
213 2,906 1,664 2,769
366 1,870 .
317 121 839
TOTAL 1959 TOTAL 1958
:36)403 34,230 34,130 39,950 37,908 37,213
30;996Jt 30,337* 30,03l.$- 29,307 28,}25 : 26,939 32,440 32,003 31,232 30,025 : 28,883 28,117
1959 %of 1958:"
- 91 90 ..
">
., .
,:
92
* Revised
9~'
95
96
98 .. :,98
96
:
.. :
--. . ".
.--
.' ~1
.. _
... ,
'f
i-
<GIEQ)~(GllA,ce~(Q)~~
,
r
IU;!' , . . . . , , ...
i .Vii "\r lif-:"GIA
ACiRICULTURAL EXTENSJON SEIWICE, . :, ;:, , \"
UNIVERSITY OF GEORGIA AND THE
.
STATE DEPARTMENT :OF AG~I~U,LT~~E ' l~EP
~thens Georgi's ,. ' '... , '... ..
.
,
, llSRflRIES
U:.S,:DEPARTMENT qF AGRICULTURE AGRICULTURAL MARKETING SERVICE lie EXTENSION BLDG., ATHENS, GA.
September 9, 1959
GEORGIA PEANUTS "PICKEDAND THm..sHED 1958 CROP
(Ih~s~ ~sj;.j;e ~r~ ~B,eg ~n.. tb~lltIS.t vliJ.a~l~ ga,ta.BDd.are.PteJ.iztdDBlY.l
District and:
: ,.,..
:
___Co_un_ty_____ !~
Harvested Acres
!:
_Y_ie1 ldP~P~edr!A)_c_re!:
Production
iOQO_P~~d~)
_
DISTRICTS I,
II &III
- -DISTRICT IV
Chattahoochee Harris Macon }larion Muscogee Schley Talbot, , Taylor Upson
Total
DISTRICT V
Baldwin B1eck1ey Crawford Dodge Hancock Houston Johnson Laurens Mongtomery Newton Peach Pulaski Treut1en Twiggs Washington Wheeler Wilkinson
Total
DISTRICT VI
Bulloch Burke Candler Effingham Emanuel
G1asc~ck
Jefferson Jenkins Richmond Screven Warren
Total
DISTRICT VII
Baker Calhoun Clay Decatur Dougherty Early Grady Lee
o
o
180 5
5,450 3,280
10 3,140
150 2,100
JS
14,330
517 200 975 901 500 1,095 667 1,111 661
995
20 2,210
20 7,240
5 5,600
390 7,950 1,060
15 570 9,420 50 1,350 1,550 940 680
39,130
200 994 850 991 400 989 149 946 788 533 1,033 1,145 280 815 634 902 812
981
1~,910
5,900 . ~,240
370 3,010
330" 2,630 3,05c.
290 4,610
30
34,490
1,211 829 904
1,319 951 558 159 190 662 876 533
985
15,150 17,200 11,890 17,010 6,070 33,580
8,670 15,910
(Continued)
1,130 1,321
1,158 1,254 1,050 1,197 1,077
1,104
o
93
1
5,316 2,955
5
3,438 100
2,334 10
14,25~
4
2,251 11
7,172
2
5,540 292
1,520 835 8 589
10,784 14
1,181 982 848 593
38,638
15,712 4,894 1,121
488 2,920
184 1,995 2,411
192 4,038'
16
33,971
17,119 22,721 13,168 21,324 6,373 40,186 9,336 11,635
. ....,;. ~
;1:"
'0.-'" .,'
'f..
. .'.
" "
GEORGIA lDNUTS PICKED AND THRESHED - 1956 CROP
,.(!h!S! !s~i~~e! !I"~'~Ii!f':Ig En_the.l!t!s~ !"!1!~1! ~a~a_~9_~~_p!e~s!yl.
District' and __ ...Cgunt;I
':' H t d A
: Yield Per Acre .0:' , Production
:. _ ~e~ ~ _ :r:s. :. __ !Pg\JDd>' _ :. '!OQO.Pgundt ,;. _
DISTRICT VII (Cont'd)
Miller Uitche11 Quitman Randolph Seminole Stewart Sumter Terrell
Thomas
Webster
20,160 21,170 4,270 22,220 13,090 8,350 15,860
23,380 4,550 9,090
1,464 1,347 1,018
1,193 1,244
869 1,214 1,213
922 1,142
29,510 28,518
4,347 26,502 16,286 ,7,254 '
1.9,254 28,359 4,195 10,384
Total
267,680
1,201
323,071
DISTRICT VIII
Atkinson Ben Hill Berrien Brooks Coffee Colquitt Cook Crisp Dooly
Irwin Jeff Darls Lanier
Lowndes Telfair '
Tift
Turner
Wilcox Worth
240 6,870 1,910 4,620
3,450 9,510 2,210
14,150 18,340 15,570
90 10 600
3,300 12,380 20,000 12,510 29,520
1,212 1,233 1,200
1,091 1,138 1,235
1,456
1,564 1,234 1,426
989 700 975 874 1,330 1,204 1,260 1,245
291 8,468 2,292 5,042 3,926 11,748 3,217 22,124 22,637 22,196
89
7
585 2,883 16,468 24,087 15,763 36,761
Total
155,280
1,279
198,584
DISTRICT IX
Appling Bacon
Bryan
Evans
Pierce Tattnal1 Toombs Wayne
300
15
140 790 15 1,040 1,780 10
1,127
867 1,157 1,014
800 1,124 1,028
900
338 13 162 801 12 1',169 1,830
9
Total
4,090
1,060
4,334
STATE
515,000
1,190
612,850
-- --- -- --- -~ ---- - -~ - ~ - --- - - -~ - -~ --~ -----
CARL O. DOESCHER Agrioultural Statistician
ARCHIE LANGLEY Agricultural Statistician In Charge
\..,
.
31!J-
__~JRi<GtfA-.C~(Q)lP'~~ THN~. SI~Vll(c[
AGRICULTURAL EXTENSION SERVICE UNIVERSITY OF GEORGIA AND THE STATE DEPARTMENT OF 'AGRICULTURE
Athens, Georgia.
,.,
SEP17'59
LIBRARIES
u .. s. DEPARTMENT OF AGRICULlURE
AGRICULTURAL MARKETING SERVICE
318 EXTENSION BLDG., ATHENS"GA.
September 14. 1959
GENERAL~ROP REPORT AS OF SEPTEMBER I. 1959
Prospects for mO$~~crops In Georgia either held, t~ir own or improved during A~gust with the excepttO~ of cotton. Hot, .dry.weather in portions of. central and northern d'~tricts reta,ded vegetative growth and. caused rather heavy shedding of squares and,small bolls~ Although the current season has not been as favorable as 1958. the yield per acr~~for most major crops this year now promisesto be second only to.las~ year's record high yields.
GOOD CORN CROP: Current indications point to the second largest corn crop ever
produced In the State, the Georgia Crop Reporting Service said today. Production is now forecast at 79,056.000 hushels. a decrease of 7,696,000 bushels or 9 percent from last year's record crop of d6.752.000 bushels. The yield per acre of 27.0 bushels also. promises to be the second highest of record. bei~g surpassed 'only by, the .195u record yield of )2.0 bushels. The decline in yield prospects from last year is due primarily to a lack of moisture at various times during the growing season.
ABOVE AVERAGE PEANUT CROP': The production ~f peanuts in Georgia this year is fore~
.
. cast at 562.500.,000 pounds. 8 percent below the 1958
,crop, but approximately 22 million pounds above average. The yield per acre at
1.125 pounds will be second only to last year's record high yield of 1,190 pounds
per acre. Harvesting of this year's crop progressed rapidly the last half of
August under generally favorable condltlons~. The acreage for picking and thresh-
ing is estimated at 500.000. three percent below a year ago and 21 percent below
average.
LEAF PRODUCTION UP: The State's flue-cured tobacco crop. currently estimated at
106,500,000 pounds. Is nearly 19 percent larger than last year's crop of '09,610.000 pounds. The estimated yield per acre of 1,500 pounds
is.only 45 pounds below the record 1958 yield of 1.545 pounds. The increase in production over last year is due to a larger acreage as Georgia farmers harvested 71,000 acres this year compared with 58.000 acres In 1958,
AVERAGE PECAN CROP: Indications on September I pointed to a pecan crop of )6 million pounds. 9 million pounds less than production last year.
but slightly above the 1943-57 average of 35,370.000 pounds. The crop Is unusually light in the Albany area. Prospects in central and northern counties are general-
ly fair to good. Damage from scab to susceptible varieties has been heavy again this year. especially Schleys and Moneymakers.
GEORGIA
CROP AND
UNIT
: ACREAGE:
:
(000) :
YIELD PER ACRE
: TOTAL PRODUCTION (OQO)
. 1959 : Average : 1953 : Ind I cated: Average 1958
. : 1940-57 :
; 1959 : 1948-57
: Indi: cated
Ll959
CORN. AII .. ~.bu.: 2.928
18.5 32.0
27.0 54,176 86,752 79,056 .
WHEAT
bu.: 100
16.7 23.0
21.0 2.099 I ,633 2.100
OATS
bu.: 259
28.0 33.0
]2.0 11,412 9.108 U,283
",!BARLEY ...... bu.: 13 bu. : 16
23.9 29.0 10.0 12.5
29.0 12.5
189
290
377
78
162
200
HAY, ALL .. tons~ 632
.73 1.02
1.01
679
641
636
TOBACCO.ALL ... lbs.: 72.1
1.248 1.540
1.498 119,353 91.018 107,985
POTATOES.IRISH.cwt.: 4. I
46 46
53
312
222
215
POTATOES,SVEET.cwt.: 10.0
42
48
45 1,137
528
450
~OTTON ...... bales: 660 1/ 284 1/ 443 1/ 418
655
352
575
PeANUTS(P&T) ... lbs.: 500 - 866 -I ,190 -I .125 540,052 612,850 562.500
SOYBEANS
:
for beans ... bu. : 82
II. I 12.5
14.5
536 I ,125 I ,189
SORGHUM
for grain ... bu.: 33
19. I 24.0
24.0 1/ 581
888
792
PEACHES iotal Crop .. bu.::
2. 101 I.. ,000 3,200
PEARS
Total Crop .... bu.: PECANS. . . . . .. Ibs:
147
98
85
35,370 45,000 36,000
PASTURE.CONDITION %:
72
85
76
1/ Pounds 1/ 1953-57 average
ARCHIE LANGLEY Agricultural Statistician In Charge
CARL O. DOESCHER Agricultural Statistician
I
.... _ _ ~\._-..-.,..
UNITED
STATES ~
GENERAL ,CRO.P,R;. EPORT
AS
OF SEPTEMBER ~,~.
I,
1.959
To ta I crop prOduc t ion jus t und~ r I as t' 'y'ea r I ~ '''~t~n~ I n~i', r'eco rd now' seems
~)
likely, gIven succe'ssfu'J ,harvest of fall maturing crops. 'late" 'season crops 'develop
ed rapidly during August heat and virtually all a~e expect~d to mature by average
frost ~ate5. Lack 9f moisture threatened many localities during AU,gust, bvt most
sections were favored by timely showers.
' .. , ,
I
f9.B!!: Production of all co"," 'i'~"iorecas:t at a record of 4,382 million bushels, up
5 percent f.rom the August .1 forecast, 15 percent above the previ-ous record
last year and 35 percent above. average... Declines during the mooth in Mirinesota, '
North Dakota, New Yor~, Texas, Arkansas, and some of the f~r western States were
far more than offset by Improvements,. ,inmost other.states .. The 'indicated yield per acre of 51.9 bus~1s Is an al.I-.time. r~cord '~tigh, b'Jt .only slightly above the
previous record last year. The Dakotas aild Montana',.are the, only Sta.tes with below
average yields this year.
PEANUTS: Based on cond It Ions abol.,lt~ 5epte~ber, 1 ,the' product,ion.-pf Pea'nuts for
'picking and threshing 15 estlmate~ at 1,710 mi 1J i.on pou.nd,s,,; about one
percent, below the August 1 forecast. A decl ine In pr.o,sp'ect.lv~ production for:,
Virginia and Texas was partially offset by higher production ~~tlmates.for South
Carol'ina, Georgia, Flo,rlcta. 'a,,~ New Mexl~o.
,
..
PECANS: Production Is forec,%t at 132 million pounds. 24 percent below last. year
and 12 percent below average. Prospective production is down from a month
ago as: the result of declines in Oklahoma. Texas. Arkansas, and North end South Carolina- which more than offset Increa,ses. In Georgia and' Louisiana. Prospects. are for more seedling pecans than la~t year but fewer Improvad varieties. All States east of the Mlssisslppl'Rlver expect a smaller crop than, in 1958 while
west of the Mississippi all States except Texas expect a larger crop.
. . PEANUTS PICKED AND THRESHED ' '
;" .
- - - - - - - - - :_-_-_-_-if~..Tf4-e!.-!c!.e_-_-.:::.-_-_-_-_-_-~-fr!!.dE.c{f!!.n_-~~_-_-_-_
State
: Average: 1958 : 1959 : Average: 1958
: 1948-57 :
:
:.. 1948-57: .
: 1959 :
.. , . ' 1 ,000 1 ,000 1 ,000 - - - - - - ' - - - -p, - - - - - - - - - - - - - - - - - - - - - - - - :... - ....... - - -
'"..
: Pounds f.2.u.!!&! Pounds po~nds pounds
pOlJnCls
Va.
1,736
2, 100
2,000 217.107 220,500
210,000
N. C.
1.382'
1,860
1,800 284,998 ' 331 ,080
'320,400
Tenn.
785
850
900
2,542
2,550
1,800
S. C.
799
1 060
1, 100' 11,208
1'3",780
13,200
GA. Fla.
866
'----;-~-:~~--S97
1, 190_~~ J~ 125
1,.120
1,025
540,05Z. 6ll.,850
5i 1192
58,2/.0
562,500 51,250
'Ala. Miss.
: 838 386
1,060
925
400 " 425
225,593 221,540
3,074 ., 2,400
185.925
. 2, 125
Ark.
395
450 .
450
2 1 380' . 1.800
1,350
Okla.
657
1,075. - 1,025
97,751 133,300
120.950
Texas
508
730
725 193.061 224.110
229.100
N. Mex.
,
.
1,140
1,950
1,950
7,067 ' ,13,650
11,700
- _U.-_S-_. -_-_-_-_-_-_~_-_-_-9_0-2_-_-_-1_,-2_0-5_-_-_-1_-,1_4-3_-_-1._-64_-2,_-50_-2 _-1_-,8- _35-_,8-_00-_-_-1_,-7_1-0a.3-0.0_
.
PECANS
_~- _- _S- t_at- _e-_-_-_-_-.::_ .- _.-__- ~-v-.- !-r- .!-g-.A!-- l1l-9-V~l- Ja::r-- .i5.e- 1-t_i- -e1s- .- --- P--r- o-d1- ~u-5c- ~t-i- _o-n- _--.:..--_-l-nf--4. i- -a- -!.e~-f4-.- .~ !-9,- 2-9- _-'_-_
Thousand Pounds
N, C.
:
2.023
3,200,. 1.100
S. C.
GA.
;,
:
3,640 ' .
.
8.000
..0 3 ,600.
\'
:I
35.370
'~II.'
45.000" :.:,""; 3.~,~00
Fla.' A1a . ~
:
4,860
,..
. 2.600
:.
16.688 >
'. 37 ,600
2,SOO L l' 7 ..000
Mis s . ' ,Ark; . !
: : t:'
9,51 5 :' ,', 5.549c!.,r
16.000 I" 2,350
- 4.700 :.'~: 5,500'
La. Okla."
:
16.490
14.000,
20.000
:
18,620 " '~,
,,: 15.500
'.,( 21.000
Texas
!!._M.!x~
:
35,040
~ .:..
3..t.010
,':;.-:
26,000'"'" 26.000 ,
~,.20.Q,
.~ .20.Q
_
, -=~U~ ~'" _ .. = =:z i.: = .1~0=5ll_ -= =_ -= =II: =~7_Z52 .... _ .. :l3ll0~ = =
.
: ,I.
01 .....
-.315
CGE(()).J~GllA (C~q~E~'IlF?G
I AGRICULTURAL EXTENSION SERVICE 1. ,UNIVERSlrV OF GEORGIA ANO THE
STATE DEPARTMENT OF AGRICULTUR
Athens,. Georgia
.
SEP 1 5 '59
~1rllNCG [~VllCJE
U. S. DEPARTMENT OF AGRICULTURE AGRICULTURAL MARKETING,SERVICE
318 EXTENSION BLDG., ATHENS, GA.
September 14, 1959
VEGETABLE CROP REPORT
September 1, 1959 I
UNITED STATES: Production of fall vegetables in 1959 is expected to be 12 percent
smaller than i'ii'n.58 and 13 percent below average, the Crop
Reporting 'Board announced tod~. Estimates prepared as of September 1 usually
tor B,c.co'uilt abolit four-fifths o 'the total fall 'production. . Substantially' sm;:ilI'ar' crops than' last 'year are' in prospect' foi'""cabbage, carrots' and-lettucEt. "'Pro~, ,
duction of green peas and cucumbers is expected; to be slightly larger than in :'
1958.'
.
Unusually warm and humid weather covered most of the Nation east ot the
Rocky Mountains~during the last half of August. This has made it difficult to'
control insects and disease, and as a result, quality of some yege~~bles has been
,lpwered.. 'Rains near the end of August and in early beptember benefited most
crops although some were damaged from too much precipitation.
'.
Planting of fall and winter crops is making normal progress in most areas. , Seeding and transplanting are active in Florida. Early fields are making good
growth. Late August rains brought needed moisture to the fall and winter vegetable areas of Texas and growers made good progress getting crops in. Planting of winter crops is active in the Desert and Southern California areas.
LH1A BEANS: The final forecast for the summer producing States is for a crop of
202,000 cwt., '18 percent below last year and 35 'Percent below
average. The New York crop made, normal progress despite earlier unfavorable weather conditions. Peak harvest is past in all commercial areas of New Jersey and ~eptember marketings are expected to be very light. The North Carolina crop did not turn out as well as expected earlier because of heavy vegetative growth
and excess shedding during August. Light harvest continues in Georgia, but will
be completed by, mid-September.
fJNAP BEANS: The final forecast of summer production, at 1,4715,000 cwt. is about
the same as last year and average. Supplies from the New England
States ar.e expected to continue, moderate until the end of September. Volume
harvest continues in Upstate New York after reaching a peak in August. Light
movement will continue from Long Island through September. Supplies are declin:j.ng
iii"Fennsylvama after' ,th'e':pealC'l'aovement of. August 1.5..'25. ,Beans in Ohio made
good progress despite the -effects, of too much"rain in some areas and dry weather
in other seotions. Light to moderate supplies remain to be harvested in Ohio as
well as Illinois. Dry weather in Nichigan has reduced yields and harvest will end
about mid-September. Favorable weather conditions prevailed in most Virginia
areas and remaining supplies are limited to production from the late fields.
Harvest is nearly over in North Carolina and Georgia. August rains in the Noun-'
tain, City area of Tennessee were beneficial, but too much moisture on the Cumber-
land Plat.eau has lowered quality. ' ,Beans, w;ill 'be a.v:ailable fro.U1 both areas uritil
October 1. Dry 'weather, reduced. the, Alabama .erop,.b,e1ow, earlie!' ,'expect,at;i.on and
present supplies are light. Peak harvest is over in Colorado, but supplies will
remain fairly stead;y through most of September.
'
CABBAGE: The final forecast of the late Summer crop places production at
3,530,000 cwt., 8 percent O'erow last year and 11 percent less than
average. , ,In Pennsylvania, continued dry weather in the ~ie-Crawford County area has reduced'yields. However, rains in central and southern counties the latter part of the month were beneficial and good yields are reported. Weather in Indiana and Illinois was generally favorable during August. In Iowa, hot weather during the last half of August was unfavorable, particularly for late fields. August weather was favorable in North Carolina and the crop continues to make good progress. Harvest in Georgia was finished by mid-August. Movement from Colorado is expected to be relatively heavy during September and October tapering off sharply in November and ending in early December. In California supplies are ample for local markets.
CUCillOERS: First forecast for the early fall crop places production at 526,000
cwt. This is 4 percent above~ 1958 crop and nearly a third above
ave~age. The larger acreage than last year in Virginia and South Carolina more than offset the slight reduction in Georgia and Louisiana and total acreage for
the 5 States is 11 percent above last year. The crop is making good progress in
South Carolina exce~t for some areas where dry weather retarded growth. Harvest is expected to get underway late in September. In Georgia dry weather has
limited stands in some areas. Little harvesting is expected before September 15.
Volume harvesting in Louisiana is not expected'until after mid-September.
I
(OVER)
_ _---_ _--- Acreage and Estimated Product~on Reported to Date, 1959 with comparisons
...
..
CROP
AND. STATE
I I ! ACREAGE FOR HARVEm' ; YIELD PER ACRE !
~...- .. -' '-'j .__ . '."-' - .-;-....----. "+'--"--1-- -"-'-',---','--
---P-BTOD-U-cr-IO-N-r-
--
:Average ; 1958 ; Ind. Av. : 1958; Ind. IAverage ~ 1958 Ind.
,1949-51 1
1 1959 .49-57 I
! 1959 ,1949~'l..l-. . _._-.....J.259._.-
- Acres -
- CWt. -
- 1,000 cwt, -
LIMA BEANS: S\IIIDer
New York , .: 1,540
600 550' 43 40 40
65 24
22
New Jersey, .: 1,960 1,300 1,400 32 35 27
61 46
38
Ohio , , , : 580 MarYland . ': 1,130 No~hcarolina: 1,410 Georgia, , . : ~ 620
Group Total : :306
--- --- 36 900 800 . 26
1,600 1,600 22
=to 94:
100 122
~ .
2158 .
SNAP BEANS: S\llllDer
New Hampshire. : 280
:"
280 269 ~,
Massachusetts.: 1,330 1,400 1,500 35
Rhode Island .: 260
220 220 36
Connecticut . : 1,090
950 1,000 35
New: York,L.I, : 2,880 1,100 1,300 42
New York,Upstat 10.140 11,000 11,000 42
Pennsylvania.: 2,980 2,300 2,200 43
Ohio .. : 3,310 3,900 3,800 40
Illinois , . ': 1,210 1,300 1,200 28
MilCh1gan . : 2,530 2,100 2,800 31
Virginia . . .: 660
150 750 30
North carolina: 1,400 Georgi's. . . : 2,020
6J 800 6J 500 1,300 1,200
34
28:
Tennessee . : 1,620 1,400 . 1,300,. '36
Alabama : 1,290 1,200 1,200 22
Colorado . . : 810 (.~oo 700 4~
GroUR CABBAGE
Ty otal 40,530
' 37720
36,950
-
3
-- -28 2,
30 20
2221
20 23
21
29 25
20
33
48
32
103 312'
r~.
.~
40 40
10 '11
40 35
41 56
40 40
9
9
40 40
31 38
40 45 .' 111 ' 44
42 42"f '451 462
4.5' 45 - 1.28 lO4
35 40
133 ].36
33 30, 35 43
31 30
71 84
35 35. 20 86
40 45' 251 272'
28 30.,.; 56' 36
45 42
58 63
25
23. ~ 28
30
~o ~o :90
i , L~
~
1.,
11
52
9 40
58
462 . 99
152
36 84 26 292 36 55 28 ~
1,4
Late S\DID8r: :.
Pe.~sy:1van1a .: . 4,180 '),600 3,200 119 185 180
151 666 576
Indi'ana . ',: 2,130' 1,700 1,500' 139 215 180
288 366 270
Illinois . . ~: 2,'700 2,900 2,9'00' 181 205 190
486 595 551
Iowa . . . : 910
800 750 143 160 110
140 128 128
North carolina: 4,19Q 3,100 3,600 144 160 160
602 592 576
Georgia . . . : 730
600 500 93 100 110
68 60
55
Colorado . . : 3,270 2,700 . 2;~ 242 220 230
796 594 506
New Mexico . : 330
--~ -. :_~- 108
36
Washington, : 1,530
900 'l~OOO 181
261
CaGlriofUoDrnTiaotal,: =2*,3~10*
2,100
.1 I_X
el2i ,1-=00*
2~2 Ci
_. _
4S'
_._
'_A
~ --
x:::r _ B_a
.-
A IC-..A
CUCUMBERS
Early Fall:
Virginia gj.: 2,350
2,900
South carolina: 820
1,200'
~orgia . . : 510
Louisiana . : 860
C aGlriofloIOr nTi ao t a l :: - +; O0
-,~-,.,..,...
6-,0~.-..-.
.-;
-8-9
-8,-i
Y!I.
Includes
proeeseing.
.r
.
Short-time average.
1 4-<""-1 -5,0-8 ..
ARCHIE .LANGlEY
Agricultural statistician In Charge
L. H. BARRIS,JR.
Truck Crop E8t~tor
"
3 i_.~ -.- .,"\.
,:;:'7;"-1 GE ORGIA CROP RE POR TING SER VICE
,4'. '1 t'.
.: .,. a . .... ll. , . I '.': '" '. ,~:
,/(a '","'. .,...,-.....,.. .. { . ,., I
,.. (' I ., t. J
~~. ~
I .a. ~"'I
II'" ~.i,.'A.
. ,_ .~.~...~ ..~;".., . 'lt \'.\..~.""
.t'~
,~,.
t
I
t
j
,
."~
~.~. .....
')..
'. .. '." .". ..I..... ii
I ,: T "
.' ~
\ .\' 1\ -. ~
r .""'t- il'.' - t ..: l', ..'. 1 '.:."..t......;.-. 4',a..
~\''l,\..
I
\;Y EEJ<
J-J
SEP 18'59
Released:
.'
GEORGIA CHICK HA TCHER Y REPOR T
LlBRAf?lf
5/~-
Athens, Ga., Sept. 16 -- A total of 4,668,000 broiler chicks were placed
with producers in Georgia during tbe week ending September 12, according to the
georgia Crop Reporting Service. This compares with the 4, 812, 0.00 placed the
previous week and is 7' percent less than the 5,023, 000 placed the same week
last year.
'
Eggs set by Georgia hatcheries amounted to 6, 141,. 000 compared with 6,373, 000 the previous week and is 16 percent less than the 7,298,000 for the corresponding week last year.
The majority of the prices paid for Georgia produced hatching egGs were reported within a range of 45 to 60 cents with an average of 53 cents for all hatching eggs and .51 cents for eggs purchased at the farm from flocks with hatchery qwned cockerels. Last week the range was from 40 to 60 cents with an ave'rage qf 52 cents for all hatching eggs and 49 tents for eggs purchased at the farm from flocks with hatchery owned cockerels. Most prices charged for chicks
were reported within a range of $8.00 to $9.00 with an average of $8. 25 per ~undred compared with a range of $7. 50 to $8. 50 with an average of $8. 00 per hundred last week. The average prices last year were 66 cents for eggs and $10.75 for chicks .
. Weighted average price from the Federal-State Market News Service for
broilers during the week endin.;; September 12 was Georgia broilers 2 3/4 -
3 3/4., pounds at farms 14. 85~.
I I ., GEORGIA EGGS SET, HATCHINGS, AND CHICKS PLACEMENTS'
BROILER TYPE
EGG TYPE
Week J;:nding
Eggs Set!!
1958
1959
1959 %
of 1958
Chicks Placed for Broilers in Georgia
Eggs! Set IHatched
1958
1959
1959 %
of 1958
1959
1959
Thou. Thou.
ercent IThou. Thou.
ercenti Thou. Thou.
,tu1y 11 july 18
July 25
Aug. 1 Aug. 8 ~ug. 15 Aug. 22 Aug. 29 Sept. 5 Sept. 12
8, 771 8, 560 8,254 8,302 8,010 7,448 7,294 6,968 6,971 7, 298
8,741 8,337 8,231 7, 771 7,419 6,932 6,775 6,485 6,373 6, 141
100 6,869 6, 573 97 6,340 6, 554 100 6,329 6,398 94 6, 193 6, Q33 93 5,969 5,807
93 5,868 5,730 93 5,660 5,370 93 5,493 5, 331 93 5, 179 4,812 84 5,023 4,668
96 I 96 191
103 I 165' 61
100
131
~38
97
192 . 72
97
212 124
98
205
97
95
212 144
97
161 168
93
91 154
93 I 149
166
1/ Includes eggs set by hatcheries producing chicks for hatchery supply flocks.
ARCHIE LANGLE Y Agricultural Statistician In Charge
W. A. WAGNER Agricultural Statistician
-------------------------------------------------------------------------
"j. S. Department of Agriculture
Agricultural Extension Service
Agricultural Marketing Service
State Department of Agriciliture
319 Extension Building, Athens, Georgia
-------~----------------------------------------------------------.,------
STATE
.
.
-'
EGQS SET ANI) CmCKS PLACED- IN COMMERCIAL AREAS. BY WEEKS'
.,
,
"
.,
, "
"
'
.,
.'.
,
Week Ending:
'
,
;
Aug. ' , Sept. ' Sept.
~9
~
,
5 ' ", lZ,
Aug. : Aug.
8
15
~ug. , Aug.
,'~Z
29
Sept. 5
:
EGOS SET ,- THOUSANDS
CHICKS pLACED - THOUSANDS
,
.
Sept. , ,Il "
"
,,
Maine Connecticut Pennsylvania Indiana Illinois Missouri Delaware MarylanC:l Virginia West Virginia North Carolina ~outh Carolina GEORGIA
Florida Alabama Mississippi Arkansas Louisiana , Texas Washington Oregon California
TOTAL 1959
0'
TOTAL 19'58
1959 %oi 1958 '
. 513
I, 099' ',' 1. 023
129
146
141
,I, 100
916
1,554
1.303
190 . , 112
1.059
1,202 162 "
1,'33?, 1.171 , 2,568 .' 1,352
1,294 I, 138 2,708 1.289
' 1. 1Z4 I, 175 .,
. , 2,616 -.'
1,404
Z37 2.784
387 6,485
- 196
233
2.961
. 2.935
385 '
387 ,
o
6,313 ' 6,141
283
401
368
3.38,6
3. 106 ' 3, 100 ,
2,451 ' 2, 318 .. : 2,354
3,300
3, 122
3, 14'6
523
477
412
Z,22S
2, 172
2,2Z"1
317
303
278
259 o. . 253
279
1,084 , 1,332
1,478
-
1. 16'3
. 410
.'
6'73 136
130
857
I, 513
Z,033
, r. 116
' ' '445
2., 5:51
348
,: 5, 807
158 3,098 2.0453.287
374 ,2,014
335 165
959
34, 23(J ~ ',34, 130
. 33,904 , . ,
,
30, 3-37
37,908 .0' 31,213 " 38,815
' 32,003
90 '
92
81 ..
.. 95
1.054 48'5 151' 791 '.
103 815 I, 142. 1.182 1.009 52-8 2.,660 292 5,730
'l77 2.913 2,16,9 3,077
413 2,073
340 186
878
980 1,048
.. 420
469'
859
714
,.161 , ' 110
138
100
805
768
1. 607 I, 569
1,967 1,934
1,060 1.001
463
486
2, 581 2..396 272 ' )03
5,370 , 5,331
205 3,019 2,035 3,024
366 2,028
292 161
888
170 3,034
1,780
2~869
391 1,975
277 ZOO
. 800
30,"034 31,232
96
29,307
..
30,02'5
98
,28,325
28,883
,
: 98
1,061 421' .
, 114 ! 604 i 156
838 -352,
124 633 111
I 724
627,
1,32.6 1,419'
1, 871 I, 718
984
896
467
386
2,405 2, 355 2.63 " 257
; 4, , 81Z 4.668
213
234
~ Z. 906 l, ,568
' i, 664 " "'1, '618'
,2,769 2,657 ,0 366 ' '3'18
1,870 '.I, 895
317 , 121
282' 177
839
852
:
eo.
,
26,939 25,585
2.8. 111 , 27 .2Q5 ...
~
I
96
94
,
" "
<GE(Q)~GllA C~((J)~
TnN<G S[~VllCE
, AGRICULTURAL EXTENSION SERVICE UNIVERSITY OF GEORGIA AND THE
STATE DEPARTMENT OF AGRICULTURE
UNIVERSITY OF GEORGIA
U. S. DEPARTMENT OF AGRICULTURE
2 2'59 ~rp
,AGRICULTURAL MARKETING SERViCe: 31i EXTENSION BLDG., ATHENS, GA.
AtheIls, Georgia
l . , September 18, 1959
"
,
'
This summary of poultry information on hatchery production, poultry
slaughter, egg production. pertinent price data and end-of-month storage stocks
is being furnished you in a condenlled for~ ~o ena1)le you to have a ready current
reference.
.
.
POULTRY SUMMARY, AUGUST 1959
Item
During August ';/0 of
19581_/, 19592- lyaesatr
,Jan. through Aug.
1958I~I' 19592_/
% of
last year
ThQu. j
Thou. Pet.,
Thou. . .Thou. Pet.
Chicks Hatched b; Com-
mercial Hatcherles:
Broiler Type Georgia U,nited State s
.,
26,248 24,670 153,013 145,430
941 219,975 233, 363 106 95 1,274,800 1, 309;'487 103
Egg Type Georgia United States
585 14,825
587 100
7,932
13,024 88 527,074
13. 501 170 490, 326 93
Commercial Slaughter: 3/
Young Chickens Georgia . United States
30, 131 29, 519 981 194,316 1,99,'786 103 155, 540 154,998 100 1,002,200 I, 102., 838 110
Hens and Cocks Georgia United States
442 13,063 '
543 123 8,474. 65
2,539
3,'510 138,
Egg Production:
Mil.
Mil.
Mil.
Mil.
Georgia
109
130 119
889
1,051118
South AtlanticY
482
540 112
4,112
4,634 113
United States'
4,693
4,731 101
41, 156
42,752 104
2r 1/ Revised.
Preliminary. 3/ Federal~State Market News 3ervice--For the
pur.pose of thisreport a commerCial po-ultry slaughter plant is defined as a plant
which slaughters a weekly average of at least 30, OOO'pounds live weight while in
operation. (Converted from weekly to monthly basis.) 4/ So~th Atlantic states:
Del., Md., Va., W.v.a., N.,C., S.C., Ga .. , .t~la.
,
MID-MONTH
PRICES
RECEIVED
AND
PRICES
P.
A
,
I
D
i
. ~ --
Georgia
United States
Item
.." '.
-. '" ~. " , I, I
Prices Received:
Farm Chickens (lb. )
Aug. 15 July 15 Aug. 15 Aug. 15 July 15 Aug. 15
1958
1959
1959
1958
1959
1959 . !
Cents 14. 5
Cents C.:mts
13.5 12. 5
Cents ,,
14.0
Cents Cents
"
,I
j
-.
.
.-
.,.
10.8 10.2
Com. Broile:.-s (lb.)
16.6
15.0
14.5
17.6
16. 1
15.7
All Chickens \lb. )
16.5
15.0
14.4
17.0
15.,4
14.7 "~l
All Eggs (dozen)-
47.7 40. 5 39.8 37.7 30.2 30.9
Prices Paid: (per 100 lb. ) Dol.
Dol.
Dol.
Dol.
Dol.
Dol.
Broiler grow. mash Laying mash Scratch grains
5.20 4.95 4.45
4.85 4.75 4.20
4.75 4.75 4.20
5.11 4.58
4.00
4.85 4.47
3.93
4.83 4.44
3.93
-.-.. ---------------- .. -._---------.-------------------------------------
For this project State funds were matched with Federal funds received from the Agricultural Marketing Service. USDA under Provisions of the Agricultural Marketing Act of 1946.
--------- . . --------------------------------------------------._~---------
......~,.-.. ~ .,'1 .. ..... '1 '
.
. . ... , , ~.,
..t , , ~"t
'.. ~tt ,_~, , '.
-
~-.. "' .
End-of-Month Stocks of Poultry, Poultry Products, Meat and Meat Products, United States
Shell eggs: Decreased by 147,000 cases; -!\ugust 19'58 decrease was 218,000 cases; average August decrease is 351, 000 cases.
Frozen eggs: Decreased by 4 million pounds; August 1958 decrease was 6 mil-
lion pounds; average August decr~ase is 12 million pounds.
'
Frozen poultry: Increased by 26 million pounds; August 1958 increase w'as 49 million pounds; average August increase 'is 25 million pounds.
~: Increased by 1 ~illion pounds; August 1958 increase was 6 million pounds; average August increase is 2 million 'pounds.
Pork; Decreased by 65 million pounds; August 1958 decrease was 24 million pounds; average August decrease, is 64 million pounds.
Other meats: Decreased by 14 million pounds; August 1958 de,crease was 9
.
million pounds; average August decrease is 10 million pO,unds;
Commodity
1 I Unit
August
August
,1954-58av., 1958
Thou.
Thou.
July 1959
Thou.
A~g:st-!!
1959
Thou.
Eggs:
Shell
.
Frozen eggs. total ..
Whites
.
Yolks
.
Whole or mixed.....
Unclassified......
Total eggs2 / (case eq. ).
Poultry, frozen:
Broilers or fryers .....
Roasters .............
Hens, fowls ..........
Turkeys
~ ....
Ducks
.
Unclassified.. ,
.
Total poultry.........
Beef: Frozen, In cure and cured....', ..
Case
1,080
494
888
741
Pound 161,433
do.
48,832
133.777 44.571
152,105 38, 564
147.803 36,083
do.'
38,493
34,902
41. 537
37,726
do.
66,030
48,357
64.314
65,440
do.
8,078
5,947
7,690
8,554
Case ~---5--,2-5-5-------3-, -8-81-------4-,-7-3-9------4-,-4-8-3----
~------------------------------------------
Pound 16,309
18,485
26,075
25,650
do.
5, 575
3,090
9.361
8.989
do.
32.917
39,492
52,037
57,54Z
do.
71,415 103. 562
66.885
84,354
do.
11.275
6,860
8, 108
10, 169
do.
28,354
24, 713
33,972
35,471
do. ~--1-6-5,-8-4-5-----1~9-6-,~2-0-2---,-1-9-6-,-4-3-8-----Z-2-2-,1-7-5----
-----------------------------------------.-
do.
114,605 117.850 164, 6~8 165. 876
Pork:
Frozen In cure Or cured
.
'. do. . do.
122,951 '66,475
99, 173 49,955
198,067 50.285'
140, 100 43. 135
Other meats and meat products ...........
Total ,all red meats ....
do.
66.477
65;743
99,473
85.960
do. --3-7-0-,-5-0-8----~3-3-2-,7-2-1-----5-1-~-.-5-2-3----4-3-5-,-0-7-1----
-11 Pre1imTnary. 2- 7 Frozen eggs converted on basis of 39. 5 pounds to the case.
ARCHIE LANGLEY Agricultural Statistician In Charge
R. R. HANCOCK- W. A. WAGNER Agricultural Statisticians
t ............
.
-------- ...------------- _...
----~---- r,',-,.----------.---
CEOIRGHA C~OJP ~EP',Q~'fHNG SEIRVHCE g/5"
A<:;RtCULTURAL EXTENSION SERViCE .. UNlVERSITY OP' GEO'UJ lA' AND THE " .
'S-TATE DEflARTMENT OF 'AGRtCULTURE
U. S. OEPARTMENT OF AGRICULTURE ':AGRICULTURAL MARKETING. SEllV,lC:J.:, .
, . I:'~ IlXTE"'ON .LOG., ATHENS. GA.
Athcms, Georgia"
September '18, 1959' ".,: :,.~::
'~. 'r
PULLET CHICKS FOR BROILER HATCHERY SUPPLY FLOCKS
': .... , .' .
August '1959 "'United States ,"
", The indicated domesti'c placement or-pullet chicks for broiler hatchery
supply flocks by leading primary breeders of broiler replacement stock totaled:
1,706,000 chicks duri~g August 1959. T,hie was ~1 percent le8s than domestic plac;:'etnents of l', 486"000 chicks in Augu.t 1958.: Total placements ~domestic plus exports) were re'ported at 1, 834~ 000 as c!ompared to Z, 668, 000 a year earlier.
f.".'
I
.,
..
The placement data include 'pullet chicks sold during th~ month, plus the
number of pullet chicks expected from eggs sold during the preceding mOl\th. The conversion from eggs to"'~xpecte"d pullet chicks was made on the basis' of lZ5 pullet chicks'per case o{h'~cl\ing eggs sold. Th.e primary breeders in-:; elude'd ~n this' report account for' a very,large percentage of ,total supply of'. '.. ',
replacement pullets for broiler hatchery supply, flocks. Sales of replacement: .~ .
pullets br these breeders provide 'an indication of the potential number of pullets
;lva,ilable tor ~ddit~~n to hatchery egg suppl'y', floc~. s,e.veral mont~. befC?r~ tl:t~..._
pullets will, actu~lly move into the flocks.
'
pui~~t ..Chicks 1/ Placements ,for BroUe~ Hatchery Supply Floc'ks' .,.', '\
. ' - (Repo~ted by leading br~eders)
.
'" Month
1957 , Thou.
Total 1958 Thou.
1959 Thou.
1958 Thou.
Domestic
1959
1959 as 10,
of 1958, '
Thou. Percent
January. . . . . . . . I, 886
1,98Z Z,IZ4
1,84Z
1,884
10Z
February. . . . . . .. 1, 997
Z, Z81
Z.414
l, 16Z
Z,Z56
104
March. . . . . . . . Z, 538
3, 13Z
3,450
Z,997
3,Z09
107
April. .. .. .. . 3/033
3, 331
3,765
3, Z34
3,,573
110
May. . . . . . . . . Z,899 June. . . . . . . . . .. Z,060
3,641 3,409
3,007 Z,575
3. 5ZZ 3, Z34
Z,861 Z,39l
81
,,
,
74
July. . . . . . . . . . August. . . . .. . .
I, 676 1,410
~, 071 Z,668
Z,408 1,834
Z, 89Z Z,486
Z,Z79 1,706
79
69'" "
September...... 1,935 Z,718
Z,546
October. . . . . . . Z, Z91
Z, 585
,
Z,413
Novemb.er. . . . .
1, 9Z6
Z.1 5 3 : ' >'
Z, I .Of; _
04~
December. . . .. Z, Z38 ..' ,A.nnual Total. . . Z5,895
Z, 165 33, 136
...
Z,004
31~ 440
!! Ip.cludes exptcted pul1~t teplacements from eggs sold during the preceding
month at t~e rate of lZ5 pullet chi.cks per 30-dozen case of eggs.
. ARCHIE LANGLEY Agricultural Statistician In Ch~rge
w. A. WAGNER' "
Agricultural Statistician
..
CHICKENS TESTEO
GEORGIA: In Georgia 3'57, 772 chickens for supplying broiler hatching eggs were tested for pullorum disease during August 1959--49 percent ~,,?re
than the 240,302 tested in August 1958. Testings of egg-type chickens for'j,AJ.lgust were 19,898--53 percent less than the 42, 581 tested in August last year.
UNITED STATES: There were 1,918, 545 chickens for supplying broiler hatching eggs tested in August 1959--up 20 percent from August 1958.
Testings July and August totaled 3,455,618, compared with 3,224,921 tested during ,the same period in 1958.
'J \
, In, the States for which comparisons are available, 581, 132 chickens were tested during August for 'supplying eggs for egg-type chicks':-down 3 percent from August 1958. The number tested during July and August of this year totaled 1,024, 711--down 7 percent from the same months in 1958.
This report is made possible through the cooperation of the National . Poultry;Improvement Plan official State agencies, the Animal Husbandry , Research Division, Agricultural Research Service, and the Agricultural Esti~ mates Division, Agricultural Marketing Service.
Month
~
Georgia - Chickens Tested by Official State Agencies
.
For a'roi'ler Production ..,
; Egg':Type Chickens" . --.
By ~onths
:
Cum.u1ative:
By.Months
:__ 19_58-~9 ; 1959-60 ; 1958-59 ; 1959-60 ; 1958-59 ; 1959-60
July
253,865
Aug.
240,302
Sept... : 413,264
Oct. ' Nov.
:
458,442 388, 136
Dec.
: 432,318
Jan.
: 564,491
Feb.
: 482,212
Mar. : 400,437
Apr.
: 275,275
May.' ,
242,067
June
2S3,013
245,365 357,772
- .'
I,
.,
,
.
2S3,865 494, 167 907,431 1, 365, 873 1, 754,009 2,186,327 2,750,818 3,233,030 3,633,467 3, 908, 742 4, ISO, 809 4,403,822
245, 365 60'), 137
",
",
30,299 42,581 35, 652 41,043 26, 186 84,778 34, 194
5,280 4,994 6,779 5, 561 25,032
40,259 19,898
United States - Chick~ens_Te~ted by Official State Agencies
Month
July Aug. Sept. Oct. Nov. Dec. Jan. Feb. Mar. . Apr. May June
!! For Broiler Production by Months
1958-59 :
1959-60
: 1, 628, 129 : 1,596,792 : 2,643,740 : 3,119,754 : 2,951,368 : 2,794,873
2,601,927
2,363,505
: 2,320,302 : 1,928,397
1,647,255
1, 609,452
1,'537,073
. 1, 918, 545
:
For Egg-Type Chickens
:
by Months 21
.
1958-59 :
. . 500, 558 . . ,.
599,607 1,243,658 2,318,229 2,349,994 .. 2,487,248 1,648,909
756, 864 421,587
. 267,870 241,636 323,650
1959-60
443,579 ,. "'-.1 581, 132
II All States except Mont., N. Mex., Ariz., Nev. 21 All States except Ohio, Del., Okla., Mont., N. Mex., Ariz., Nev.
GIOJJR{CRA CJR{OJJP> lRIJP>OJ~TnNG SI~VnCI
o~:4
AGRICULTURAL EXTENSION SERVICE UNIVERSITY OF' GEORGIA AND THE' STATE DEPARTMENT OF AGRICULTURE
Athens, Georgia
.-~--
'-'~.
" 1\ .S;Y OF CE..;;r:~~ U. S. DEPARTMENT OF AGRICULTUftE
'AGRICULTURAL MARKETING SERVICE
EP 25'59
311 EXTENSION BLDG., ATHENS, GA.
September 22, 1959
L.IBRARIES
RECORD 1958 GJ*}RGIA-FAm4-J1lCOME
:'Js'
Cash farm income (including government payments) for Georgia amounted to
$769,122,000 in 1958, according to the Georgia Crop Reporting Service. This is a record, exceeding the pre~ous high of ~671,592,OOO in 1955 by 98 million dollars. The 1958 income was 105 million above the 664 million in 1957.
Income from all crops totaled 305 million dollars compared with 271 million dollars in 1957. Livestock and livestock products brought farmers 416 million dollars, an increase 'of 15 percent or 53 million dollars above 1957 and a record
.for the State. Government payments with the Soil,Bank Program reached an all-
time high of 48 million dollars, exceeding last year bY' 17 million dollars.
Income from cOlMlercial broilers exceeded all other commodities with 165
million dollars followed by cotton with 72 million; cat-tIe and calves, 70 million;
hogs, 69 million; peanuts, 63 million; tobacco, 54 mUlion; eggs, 53 million; and dairy products, 50 million dollars.
Percentage contributions to cash tann income by' commodities are as follows:
Commercial broilers, 21.4 percent; ootton and cottonseed, 9.3 percent; cattle and
calves, 9.1 percent; hogs, 9.0 percent; peanuts, 8.2 percent; tobacco, 7.0 percent;
eggs, 6.9 percent; and dair,y products, 6.5 percent.
'
DISTRIBUTION OF 1958 CASH INCQ1E FROM GEORGIA CROPS AND LIVESTOCK
\
\
'\."..1
.' BOOS ...9.~
.. . .. .CARL. Q...DOESCHER -AgtictiItut'Ql-Statistician
~
m
~
I
u
~ 0 0 J. S 3 ~ , 1....- ._,~
ARCHIE lANGLEY ' : Agricultural Statistician'
~---:---;-!.
-CROPS
Cotton Lint Cotton Seed Cotton, Total. Peanuts
CASH FARM INCOME FOR GEORGIA 1/
- 1952 1953 1954 1955
1956
(Thousand Po11ars)
154,321 125,005 112,941 124,112 95,516
1957 62,263
'.... 17,996:, .14,153 12,935. 11,3~9 9,610.:' 7,481
.. (
.
.. ":172,317 139,158 125,876 '135,431 ....~05,126 69,744
42,513 55~397 29,119 57,673' 60,1~~ 46,887.
- t 1958 ~
65,386 6,218
"
71,604 62,951
Tobacco
62,924 69,407 58,769 72,326 ,'i 64,573 48,125 54,068
Fruits & Pecans
19,865 18,855 17,341 4,017 17,985 9,208 19,780
Truck Crops*'
.16,726 .17,128 10,663 11,32$ 10,744 11,796 6,931
Corn'
8,765 9,160 8,390 14,524 20, 75~ 23,241 31,7lJb
Forest Products
.1
All Other Cr ops
36,382 34,634 31,854 43,163 35,650 40,724 30,590 22,760
59,802 34,728 33,338 ?9,420 26,854 24,1lJb
TOTAL CROPS
395,142 384,463 312,602 361,219 368,591 270,583 304,560
*Exc1uding Irish and Sweetpotatoes and minor truck crops~ which are included
in all other crops.
t
LIVESTOCK
Hogs Cattle & Calves Dairy Products Com. Broilers other Chickens Turkeys Eggs other
50,190 29,681 41,610 88,610 4,537 3,496 29,187 2,207
54,776 59,570 41,879 46,888 57,833 68,807 24,169 28,276 40,795 40,937 47,610 69,748 43,349 42,717 45,291 49,423 51,ho6 50,089 93,826 101,951 125,700 129,836 150,336 164,521 4,912 3,998 4,171 4,536 4,690 5,328 2,363 2,502 1,912 1,~45 1,839 1,185 37,469 33,152 40,891 42,115 45,991 53,128 2,224' 1,728 1,362 2,995 3,316 3,343
TOTAL LIVESTOCK AND PRODUCTS GOVERN1"JENT P~~NTS-~ '" TOTAL CASH INCOME ALL SOURCES HOME CONSUMPTION
Crops
Livestock
.
;
249,518 263,088 273,894 302,001 318,575 363,021 416,149
7,589 4; 719 .6,640 - .8,:372.. - 8,388. 30,.727 ....48,413 652,249 652,270 593,136 671,592 695,554 664,331 769,122~
36,921 52,624 36,844 35,554 74,236 75,613 60,085 53,229
37,458 30,570 26,319 56,695 57,303 59,407
TOTAL INCOME INCLUDING HGlE CONSUMPTION BUT NO GOVERNMENT PAIMENTS
Crops
432,063 437,087 349,446 396,773 406,049 301,153 330,879
Livestock
323,754 338,701 333,979 355,230 375,270 420,324 475,556
All Commodities 755,817 775,788 683,425 752,003 781,319 721,477 806,43$
TOTAL INCOME, ALL COMHODITIES,
..
AND GOV. PAYMENTS 163,406 780,507 690,065 760,375
11 1957 Revised. 'Y 1958 Preliminary.
789,707 752,204 854,~8
J
o,-
3 I I I . .
c;:.'. :..~ ,..... ~I
-I
II
:~, .,''"I ,~. '. I V':l. I
I I
I
~. ',1"\ .;'
{ ~
, ' ,J..
P r ...'..,1.~ ',lf'"'o~.l'"_~,'I
,~ ,
,
'
',,-~/': .
.. i.......",."
~
I
1
'l"" ".;
'- " '-
..
~,\\,.:
i .,
' . \. / ' ,.
." \\
I
\"
I
I
,," ~'!J.. ,,' '(
'
~ ' .. \
......... t
," '!. I
-t-."!l - I
t .--- ""'f' - I ,'":.~....~ ~ ~, tI,:" " ~ , ~ ,'"-. ---.
31S
G E 0 R G I A C R 0 PRE PO R Til ~ 5?m.p~~rMiICE
1< \f \I\/ Lr trJ ~
SEP 21+'59
LIBRARIES
-rr I ~ I J-1/\\
JI
'--J,
_
~~
Jr:'>\ \Jj
Released: 9/23/59
GEORGIA CHICK HATCHER Y REPOR T
Athens, Ga. Sept. 23 - - A total of 4, 537,000 broiler chicks were placed with producers in Georgia during the week ending September 19, according to the Georgia Crop Reporting Service. This compares with the 4, 668,000 placed, the previous week and is 7 percent less than the 4,873,000 placed the same week last year.
Eggs se't by Georgia hatcherie-6 amounted to 6, 392, 000 compared with 6, 141,,000 the previous week and is 13 percent less than the 7, 319, 000 for the corresponding week last year.
The majority of the prices paid for Georgia produced hatching eggs were'
reported within a range of 45 to 60 cents with an average of 53 cents for all hatch-
ing eggs and 51 cents for eggs purchased at the farm from flocks with hatchery'
owned cockerels. Last week thEf -range was from 45 to 60 cents with an average
of 53 cents for all hatching eggs and 51 cents for eggs purchased at'the farm
from flocks'with hatchery owned cockerels. Most prices charged for chicks
were reported within a range of $8. 00 to $9.25 with an average of $8.75 per hun-
dred compared with a range of $8. 00 to $9.00 with an average. of $8.25 per hun-
dred last week. The average prices last year were 67 cents for eggs and $11. 00
for chicks.
:
Weighted average price from the Federal-State Market News Service for broilers during the week ending September 19 was Georgia broilers 2 3/4 3 3/4 pounds at farms 15. 15f.
Week Ending
GEORGIA EGGS SET, HATCHINGS, AND CHICK PLACEMENTS
I
- BROILER TYPE
EGG TYPE
Eggs Set !!
Chicks Placed for Broilers in Georgia
Eggs Chicks Set Hatched
1958 Thou.
1959 Thou.
1959 % I 1958
of 1958
Percent Thou.
1959 Thou.
1959 '10 1959 1959
of 1958 Percent Thou. Thou.
July 18 8, 560 8,337 1 97 6,340 6, 554
103
,I July 25 8,254 8,231
100
Aug. 1 8,302 7,771
94
6,329 6,398 6, 193 6,033
100 97
165
61
131 138 .
192
72
Aug. 8 8,010 7,419
93 5,969 5,8Q7
97
212
1~4
\ug. 15 7,448 6,932 r 93 5,868 5,730
98
205
97 .
Aug. 22 7,294 6,775
93 5,660 5,370
95
212 144
Aug. ~9 6,968 6,485 , 93
Sept. <Sj 6,971 6,373
93
5,493, 5, 331 5,179 4,812
97
161
93 : 91
168 154 .
Sept, 12 1,298 6, 141
84 5,023 4,668
93
149 166 '
"
Sept. 19' 7, 319 6,392 { 87 14, 873 4, 537
I 93
176 123
I,
t
!
I
11 Includes eggs set by hatcheries producing chickij for hatchery supply flocks.
ARCHIE LANGLEY Agricultural Statistician In Charge
W. A. WAGNER Agricultural Statistician
-------------------------------------------------------------------------
u. S, Department of Agriculture
Agricultural Extension Service
Agricultural Marketing Service
State Department of Agriculture
319 Extension Building, Athens, Georgia
.. _---------------------------------------------------------------------
EGGS
SET
AND
CHICK
PL, ACED
IN
COMMERCIAL
AREAS.
:
BY WEEKS -
1959
"
"
.~ .,. .' ','
Week Ending
PaRe ~
,
,
STATE
Sept. ' Sept.
Sept.
5'
12
;19
~ EGGS' SET - THOUSA~S ..
A~~.
...
,Aug. ' 22
Aug. ' Sept.
29
,5
Sept. ; Sept.
12
19
,
CHICKS PLACED - THOUSANDS ;
.f ...
Maine
-: ,:' 1,099
1,023
1,1074
1,054
980 11,048 1,061
l
838 ! 407
Connecticut Pennsylvania Indiana
. 746
741
~ 976 ' . 1,059
' :' 1, 303
1,202
;863 :872 1,.295
. 485
420
469
"
757
859
714
.21 774
352 ; 402 724 : ,. 667
791
767
110
604
633.
622
Illinois
172
162
,198
103
138
100
156
111 ' 106
Missouri
1"294
I, 124
1, 154
815
805 ' 768
724
621 . 557
,Delaware
, 1, 138
1, 175
1, .07G
1,742 1,607 1, 569 1,326 1,419 : 1,119
(
.'
Maryland Virginia
2,708 1.289
2,676 1,404
2,,646
1,~509
1,182 1.961 1,934 1, 871 1, 118 ' 1,871 .
1,009 1,060 1,001
984
896 ; 688 '
West Virginia North Car-olina
196 2.,961
233 2.935
266 2,'878
-,
528 '2,660
463 2.. 581
486 2.396
467 2,405
386
374
2, 355 :. 2, e89
South Carolina GEO'RGIA
385 : 387
6,313
6, 141
:392 6, :392
' 292
272
303
263
257 : 267
5,730 5,370 ' 5, 33 I ,4,81Z 4, 668 ~ 4, 537"
Florida
Alabama
Mississippi
Arkansas
Louisiana
Texas
Washington
Oregon
California
,
..
TOTAL 1959 .
TOTAL 1958
1959 % of 1958
..
' 407
3, 106 2,318 3, 122
477 2, 172
368
3, 1-00 2,354 3, 146
412 2,221
303
278
253
279
1,332 . 1,478
.
,,
.
34, 130 33,904
.: "
37.. ~13 38,8,7S'
92 .
81
- ....
,.354 '
3,;053 2.'225
177
2.973 Z, 169
3,;022 ' 433 2,i221 137 Z:256
1,'394
' , 3.077
413
2,073
1
.340
186
818
' ,
.
33,\939
30,034
I'
38.j61S
,31,2.32
!I
.'
.
88
;; .
,~ : 96
.1
I'
205 - 3.019
2.035 3,024
366 2,028
292 . , 161 . "888
29,:1C7
30,025
-- 98
~..-
170 ,3.034 1,780 '2,869
391 1.975
277
. 200 800
:
213
2,906
1,664
2.769
366
' 1, 870
',
I
317 121
I 839
234 I 168
2; 568 ; 2,,596,
1; 618 1 1,689
2.,657 ; Z,'648
318
308
1,895 : 1,711
,282 ' 244
177
107
852 ' 726
,.
. ,28,325, 26,939 , 25, 585, ; 2.3. 963 ,
i8,883 28, 117 27,265 i 25,781
, ~ 98 .. : , ,96
,
. 9.
4 ,
" ,
" 93
,
~. ----:.=.::----- ...... - - - -
3/5
" ';< ,.:.~-;-r;r1'
GEOR,GIA CROP REPORTING SER.VICE
.~..
~.
l.
'
.
. ? r J'< \f ,'"~I. .'l.. /.:" \ \ ~ ; "l'~ " ... ' ......~-...:,'1r;;:.~~ I
' . r---'
j I
'v:l 0
.
I
(I ~ ~''./ ~
~''i":;-1\'
,.
""
'
.,'.".'
\,;,
I
UNIVERSITY OF GEORGiA
.
(---J
~ 1-:
~
:1t:'..-J r J /\-r \r . r J r J\ \ f rIlt\,,"~,,~,.''l...t('\_-,~l~~.~.'.\.~~.:~..I'~~.l,..;~(:,..~~'"\~e.c~".~."~~.:'...'".Z.",.
OCT 2'59' I
LIBRARIES
J.
I
'--J
~
....:...-I
Released: 9/30/59
GE, ORGIA CHICK HATCHER Y REPORT
Athens, Ga., Sept. 30 -- A total of 4, 452, 000 broiler chicks were placed with producers in Georgia during the week ending September' 26, according to the Georgia Crop Reportjng Service. This compares with the 4, 537,000 placed the previous week and is 8 percent; less than the 4, 852, 000 placed the same week last year.
Eggs set by Georgia hatcheries amounted to 6,300, 000 compared wit,h
6,392,000 the previous week and is 12 percent less than the 7,141,000 for:the
corresponding week last year.
'-
The majorit}r of the prices paid for Georgia produced hatching eggs were reported within a range of 45 to 60 cents with an average of 54 cellts for all hatching eggs and 52 cents for eggs .pur,chased at the farm from flocks with hatchery owned cockerels. Last ~eek the range was from 45 to 60 cents' with an average of 53 cents for all hatching eggs and 51 cents for eggs purchased at the farm
from flocks witq hatchery owned cockerels. Most prices charged for chicks
were reported Witl)in a range of $8.00 to $9.25 with an average of $8. 75 per hundred'compared with a range of $8.00 to $9.25 with an average of $8.75 per hundred last week; The average prices last year were 67 cents for eggs and $11. 00 for chi'cl$s. . .
Weighted average price from the Federal-State Market News Service for
broilers during the week ending September 26 was' Georgia broilers 2 3/4 3 3/4 pounds at farms 14. 50~.
Week Ending
GEORGIA EGGS SET, HATCHINGS, AND CHICK PLACEMENTS
BROILER TYPE
Eggs Set 1/
Chicks Placed for Broilers in Georgia
I EGG TYPE
I Eggs Chicks
Set Hatched
1958
1959 195.9 % I 19'58
of 1958
1959
1959 %I 1959 I 1959
of 1958
Th0l.1. Thou. ercent Thou. Thou. Percent Thou. Thou.
July 25 8,254 . 8, 231 10'0
6,329 6,398
100
,131 138
Aug. 1 8~302 7,771
94
6, 193 6,033
97
192
72
Aug. 8 8,010 7,419 93
5,969 5,807
97
212 124
Aug. 15 7,448 6,932 93
5,868 5,730
98
205
97
Aug. 22 7,294' 6,775 93
5,660 5,370
95
212 144
Aug. 29 6,968 6,485 93 Sept.' 5 6, ,971 6,373 93
5,493 5,331 5, 179 4,812
97 93
.1162112_/
168 154
Sept. 12 7,298 6, 141 84
5,023 4,668
93
149 166
-'Sept. 19 7,319 6,392
87
4,873 4, 537
93
176.. 123
Sept. 26 7, 141 6,300 88
4,852 4,452
92
.179
91
I
'1:/
-- set by hatchene s pro
ARCHIE LANGLE Y Agricultural Statistician In Charge
W. A. WAGNER
Agricultural Statistician
-u-. -S-.
--------------
Department of
-----------
Agriculture
-
-
-
----
-
-
-
---
-
-----Agric
------
ultural
----------
Extension
--------
Service
Agricultural Marketing Service
State Department of Agriculture
319 Extension Service, Athens, Georgia
-------------------------------------------------------------------------
EGGS SET AND CHICKS PLACED,IN COMMERCIAL AREAS. ,BY WEEKS - 1959 P 2
..
., "
.
Week Ending
STATE
Sept. :12
Sept. 19
Sept. : 2(> ,
EGGS SET - THOUSANDS
Aug.
.'
22
,Aug. .029
Sept. 5
Sept, 12
Sept. 19
CHICKS PLACED - THOUSANDS
Sept. 26,
Maine
1,023 . 1,074'. ~ 781
980 1.048 1,061.
838 .407
817
Connecticut Pennsylvania
747 1,059
863 872
906 866
,
420 859
469': '714 '
'-
427 774
352 . 402 , 346
724
667
590,
:r-.
Indiana
- Illinois ...-. , Missouri
- I 1.202 -' 1, 295 ' .~~ 208
',
162
198
'204
I, ,124
1, 154
1, 166
767 _ 138
805
710 ., 604 . 633
100
156
III
76~': 724 ~ 627
622 106 557
571 121 598
It
..
Delaware. Maryland
,,,
I, 175 ~, '676
1,070 2.646
996
2.601
' 1,607 'I. 569 L.326 1.419 1. 179 1. 125 1,967 1,934 1. 811 1,718 1, 871 1,827
Virginia
1,404
1. 509
1,'354'
,- 1.060 1. 00 l' . 984 . 896
-688
739
..
West -Virginia
233
266
208
463
486 .' 467 ' 386 ' 374 296
North Carolina
2.,935
2..878 '2,535 " .
2.. 581 2,396,' . 2,405 2,355 2,089 2, 186
South Carolina
381, . 392
'40~
272 ' 303 -2-63-
l57
267
272
GEORGIA
6, 141
6,392
6, 300'
5,370 5.331-,' 4;812 4,668 ,4,537 4,452
Florida Alabama.
,368 3.100
354 3,053
353' 2. '970
, ' 205
170 ' tol3 ; 234
168
179
3,,019 . 3.034 2. ~06 ' 2" 568 2. 596 2,405
MiS2ti s sip.pi Arka:nsas
Louisiana
Texas
Washingto'n
Orego~
California
. ',"
TOTAL 1959'"
2.354-. 3. 146"
41Z: ' ~, 221'
278 2.79. 1, ~78 . ,
2.225 3,022
433 2.2.2.1
372. 256 1.394
33.904 33,939
2.302
2.998. .', 460' ,
2.229 3Q4
251
1,255
' ..
-,
"
32,651 -
2,035 I, 780 ' I, 664' I 1. 6,18
3,024 2., 869 " 2,,769 t 2.,6'57
366 -' 391
366',; 318
2,028 . 1,975 ' 1,870' ,; 1, 895
292
277 , 317
161 ' .. 200'
121
888 : 800 " 839
2.82 .. 177
8'52
:
29",.'307 ''28,325' 2.6.939. :25, 5~5
1.689 1.675
2., 648 2., 554
308
32.7
1.71.1 1,689
2.44
194
107
160
. 72.6
916
'
... ; . '...... I
..
23.963 2.4,039
TOTAL 1958'
38, 8~5 ' 38.615 37,-"48,7' ,
.-
- 30,02.5 28.883 '2.8, 11( ,2.1,,2.65 2.5, 781 25,502 ' "
19t9 % of ,1958
" 87
"
88
. -. 87
;
98
98
' 96
94
93
94
~
f-t
~
0 Po.
~ ~
>t
~
-.
u:~r:
E-t
~
>t
~ ~
JiI
~
~
3.j!;
<GJEO~CnA (cJR~JP> ff,;.~tr_~_~ HNC SIE.IRiVll<CI&
AG,RICULTURAL EXTENSION SERVICE
U. s. DEPARTIENT OF AGRICULTURE'
UNIVERSITY OF GEORGIA AND THE
STATE DEPARTMENT OF AGRICULTURE
Athens, Georgia
..
nCT 9 '59
LIBRARIES
AGRICULTURAL MARKETING SERVICE 31. EXTE"ION BLOG., ATHE", GA.
October 5, 1959
FARM PRICE REPORT AS OF ~ER 15, 1959
GEORGIA: The All Commodity Index of Prices Received by Georgia Farmers declined four points to 245 percent of its 1910-1914 average during the month
ended September 15, 1959. Primarily responsi"le for the decline were lower prices for cotton, corn, peanu~s) and hogs. Higher prices for eggs, wholesa:le milk) and most hays were partial~ offsetting.
The mid-month average price of $1.17 per bushel for corn was a decline of 11 cents below the August 15th price 'of $1.28 per bUShel. The September 'price was, also, the lowest mid-month average price Georgia farmers have received for their corn during September since 1942, when the average price was $1.02 per bushel.
a All hogs averaged $13.60 per hundredweight during September, decline
of 60 cents from the previous month. Tl!e September mid-month average price of $13.60 was below the average price for 0.11 months since February 1956, when the average price was $12.00 per hundredweight.
UNITED STATES: During the month ended September 15 the Index of Prices Received
by Farmers remained unchanged at 239 percent of its 1910-14 aver-
age. wwer prices for meat animals, grt:l.ins, oil bearing crops, and potatoes
were offset by higher prices for dairy products, fruit; and eggs. The mid-
. September index was 6 percent (16 points) below 0. year earlier. " The Index of Prices Paid including Interest, 'Taxes, and Farm Wage
Rates as of September 15 remained at 297) unchanged from August. Small increases in prices paid by farmers for clothing) building materia1s~ and items bought for household operations raised the family living 'component of the index slightly
and lower prices for feed, motor vehicles, feeder livestock, and building and fencing materials lowere~ the production component.
Summary Table for Georgia and the Uni1ed States
--- -_._.--- ---------._--_.
1910-1In4de=x
: ')Sept 15 100:' 1958
INITED STATES
Prices Received: 255 :
Parit)" Jna.ex _11 : _.. 294 :
Parity Ratio:
87:
Aug. 15 1959
239:
297
:
80
:
Sept. 15 1959
239 297 80
hie : RecOTd
: Index : Da e
: 313 :Feb. 1951
: 299 ~ 2/ADr~ 1~9
: 123: Oct~ 1946
GEORGIA
Prices Received:
All Commodities 265 ::
249
245
: 310 :Mar. 1951
All Crops : 280
271
265
: 319: d!Mar.1951
Livestock and :
:
:
_. Products
: 232 :
203
:
203
: ?95: Sept. 1948
<~ Prices Paid, Interest, Taxes, and Wage Rates based on data for the indicated
. dates. gj Also May 1959. 'jj Also April 1951.
ARCHIE LANGIEY Agri cultural Statistidan In Charge
RAYMOND R. HANCOCK Agricultural Statistician
PRICES lECEIVED BY FARMERS SEPTEMBER'15, 1959 WITH CClJPARISCl'l.'S
i' J
' I
"--_._~~:....:..;;.
Cc:MJODlTY
J1NDtNIT
'.'
Wheat, bu.
I:
. .; .
"I
, GEO;;------il
WrIED STA1$S..
:
I
I ':~ ., ,'Average/sept.15 Aug. 15 Sept. 15 A-.erage Sept. 15 J ,15 !Sept15
. 1910-14 1958
1959
-
1959
1910-14 1958
9 ; 1959
.-~. --r-----
$ 1.23
1o8e 1,n
1.75
'.884 1.68 ..
75 ,I 1.72
'O&llh"b~.
,,
$
Corn, bu. c ~ar1ey, bu.
.'. .:
$
$
~rghlXll Crain, cwt.
$
.67
.91
.91 . 1.24
,1.15
;~,.
..
. ,2.10
qotton, lb.
'~ . i2.1
. , I ''I'
~
Cottonseed, ton
oJ $. ~.65
..
Soybeans, bu.
'$
-' 1 .' ~; I
-
Peanuts, lb.
5.2
35.6 50.00
2.10 10.5
Sweetpotatoes, ant.
!.
.
... $.,
Lespedeza Seed,.A11,cwt. $
Ray,ba1cd, per toni
All
$
Alfalfa
$
Lespedeza:
$
Soybean & Cowpea
$
Peanut
$ ,
Wool, lb.
~
.84
,.
. ., ,
4.75
-
25.80 35.80 27.80 29.00 20.50
39.0
Milk Cows, head
~ogs, awt. C~ves, awt.
. I .. ~
.. $ 33.85 160.00
$ . 7.36 20.60
$
'. 23 .00
.75 1.28
.eo 1.17
. .399 .642
1.05 '.: 1.05
.61~
1.9~
35.0
1.95
-
I 34.5
12.4
40.00
39.00
22.55
2.10
- 2.00. I
9.5
9.0 I 4.8
I - . 5.80
.
4.75
1.60
u~~ r' .~" 25.70 "
I - 33.00 . 34.50
27 .50 29.50
29.00' .. _
29.50 I ' - .
23.00
23.00 I
-
44.0
II
44.0
18.3
i 170,00 165',00
-
14.20
13.60 i 7.?:7
24.80 24.50'1 6.75
.556 ,e 1.13 .
.861
1.68
34.54
45.50
1.98
10.4
2.74
- . .. ' "
, ~
17.60 17.90 19.60 27 .60 19.50.
..
3508
21"7 ~oo
;
19.90
26.00
6<1! .620 13 1.00 833 .846 61 1.52 26 33.12
.eO 37.90
98 1.90
54 81J7 94 I 2.:6
40 19.90 10 20.70 00 20080
66 26J.0
10 19J.O 3 43.4
00 1233 00
00 13040 40 I 26.80
MUk,Who1esa.le,0'Wt '.' Fluid Mkt. Manuf. All
Turkeys, lb.
qhiokens, per lb.' J" Fa.nn : Com'l Broil.
11.11
$
$
$
-- Y 2.43
6.33 5.70 3.56 3.25
6.25 !/5.60
,
:-
,/5:90
4.87
--1.60
!/
3.26 4.32
~
63
13
11 09 4035
~
..
26.0 23.0
23.0
114.4
::'3.7
9 22.6
I
~ ~ ~ 13.3
14.5 15.5 15.5
12.5 14.5 1404
12.5
I -- I 14.8
12.5 16.3
14.7
1104
15.5
2 I 9.fJ
7 15.7 7 14.4
Eggs, doz.
Beef Cattle, cwt.
~
$
21.4
I I 3.96
49.1 39.8
18.10 1 19040 I
!
!
;
.!f Rovised.
V Prel1minary ~st.ima==.::t-=-e..:..
40.7
21.5
I
' I 19.20 I 5.42
!..
i
~~---
.
41.8 22.30
9 32.8
70 I 22.50
I --.L.._
--=- _
PRICES PAID BY F.ARMERS FOR SELECTED lEEDS SEPTEMBER 15, 1959 WITH COMPARISCNS
,-
GEORGIA
KIND OF lEED
"
.
~PI t19.58 15
Aug. 15 1959
.-
Sept. 15
1959 ,
t.N ITED STATES
Sept. 15 Aug. 15
1958
1959
Sept. 15 1959
!
-
ixed Dairy Feed
D-o-1l-a.-rs-Per 100 Pounds I
All Undor 29% Protein
" 1~ Prote'in .,' 18% Protein
2CY~ Protein 24% Protein
4.00
3.90 4.30
4.10 4.40
3.90
3.80
. 4.05' 4.00 4.25
3.85
. 3.75
4.00 4.00 4.15
3.65
3.58 3.59 3.90 4.02
3.66
3.61 3.58 3.86 3.94
3.61
3.57 3.49 3.82 3.90
Hilth Protein Feeds Cottonseed Me~l ;~41%)
Soybean Mell.1 (44%
Meat Sora.p
Grain By-Products
Diin
Middlings Corn Meal
4.00
-4.15
3..l5 3.40 3.40
4.05
-4.10
3.30 3.55 3.25
3.65
-4.00
3.25 3.50 3.20
3.97 4.41 6.37
2.68 2.82 3.34
4.16 4.20 5.44
2.75 2.95 3.25
3.97 4.12 5.29
2.70 2.85 3.19
:eroPoultry Feed ner GroWing Mash Laying Mash Soratch Grains
5.20 4.90 4.35
4.75
4.75 4.20
4.70
4.7Q. 4,15
5.06 4.50 3.96
4.83 4.44 3.93
4.75 4.37 3 ..8 6
m
Jj ~
a
.al
e
d
)
All Other
40.00 31.00
42.50
30.00
i
42.50 33.00
I
26.30 26.70
29.10 26.40
29.40
i 26.40 -1-...
.- . , I~.I'"
~
" ..
:
.~:':'l
~II
I
,;.
'I"'~~,
.i"-""':"~''-1.[..f:(.~
~~~.
;''1 ~.' l .
I " . 1.1 ~"l
'_1 ,i~" .=,, t,~,.t'"t.
~ : - : .,.,. "
4
.'
, " ' . . , Y .l~ ,'1't.l 'f '
I
...
1.\., t\- 'j
: ,"\,'"
)
'. 'II,'
4",\
- ! ' _..
,(~'~~
~.
:,
',:r_ t~..
I
':1
i\~. ~.I.~~<[,', ..... J._.....
)5"
GEORGIA CROP REPORTING SERVICE
LY ~ ~J<
J)-\ -rc J-J E Y -U-N-l':"~~-I"TY"::-:-,-,w~
R
LIBRARIES
Released: 10/1/59
GEORGIA CHICK HATCHERY REPORT
,Athens, Ga.', '9ctobe~ 1 -- A total of 4, 383, 000 bJroiler chicks were placed
with producers in G~'orgia during the week endins October 3, according to the
Georgia Crop Reporting Service. This compares with th-e 4,452,000 placed the
previ.ous week and is 1'5 percent less than the 5. 15Z, 000 placed the same week
last year.
.
Eggs set by Georgia hatcheries amounted to 6, 538,000 compa)"ed with
6,300-,000 the previou~ week and is 8 percent less than the 1, 110, 000 for the"
corresponding week last year .
. .'The majority of 'the prices paid far Georgia produced hatching eggs were repo'rted within a range of 50 to 60 cents with a.n aver'ageof 55 cents for all hatch-
ing eggs and 53 cents for eggs purchased at the farm from flocks with hatchery owned cockerels. Last week the range was from 45 to 60 cents with an average of 54"'cents for all hatching eggs and 5Z cents for eggs purchased at the farm from flocks with hatchery pwned cockerels.. M;ost prices charged for chicks were reported within a range of $8. 00 to$9. Z5 with'an average of $9.-00 per" hundred compared with a range of $8. 00 to $9. Z5 with an average of $8. 75 per bundred last week. The average prices last year were 61 cents for eggs and $11.00 for chicks.
Weighted ~verage price from the Feder.al-S'tate Market News Service for broilers during tbe week ending October 3 was Georgia broilers 2 3/4 - 3 3/4
pounds a,t farms 13 .. 85.
GEORGIA EGGS SET, HATCHINGS, AND CHICK PLACEMENTS
BROILER TYPE
EGG TYPE
Week Ending
Eggs Set !.!
1958
1959 1959 0/0
of 1'158
.: Chicks Placed for Broilers in Georgia
Eggs Chicks Set Hatched
1958
1959 , 1959 % I 19 59 I 1959
of 1958
Thou. ,Thou. IPercent Thou. Thou. Percent IThou. Thou.
Aug. 1 Aug . 8 Aug. 15 Aug. 22 Aug. Z9 Sept.. 5 Sept.12 Sept. 19 sept.Z6 Oct. 3
8,3.0zl
8.010
1,44~
1,Z94 6,968 6, 9 7~ 1,Z98
7.319 1, 141 7,110
7,111 . 7,419
6,93Z 6,715 6,485 6,313 6, 141 6,39Z 6,300 6.538
94
6, 193 6,033
97
93
5,969. 5,801
97
93
5,868 5,130
98
. 93
5,660 5,370
93
5,493 5,331
95 91
93
5, 119 4,812
93
84
5, 02-3 4,668
93
81
4,873 4, 531
93
88
4,8SZ 4,45Z
9Z
9Z
5, 15Z 4,383 I 85
19Z
1Z
Z12 124
205
97
ZiZ 144
161 168
11Z1I6Z-1
154 166
176 12,3
179
91
146 132,
r/11 Includes egIS set by hatcheries producing chicks for hatchery supply flocks. Revised.
ARCHIE LANGLEY
Agricultural Statistician In Charge
.M.
~
W. A. WAGNER Agricultural Statistician
~--------
u. S. Department of Agriculture .,
Agricultural Extension Service
Agricultural Marketing Service
State Department of Agriculture
319 Extension Service, Athens, Georgia
-----------------.---------------------------------------------.---------
EGGS SET AND CHICKS PLACED IN COMMERCIAL AREAS. BY WEEKS - 1959
P
z
.
STATE
Maine Connecticut Fennsylvania Indiana Illinois Missouri Delaware Maryland Virginia .. est Virginia North Carolina South Carolina GEORGIA Florida Alabama Mississippi Arkansas Louisiana Texas Washington Cregon CalHornia
Sept.
19
Sept.
26
Oct.
3
EGGS SET - THOUSANDS
1,074 863 812
1,295 198
I, 154 1,070 2.646
1. 509 266
2,818
392 6,392
354 3,053 2,225 3.022
433
2,221 372 256
1,394
781
906
866
1,208
204 1, 166
.996
2,601'
1,354
-
208 2, 535
404
,6.300
353
2.970
2,302
2,998
460
2,229 304
251
1,255
I, (,98
845 835 1,269 164 1~ 113 1.206 2, 562
1.019 217
2,751 425
6, 538
316 3,041 2,373 2,71:1
457
2,249 30'1
' 145
1.. 185
Week Ending
Aug.
29
Sept.
5
Sept.
12
Sept.
19
Sept.
26
-
Oct.
3 ..
CHICKS PLACED - THOUSANDS
.-
1,048 1, 061
838
407
817
898
469
427
352
402
346
372
714
774
124
667
590
658
710
604
633
622
571
494
100
156
111
106
121
83
768
724
627
557
598
506
1, 569' 1, 326 1,419 I, 179 I, 125 1.097
1, 934 I, 871 1. 718 1.871 1,827 1.797
,
1,001
984
896
688
739
832
486 2,396
303 5,331
467 2,405
263 4,812
386 2,355
257 4,668
374 2,089
267 4, 531
296
391
2, 186 . 2.232
272
270
4.452 4,383
170
213
234
168
179
145
3,034 2,906 2, 568 2, 596 2,405 2.284
1,780 1.664 1,618 1,689 1,675 1,656 2, 869 2,769 2,657 2,648 2, 554 2,620
391
1,975 277 200 800
366
1, 870 317 121
839
318
1,895 282 177
852
308
1, 711 244 107
726
327
1,689 194 160
916
331 1, 596
211 172 962
TOTAL 1959
33.939 32,651 32:, 850
28,325 26,939 25,585 23,963 24,039' 23,990
.
TOTAL 1958
38,615 37,487 36,241
28,883 28, 117 27,265 25.781 25, 502 27,134
~
1959 % of 1958
88
87
91
I
98
96
94
93
94
88
,
I~
(G[(Q)JRGHA (CJR{O!P ~1rllNGi S[~Vll(clE
AGRICULTURAL EXTENSION SERVICE UNIVERSITY ~ GEORGIA AND THE STATE DEPARTMENT OF AGRICULTURE
Athens> Georgia
;;;IJERSIIY OF GEORGIA
OCT 10'59
U. S. DEPARTMENT OF AGRacULTURE AGRICULTURAL MARKETING SERVICE 31t EXTENSION BLDG ATHENS. GA.
October 8, 1959
..
GEORGIA CO'}:'rON
~QR':Ltl'BR~AR\SE-Sor- OCTOBER
1
The 1959 Georgia cotton crop will be 535,000 bales (500 pounds gross weight) according to October 1 information furnished by crop correspondents to the Georgia Crop Reporting Service. The current forecast is 40,000 bales below
the September 1 forecast but 52 percent above the 352,000 bales harvested in 1958. Indicated yield per acre of '389'pounds is 54 pounds below the 1958 record
of 443 pounds, but exceeds all other years of record.
Production is expected to be 111 percent above last year in the northern
districts; 58 percent in the central districts; and 21 percent larger in the southern area.
Frequent rains during the first two weeks of September delayed harvesting
operations in most areas of the State. The excessive moisture and'rank vegetative growth caused some rotting ot bolls and reduced the quality of the- crop. Heavy grass and weed growth and shortage of cotton pickers have delayed progress of harvest in many areas. Hurricane Gracie caused heavy damage to unharvested cotton in those counties adjacent to the Savannah River, with the intensity of
the damage declining rapidly away from the River area.
Census ginnings to October 1 were 344,000 running bales compared with 280,000 bales to the same date last season and 218,000 ba.les in 1951.
CARL O. DOESCHER Agricultural Statistician
ARCHIE LANGIEY
Agricultural Statistician In Charge
GEORGIA'MAP SHOWING INDICATED PRODUCTION 1959 AND FINAL PRODUCTION FOR 1958~1951
\ 1959-41,1" 1958-19,4 1951-25,0
L
1959 production indicated on October 1.
- STATE -
1959 - 535;000 1958 - 352,000 1951 - 396,000
Districts shown are Crop Reporting Districts and NOT Congressional Districts.
1959-88,800 1958-69 . 400 1951-66,000
VII
ALBANY
1959-63,100 1958-53,100 1957-55,000
VIII
1959-107,500 1958- 83,300 1951- 90, 000
VALDOSTA
I
"..
IX
1959-21,400
1958-14) 800
1957-12,000
J;i1; (
PlEASE TURN PAGE FOR
UNITED STATES INFORMATION
.,
UNITED ,STATES - C<Yl'I'ON REPORT AS OF OO1'OBER 1, 1959
The Crop Reporting Board of the Agricultural Marketing Service makes the
following report fram data furnished by crop correspondents, field statisticians, Bureau of the Census) Commodity Stabilization SerVice, and cooperating State
agencies. The final outturn of cotton compared with this forecast will depend
upon whether the various influences affecting the crop during the' reDiD.inder. of the
season
- -, - -
are more',
- - - -:
or less
- Acres,
favorable
:- - - Lint
YthiaenIdu-spuearl-.
.-
-
:- -
-
-
-
Product""1Oil-
'g"":" -
-
-
,State .," ': ,I for: :_ h!~e!t~d_a.r~ __ ~: _ 500-~o~ S.I"S! ~i~t_b!l~s_
Y;.. _ _ _ _ _ _ _ _.:_1h2a,5r2v,est: !1~~r-!58~7 ;:.. _19_58_:. _ i1n9.599;i...;:.. !1v9~4r8~!":-.57;:.. 1958 ;:.. i1n9.59;9i...__'
1,000
acres North Carolina ' : 395 South Carolina : 565
Georgia,.,'. .: 660
Tennessee : 515 Alabama, ., ,' .: 815 Mis,Sissip~i '. ',.: 1,440
Pounds
~---
310
284 392 312 396
Pounds
466
406
443 ' 501 398 409
Pounds 401
370 389 550 427 517
1,000 bales
419
598 655 572 844 1,710
1,000 1,000
bales bales
256
330
299
435
352
535
419
590
439
725
961, 1,55,0
t-lissouri ., : 400 396
446
Arkansas .: 1,295 386
436
Louisio.na . .: 495 396
392
Oklahoma . : 600 184
365
Texas . . : 6,300 232
383
516
386
547 1,429
451
624
320
367
350 3,956
275
480
925 . 1,475
297
465
313, 400
4,308 4,600
New Mexico : 198 582
820
832
275
301
343
Arizona . .: 380 831
931
973
740
734
770
'J/: California .: 875 748 1,049
Other States
'58 304
403
1,070 1)424
365
48
1,604 1,950
29
44
United-States -: -14,991 - -329- - - 465 - - - !j:70 - 14704"0' - - I175I2- -1!j:,09~ -
V : - Ame"r:--Egypt
-60.4 - 435- - - 525 - - - 544 - - 49:-7- - - - 8'3:-0' - -75.3-
YAUgUst I esti~te.:-. ~gJProductroii giDned-~-to ,~e-grnned.~ A 500-1b:- ba.1e- - -
conta.ins about: 480 net' pounds of lint .. . .1IVi.,rgima, .Fldrida, I1linofs, Kentucky and Nevada. ~Inc1ude.d in State and ,United States totals. Grown in Tems, New Mexico, Arizona, and 'Co.lifornia. ,', I
CROP REPORTING BOARD
" ...
/S"
(GI&CO~CGllA CCIRtOIP ~ElP'(Q)~1rlllNCG [JR{VllCCI&
AGRICULTURAL EXTENSION SERVICE UNIVERSITY OF GEORGIA ANO THE STATE DEPARTMENT OF AGRICULTURE
Athens. Georgia
IN\VU<~\I" m \;Ern;lt,
OCT 14'
U. S. DEPARTMENT OF AGRICULTURE AGRICULTURAL MARKETING SERVICE 319 EXTENSION BLDG ATHENS. GA.
October 12. 1959
1 RQ~f.ll::;
HONEY PRODUCTION REPORT - OCTOBER 1959
GEORGIA: Estimated honey production in Georgia for 1959 is 6.479.000 p/?unds. This is a decline of approximately two percent from the 1958 produc-
tion of 6.603.000 pounds. Total colonies of bees were estimated at 209.000 compared with 213. 000 last year. Honey production per colony is estima. ted at 31 pounds this year the same' as last year.
UNITED STATES: The ~959 honey crop is estimated at 247.885.000 pounds--7 percent less than last year's large crop. according to the
Crop Reporting Board. This year's honey crop is being produced by 5.437.000
colonies of bees--about the same number as in 1958. Honey production per, colony averaged 45.6 pounds. compared with 49.0 in 1958 'and the 1953-57 average of,42. 7 pounds. In mid-September, beekeepers had about 101 million pounds of honey on hand for sale--about 41 percent of the estimat~d 1959 production.
Honey production was 40 percent below last year in the Western Region. with the largest reduction in California. Production in the .3outh Central region was 9 percent below last year. These decreases were partially offset by in,~, creases, of 39 percent in the East North Central. 15 percent in the North Atlantic. 6 percent in the South Atlantic and 2 percent in the West North Central States.
p'roduction in New York and Pennsylvania was above average .. and New Jersey',produced the largest crop since ~949. In each of the East North Central States both yield per colony and total production were above average as the,
season was particularly favorable for nectar flow. Yield per colony in Michigan was highest of any year since 1939. and in Ohio and Indiana the highest since. ' 1941. The honey crops in Minnesota and Iowa were above last year and above average. Production in North and South Dakota was well above average despite drought conditions. Honey production in South Georgia was very good but in ' North Georgia was almost a complete failure. The Florida crop was below last year and average. A poor citrus flow resulted from rain and cold weather. In Texas, weath~r ~as favorable for nectar flow and production was well above average, although 'below last year. Very dry conditions in Wyoming. Colorado,
Utah. and Nevada reduced plant development and nectar flow. Colorado had the smallest crop of record. In Montana and Idaho weather conditions in late July
and August were unfavorable and yields per colony were below average. Production in California was lowest since 1945. and yield per colony lowest of record. This year's yield per colony at 30 pounds compares with the unusually high yield of 80 pounds in 1958 and the 1953-57 average of 51 pounds. Dry weather in the spring and early summer sharply reduced nectar flow. The honey yield from orange was light and the sage crop was particularly disappointing.
The 10 leading honey States which produced 58 percent of the crop are Minnesota. California. Wisconsin, Florida. Iowa. Texas, Ohio, Michigan, New York, and Indiana.
(over)
..Produc;tion ~er .colony' i.~c.rease.:i'fr~m:,33. O pounds' last year:'t~j9!:i.; ,:'
pounds in the North Atlantic. 39.6 to S&.8 in the East North Central. and 31. 5 to :32~'7 :irt.'~he South Atlai)tic State:s. Yields per colony dec~eased ~rQ'j:n'''$~.~:;~:~o 83 ..l.in,the We.st NortbCentral. 30.0 to 26.7 in the Sout,h.Cent~al.a~9~1i~m.Z:.l.7
to 42.1 in the Western States.
,'". ' t"...i c...... '.,: .. (
Estimated stocks of honey o.n ha~~ for sal~ by producers .i~ mid-September totaled 101.275,000 pounds. compared' with 107.690.000 pounds a year earlier. The~~. stocks amounted to 41 percent of Production. Stocks as a percent. of ::(...
P.l'!J4uction were 52 percent in the East North Cc,niral. 45 per,cent.in the West. 39 'percent, in the West North Central. 37 percent in the Nort.b.At1a~tic. ')1 ~.~~.
ce~~ in the Soq.t~,A~~~tic. and i8 percent in the South Centra,l-,S~ates.: ...... ; j
, '1 f
'
1959 HONEY PRODUCTION AND STOCKS ON HAND SEPTEM'BER 15 FOR SALE
Stat~ .. :Colonies of bees :Yield pe.r colony :Honeyproduction: Honeyfor;sa'le~in
&?4. . ,:' , : ' , .' '1/ :
:.: 11:
. division :. 1958 : 1.959_ : 1958 : 1959-:- : 1958 .L __ -'- __ ~_. ~ _
: ' . 11 ::producer'a han~.:~n
. : 1959- :Sept. 15 .195,9
Thousands
Pounds
; Thousand Pouna.; Thousand Pound.
GA. . : 213 ... 209 ~ 31
31
~ 6.603 . 6. 479 ~
"'1.490
Del.
:
3
3 : 26
24
:
78
72 : .... 25
Md., .. 29
10 26
24
.' , 754
';120 '. "274
Va';' . ; 139 .'. 136 ; 21 ". "26: ; 2,919 3',536;
1.061
W. Va. :' '103.
101: .16
18
: '1.648 '1.818 :
,454
N. C. .: 183
210: 14 :'. 22
:Z.562 '4,620:
''1.478
S. C. : 58
60: l4 ". Z2 . : 1',39l . 1'..320 :
. '238
... Fla.
: 274
277: 57
54
: 15,618 14,958:
5, 534
S-o-u-t-h-"-~-'-:-,---.---.~.~.----.-:-. -------,~. ---" -----: -~-' ------_._---: ---------, --~. ----
~.t~'tj. ,_:_l~ ~_O~ .l~ ~:~__..:.!!.;?._. _!!,,;!.._.:.!}:.!!~_. !!:.?!!.:. _~ ..~~~~~_..._.
United- .
, , ' .' :
.... .
States. ,:- 5~ 420 S,;~37 .:: ..-9.0
45.~.. :Z65, 677 247,88.5 : 101,275
!! '. Preliminary.
"
ARCHIE, LANGLEY Agricultural Stati~tician In Charg'e'
.,. ~ "
. '. '.':. ~"
,.
. 'W. A~ WAGNER
'
Agric '".
u
l
t
u
r
f
i',I.St.ati'st.lci~. n
;'.
; . ". : .,j;'. .1".)
t :.
. . . " '
..-
.i ,~
'"
:,:. 0:.... 1 ...:
t ,f
;}!
CG[(Q)~GllA C~9IPdi~~~~1rllNG SlE~Vll(cIE
AGRICULTURAL EXTENSION SERVICE
U. S. DEPARTMENT OF AGRICULTURE
UNIVERSITY OF GEORGIA AND THE STATE DEPARTMENT OF AGRICULTURE
OCT
AGRICULTURAL MARKETING SERVICE 3'9 EXTENSION BLDG., ATHENS .. GA.
Athens; Georgia
.
L1 b "l./lHll"'<:\
October 12 J 1959
GENERAL CROP REPOR'r FOR GEORGIA AS OF OCTOBER 1) 1959
SECOND LARGEST CORN CROP: ~rent indications point to a Georgia corn crop
of 81,984,000 bushels, the Georgia Crop Report-
ing Service said today. If realized, this would be the second largest crop ever
produced in the State being surpassed only by last year's record crop of
86,752,000 bushels. The yield per acre of 28.0 bushels also promises to be the
second highest of record. The record produced in 1958 is 32.0 bushels per acre.
The decline in yield prospects from last year is due primarily to a lack of
m6isture at various times during the groWing season.
.'
ABOVE AVERAGE PEANUT PRODUCTION: The production of peanuts in Georgia this year is forecast at 550,000,000 pounds,
10 percent below the 1958 crop of 612,850;000 pounds} but apprOXimately 10 million pounds above average. The indicated yield per acre of 1,100 pounds. is 90 pounds below the 1958 record of 1,190 pounds per acre; but exceeds all other years of record.
Frequent showers and cloudy weather durj.ng the first half o September delayed harvest of peanuts. The delay together with excessive moisture damaged peanuts that were in the process of being harvested, resulting in some loss of nuts and extensive loss of quality. Open weather the last half of September enabled farmers to finish harvesting most of the peanut crop by the first of October.
LEAF PRODUCTION UP: The. State's flue-cured tobacco crop, currently estimated at 106,500,000 pounds, is nearly 19 percent larger than
. ~st year's crop of ~9, 610; 000 pounds. . The' estimated yield per acre of 1,500' pounds is only 45 pounds below the record high 1958 yield of 1,545 pounds per acre. The increase in production from last year is due to a larger acreage as Georgia farmers harvested 71,000 acres this year compared with 58,000 acres in 1958.
PECAN CROP SLIGIn'LY.ABOVE AVERAGE: Indications on 'October 1 pointed to a pecan crop of 37 million pounds,
8 million pounds less than production last year, but slightly above the 1948-57 average of 35,370,000 pounds. The crop is unusually light in the Albany area. Prospects in central and northern counties are generally fair to good. A larger than normal percentage' of thi s year's crop will come from seedlings. Harvest is just beginning on a small scale which is somewhat earlier than last year.
CRQP AND UNIT
: ACREAGE:
GEORGIA
.
:. (000) ':
:
..YIELD PER ACRE :
. : TOTAL PRODUCTION (000)
:
: Indi-
: 1959
:Avera~e : :1948-57 :
1958
: Indicated: Average: : 1~59 : 1948-57 :
1958 .
: cated : 1959
CORN,ALL bu.: 2,928
18.5 32.0
"TREAT bu.: 100
16.7 230
OATS . bu. : 259
28.0 330
:BIRIEY . . . . bu.: 13
23.9 29.0
RYE bu.: 16
10.0 12.5
HAY, ALL tons: 632
.73 1.02
~OBACCO,ALL lbs. : 72.1
1,248 1,540
~OTATOES,IRlSH,cwt.: 4.1
46
46
~OTA'roES, SWEET, cWt. : ' 10.0 ~OTl'ON bales: 660 ~ANUTS( P&Ir) 1bs. : 500
y
42 284
48
Y 443
866 1,190
SOYBEANS
tor beans bu. : 82
11.1 12.5
SORGHUM
'for grain .bu. : 33 gj 19.1 24.0
PEACHES
Total Crop. bu. :
PEARS Total Crop bu.:
-
PECANS
. ,:Lbs ~ :
-
--
-
-
--
11 Y PASTURE, CONDITION ~:
-
72
Pounds.
Short-time average.
78
28.0 21.0
32.0 29.0 12.5 1.03 1,498
53 45
Y 389
1)100
54,176 2,099
11,412
189 78
679 119,353
312 1)137
655 540,052
16.0
25.0
-
-
~
82
536
gj 581
2,101
147 35,370
86,752 . 81,984
1,633 . 2,100
9,108 8,28 f}
290
377
162
200
641
651
91,0,18 ~07,985
222
215
528 " 450
352
535
612,850 550,000
1,125 1,312
888
825
4,000 3,200
98
85
45,000 37,000
ARCHIE LANGLEY AgriCUltural Statistician In Charge
CARL O. DOESCHER Agricultural Statistician
UNITED STATES - GENERAL CROP REPORT AS OF OCTOBER 1, 1959
Total crop production equal to the record of last year now seems likely, given
successful harvest of late crops. Frosts, earlier than usual in sane northern areas caused only minor damage as crop maturity was well advanced. September rains, excessive in some sections, hampered harvesting with losses of both volume and quality in some localities, mainly in southern sections.
CORN'is estimated at a record 4,429 million bushels, up 1 percent, frOm September 1, up 17 percent from last year and 36 percent above the 1948-57 average.
it SOYBEAN production is now estimated at 5.30 million bushels, down nearly 1 per-
cent fr'om September 1, down 8 percent from last year, but about times the average
SORGHUM GRAm Production is estimated at 573 million bushels, 7 percent below
last year but over 2t times the average.
,
AlL WHEAT output at 1,117 million bUshels, is about the same as September 1, 24 percent below last year but 4 percent above average.
PEANUTS are estimated at 1,673 million pounds, down 2 percent from September 1, and 9 percent from last year but 2 percent above average.
~ is estimated at 114 million tons, 7 :percent below last year, but 6 percent
above average.
.
QQ2 laid during September are estimated at 4,539 million, nearly 1 percent more than were 1ai,d during September 1958, and 14 percent above average.
_ - - - -~---------~----~
. Crop
Acreage
1959
.. - _- Jl-.f __ --~----, ---_._(- 00- 0)--
- .YU..NieITlEdDPSeTrATE- S ~----- Pr- od-uc-tio-n-------
Acre Ind1c.
Cct.l,19S9
~
...
__A12v4e.ra-g~e7_ ~
1958 _____
~
VCT.t.- ~
(000)
(000)
(000)
Corn,411bu. 84,387
Wheat, All'. ~.bu. 53,217
Oatsbu. 28,823
Cottonbales 14,991
H~, A11 to~ 70,991
SPoeaynbuetasns,yfo.r.b..e'a.n..s..
bu.
1b.
.21,968 1,496
Tobacco ; 1b. 1,157
52.5
21.0
y
37.3 470
1.60 .
24.1
1,118
1,573
3,251,064 1,075,391 1,306,458
14,046
107,134 326,020 1,642,502 2,090,481
3,799,~
1,462,218 1,422,164
11,512 121,924
574,413 1,835,800 1,736,204
4,429,154 1,117,430 1,075,376
14,692 113,864
529,793 1,673,120 1,819,689
--------:----~-~~--~illP~w----~-~-~--------
c State
:- - - - - - - - ... - - -Production - - - - -:' .. - - - - - - ~ - - -
I :: : : ________ .:: :.: !v~r!g! !9]ja:-:51 :
:12~ : : : : :I~d!c!t~-.!9z9.:
1,000 pounds
1,00, 0 pounds
1,000 eounds
N. C.
2,023 -. - ~ . 3,200
Boo
S. C.
3,640
. 8,000
3,000
GA.
35,370
. , 45,000
.
31,000
Fla.
4, 860
2,600
-. -
2,500
. Ala.
16,688
31,600"
8,000
Miss. Ark. La.
9,515 . . 16,000
.. 4,500
5,549 16,4 9 0 '
' ,. 2, 3 5 0. '
.. , 14 000
.
, .. 250,500000
\)lda. Texas N.. Max.
1I S. ~~~
18, 620
" ' 15 5" 00 , , . - ; . . J '17 t!OO
35,040
. '26,000
. 26,000
L- -
-
!I ,3,0)0 - -1~O-s'21- -
-
-
-
-
-
4,500
-17~-,150- -
-
-:- -
-
-
4,900
-129- 00- - - ~,1_~~
1/ ~hort-time average.
.
---------_. -_.-_._--
I
------.--"".----_.. ,....~ .
lL~,'.. (\
\~ ~..', '}f;A...a,'
,",\/,~. ,r '<'" ". '"\.f ''
.. ,,"''' " ' . I I
"_......] 4
,.r
L..:........J " '
",
. ,,';,: .
>,
l.:
:
'\i
..
~\.\" "'\
G..
EORG
,'
I
A
CROP
REPORTING
,".
\
SERVICE :-:
~)y,,,\~ " '-~ ~'J "-:.-...1
,.
~ ~.- '~II I
. . I I
(.,.I.. (.1
"I
';",:.
,I"
"..:.I.,'..'
\"
I "J 1\ -J r J r' - I \'" "\''1...''
'".,'' ..~...r .,...
. I., r -1\ r t R'Y ,.r ,~" .--.- t ,".'~t'_. ,, ~~"'" 64~..... .. 1 ' ~ ~h .
.
"'-.,
,
i
'"1
'
.
:,."_.1,t.....,... ",
(: -,
"" I
".:.. _ .
OCT
1
'I '-J
Released: 10/14/59'"
I
,
GEORGIA' CHI,CK HATCHER Y REPOR. T
~:, A~hens, :Ga. ~ October 14 -~ A total of 4,. 510, 000 broiler chicks wer'e piaced wlth propucers ~'n Georgia during the week ending October 10, according to the
Georgia 'Orop Reporting Service. This compares with the. 4,383,000 .placed the'
pr'eviou~ we,~k alld, is 'lZ percent less than the 5.. 117~ 0,00 pla.ced the same week ,
1a:~,t year. ' ; . .
",
'
,,
Eggs se~ by Georgia hatcheries amounted to 6,896,000 compared with
6, ,538.000 the1 previous week and is 5 pe:rcent less than the 7, Z4:8, 000 for ,the
co~respo~d~.ng week last year,.. '
,,
.
.:
I,.'.....
-
'.,
',~' The majority of ~he prices paid for Georgia 'pr~d~ce~d b,~t~hirig egg's were
reported within a range of 50 to 60 cents with an average of 55 cents for all hatchilig eggft ~nd 53 cents for .Jggs purchased at the farm from flocks with hatchery: owned c~ckerels.. -: L-a:s't 'week th.e 'ra:nge' Was from 50 to 60' cents' with' an. ;aveJ,.a:g~;
o{, 55 .ce~ts for all hatching eggs and 53 cents for eggs purchased at the farm :
f~~m :loc~s with hatchery owned cockerels. Most prices charged for chicks
wet-e reported wit~iri:a'r~ng~ ~f $8. 0'0 to '$9.25 with an aveI:age of $9. 00 per
hundred compareq with a, range' of $8.00 to $9.25 with an aveTage of $9.00 pe'1'
ht#!dred last week. The average prices last year were 67 cents for eggs and
$.t 1. 00 for chicks.
,
,
,
'::! W~ighte;d average price fro~ the' F~~eral-S,t~t~'Mark~t N'ews Service for:
bl'oilers during the week ending October 'lb was O'eorgia broilers Z 3/4 - 3 3}4 !
pounds ?,t,farms ,f3. 76~.
: GEORGIA EGGS SET,
. HATCHINGS. AND .CHICK PLACEMENTS
.... "
,
'\ ..- : ......
:
:
BROILER TYPE
EGG TYPE.
Week ...
Ending.
Eggs Set !!
',
Chicks Placed for
' . ': '.~ ~r,oilers in Georgia
Eggs C'l\icks \ Set Hatc...ed'I
"
"
",
A~g. 8,
:
1958
;
,
T'ho'i.j...1
8,010
1959
..
Thou.-
7,419
1959 0/0
of 1958
P
e.r
c
'
e
n.
t
".
1958
1959
1959 0/0
of 1958
, "
.
'1
T
h
o
.u ~
.
,
"
:.
"
T
h.
o.
.
"
u
...
,
.. .
Percent
1959 Thou.
~
.1959
I
,
.Thou.:
93 5, r'/69 5.807
97
' ZlZ _' 1Z4
Aug. 15' 7.448 6,932.
At!g.2.2. " , 7,2.94; '6. 175
Aug. 2.9
6; 968: 6,485
93' 5,868, 5,730 . 98
2.05
97 ;
,.93: :. 93',
'5, 660.:" ':5.''.3.7Q
5,493',;:', 5.331
-
'
95 97 -
: ZlZ 161
. 144 . . 1':8 ;
Sept. 5 6, 971' 6,373
93 5, 179 4. 81Z ' 93
1Zl 154
Sept.lZ
7,Z98 6, 141
84 5,02.3 4,668
93
176 166
Sept. 19 7,319 6,39Z
87 4.873 4,537
93
176 12.3
Sept.Z6
7, 141 6.300
88 4.852 4,452.
92.
179
91
Oct. 3 7. 110 6,538
9Z 5.15Z 4,383
85
146 132.
Oct. 10 7,2.48 6.896
95 5. 117 4, 510
88
2.63 132.
1/ Incll1des eggs set by hatcheries producing chicks for hatchery supply flocks.
ARCHIE LANGLEY Agricultural Statistician In Charge
W. A. WAGNER Agricultural Statistician
-u-. .S_.--D-e-p-a-r-t-m-e-n-t--o-f-A-g-r.i-'C-.u-l-tu-r-e.----------------A--g-ri-c-u-l-t-u-ra-l--E-x-t-e-ns.i.o-n--S-e-r-v.ic.e.
Agricultural Marketing Service
State Department of Agriculture
319 Extension Building, Athens, Georgia
---------------------------------------------------------------------.---
STATE
,
.
EGGS SET AND CHICKS PLACED IN. COM
c
-
,'
Week Ending,
Sept. 26
Oct. 3
. Oct. 10
S,ept~
5
Sept. 12
.
Sept. 19
19
Sept. 26
Oct. 3
EGGS SET - THOUSANDS
CHICKS PLACED - THOUSANDS
z
Oct. 10
Maine
781
1,098
1, 101
1,061
838
407
817
898
831
Connecticut Penns ylvani.a Indiana
906 866 1,208
845
835 1,269
. 872
955 , 1, 386
427
332* 402
346
312
514
714
724
661
590
658 ; 591
604
~33
622
511
494
566 :
Illinois Missouri
204 1, 166
164 I, 113
175 1, 133 '
156
III
106
121
' 83
114
724 ' 621
551
598
506,
564
Delaware
996
1,206
1,326
. 1, 326 1,419 1, 119 I, 125 1,097 1,022
Maryland
2,601
2,562
2,821
1,871 1, 118 1,871 1,821 1, 191 1,880
Virginia
1,354
1, 019
1,312
984
896
688
139
832
831
(
West Virginia
208
211
224
467
386
314
296
391
381
North Carolina
2, 535
2,751
2,649
2,405 2,355 2,089 2, 186 2,232 2,20Z
South Carolina
404
425
448'
263
257
267
21Z
210
283
GEORGIA
6,300
6, 538
6.896
4,812 4,668 4, 531 4,452 4,383 4, 510
.21orida
-
353
316
345
213
234
168
119
145
161
Alabama c
Mississippi
2,910 2,302
3,041 2.313
3, 143 2,331
2,906 2, 568 2. 596 2,405 2.284 2,421 1,664 1,618 1,689 1,675 ' 1.656 1. 554
Arkansas
2,998
2,141
3, 145
2,769 2.657 2.648 2,554 2,620 2,483
Louisiana Texas
460 2,229
451 2,249
418 2,295
' 337* 318.
308
321
331
392
1,870 1,895 1.711 1,689 1. 5~6 1,512
Washington Oregon
304
301
217
251
145 ~
200
311
282
128* 177
Z44 107
194 160
211 112
.
260 185
California
1, 255
1, 185
1,429
839
852
126
916
962
951
.
,
TOTAL 1959
32, 651 32.850 35.001
26,917* 25,565* Z3.963 24.039 23,990 24,226
TOTAL 1958
1959 % of .1958 '.
*ReviseJ.
31,481 87
36,241 91
31,901 92
28, 117 21.265 25,181 25.502 21, 1.34 27.271
,
9'6
94
. 93
94
88
. 89
<G1EQ)~GnA (C~CQ)Jfl>I' lRlEfJPt(Q)~1rllN<G SJE~VnCIE:
AGRICULTURAL EXTENSION SERVICE UNIVERSITY OF GEORGIA AND THE
tier
u. S. DEPARTMENT OF AGRICULTURE
AGRICULTURAL MARKETING SERVICE
STATE DEPARTMENT OF AGRICULTURE
3'9 EXTENSION BLDG., ATHENS, GA. '
Athens, Georgia
I
. ,.
October 14, 1959
ACREAGE AND ESTIMATED PRODuCTION
OF PRINCIPAL COMMERCIAL VEGETABLE CROPS
OCTOBER 1, 1959
UNITED STATES: Production 01' tall vegetables this ~ar is expected to be 12
percent less tliiil'in 1958, the Crop Reporting Board announced today Estimates prepared as ot October 1) Which normally account tor about 97 rrcent
01' the production in the fall season, indicate total production will be percent below average. Compared with last year, substantially smaller crops 01' cabbage, carrots and lettuce are in prospect. Slightly smaller production 01' tanatoes,
cauliflower, snap beans and sweet corn is torecast. Larger production of cucumbers, egg-plant, and green 'peas is expected.
September weather was generally unfavorable tor best development at vege-
table crops. Nearly every kind 01' weather occurred in some area 01' the country during the month. Hot, dry, col~, and wet weather, frost, snow storms and a hurricane dotted the vegetable producing areas. The most extensive loss was
caused by hmTicane Gracie in South carolina on september 29. Many crops
were severely damaged and considerable acreage was abaIidoned. Prospective pro-
.duction was lowered on the remaining acreage and the quality 01' produce is in
.dou.bt. However, Gracie was not entirely destructive, tor as she moved north-
ward, winds diminished and much needed rains fell over the east central' and
northeastern States on September 30 and October 1. Hot, dry September weather in the northeastern States was detrimental for most tall vegetables, especially
snap beans, cabbage, cauliflower and spinach, but these drought conditions were favorable for harvesting onions. Dry soil conditions in most of the north central States slowed vegetable growth until rains covered most of the area after september 20. Sunny days were favorable for harvest of vegetables, especially
om,ons. Conditions were generally favorable for development of crops in' the
central and southern States, except South Carolina. Some areas in the South received too much rain which made disease control difficult. Florida vegetables made fairly good progress, but rains caused some damage. Heavy rains and a
blanket of snow covered vegetable areas of Colorado and Nebraska in late September, temporarily stopping harvest of vegetables and making curing of onions
difficult. Conditions were favorable for growth in the Texas panhandle but in the 1A:Jwer Valley it was too hot and dry 'tor best crop development. In the Northwest 'September temperatures were cool and rainfall was ample. This benefited
most growing crops but hindered harvesting and curing of onions. In california
non-seasonal and abnormally heavy rains fell in the Sacramento Valley, north Ban Joaquin Valley and coastal districts as far south as Salinas on September
18-19. The rains interrupted all field activity and caused considerable damage,
particularly to tomatoes, straWberries, snap beans, lettuce and onions.
SWEET CORN: Fall production in Florida and california is forecast at 622,000 cwt., 20 percent below the 1958 crop but nearly double average. Acreage
in both states is less than last year. Some fields in Florida I s Everglades sec-
tion have been damaged by too much water and have poor stands, but most fields
look good. Light harvest is expected to begin about October 12. The small
acreage at Zellwood looks good and first. picking is expected about October 10.
Shipping from the Arvin-Wheeler Ridge area of california has started and harvest was expected to get underway from Visalia in early October. The acreage in both areas is considerably below last year.
CUCUMBERS: Earll ~ production is now forecast at 499,000 cwt., 2 percent below the 1958 crop, but 24 percent above average. In Virginia, yields
and quality have been good. Harvest reached a peak in late September but will
continue in volume through mid-October. In South Carolina, the crop was damaged
extensively by the high wind and heavy rains at the recent hurricane. A third 01'
the acreage has been abandoned and production from the remaining acreage will be
of poor quality. Harvest has passed the peak in Georgia and will end about Oc-
tober 15. Quality has been good. Harvest began about mid-september in louisiana.
'!'he crop is in fair condition after some damage trom hot weather and showers.
LE'l'roCE: Earll fall lettuce production is now torecast at 4,110;000 ewt.) 12 percen't"b'elow last year and 30 percent below averase In california
moderate supplies Will continue to be available until mid-October when a sharp decline is expected. The Oregon crop is in good condition and harvest continues. Cool, wet September weather in Washington resulted in mildew and mosaic problems and the crop 1s not turning out as well as expected. In New Mexico, harvest is eoxpected to get underway before mid-October. September weather was generally favorable for good growth in the Texas Panhandle. Quality is exceptionally good. Light harvest began the last of September and peak marltetings are expected about mid-October. Supplies are expected to be available into early November.
(Continued)
In New Jersey, harvest start~ci in the Cedarville-Vin~1andarea in late Septem-
ber. Volume is expected to gradually incre'ase to a peak about October 25-30.
Wet weather early in the month and hot, dry conditions late in September re-
duced yield prospects.
'
Acreage and Indicated Production Reported to Date, 1959
With Comparisons,
=
I I CROP AND STATE
ACREAGE FOR HARVEST
Average 1958 Ind.
1949-57
1959
CABBAGEy
-Acres-
YIELD PER ACRE
Av. 1
49-57
1958
I Ind.
1959
-Cwt.-
PRODUCTION
A19v49e-5- r~- 5~
Ind.
1959 -
-1,000 cwt.-
Early Fall:
New 1friopsh:Lre. ,360 . 250 250 156 190 ,170 . 56 48 42
Massachusetts. 1,160 1,060 1,000 162 175 170
188 175 170
Rhode Island.. 170
150 140 149 180 160
26
27
22
Connecticut... 760
850 750 160 175 140
122 149.. 105
New York,L.I.. 1)180 1,100 1,300 214 ,240 190
251 264 247
New York,Upst. 1':1.190 13,800' 13,100 262 330 230 4,492 4.554 3,013
New Jersey.... 2,030 1,900 1,700 159 225 ,190
323 428 323
Pennsylvania~. 1,690 1,,500 1,400 185 210 170 " 313
315 2,38
Ohio 1,950 2,400 1,900 233 315 230
459 156 437
Michigan 4,150 4,600 4,200 182 190 170
755 874 714
Wisconsin 8,090 6,400 6,000 244 300 250 1;976 1,920 1,500
Minnesota 1) 590 1.100 1,000 188 210 210
301 231 210
Idaho & Utah.. 630 ,560 670 318 218 313
201 122 210
Oregon .~ 1,810 1 / 900 1;900 189 185 230
338
352 4~
Group Total.. 42,760 37,510 35,310 229 272 217 9,800 10;215 7,6
SWEET CORN
Fall:
Florida 2,380 9,700 8,500 51 60 60
139
510
california. 2 I 800 3 300 1.600 65
60
70
184
112
Group Total.. 5, lBO. __13J 999~__10J 100 __ 59
60
62323
>22
CUCUMBERS
Early Fall:.
Virginia gj.. 2) 350
2,900
174
So. Carolina 820
800
40
Georgia 510
'250
8
Louisiana
22
California
2
ARCHIE LANGLEY Agricultural Statistician In Charge
L. H. HARRIS, JR. Truck Crop Estimator
.
)~-
GlEJ)JR{<GllA C~C01? ~IE:lP'(Q)~1rllN(G SJE,IR{VllCE
r AGRICULTURAL EXTENSION SERVICEi UNivERSITY OF GfllPClIJ
1 UNIVERSITY OF' GEORGIA AND THE
STATE DEPARTMENT OF AGRICULTU E
,
Athens, Georgia
OCT2159
U. S. DEPARTMENT OF' AGRICULTURE AGRICULTURAL MARKETING SERVICE 319 EXTENSION BLDG., ATHENS. GA.
October 19, 1959
Th.u summary of ..poultry (I. lnforIfm.RAaPt,l.ro" n o~ hatchery productl.on, poultry slaughter, egg p~Qduction, pertinent price data and end-of-month storage stocks is being furnished you in a condensed form to enable you to have a ready current
reference.
Item
POULtRY SUMMARY. SEPTEMBER 1959
0/0 of
t----~.,.....,----~~ last an. year
ClJo
1a
sotf
year
~hic;ks Hatch,ed by; Com; mercial Hatcherles:
!
. Broiler Type Georgia United State s
Thou.
Thou. Pet.
Thou. Thou. Pct.
2.1,899 19,973 130,303 118,672.
911 2.41, 874 2.53,336 105 91 1,405, 103 1,42.8. 159 102.
Egg Type Georgia United States
- Commercial S~a.ughter:3/
,
, Young Chickens Ge<;>rgia United States
833 16, 550
565 68
8.765
13, 82.7 84 543,62.4
14.066 160 504, 153 93
2.7.113 2.6.478 981 22.1,42.9 226,2.64 102. 143, 573 143,800 10o! 1, 145~ 773 1. 2.46,638 109
Hens and Cocks Georgia !
United State s
419 14, 169
587 140 14, 065 99
2.,958
,4. 097 ,139
fgg ,Production:
Mil.
Mil.
Mil. !
Mil~ ,',
Georgia
South Atlantic 41
Unlted States -
109 475 4,515
130 119 52.4 110 4,539 101
998 4, 587
45. 671
1.181 118 '5, '158 112.
47,2.91 104
,II Revised. 21 ~Pr-eliminary. - 31 Federal-State Market News Service--For the
purpose of thisreport a commercial poultry slaughter plant is defined as a plant
which slaughters a weekly average of at least 30, 000 pounds live weight while in operation. (Converted from weekly to monthly basis.) ySouth Atla~tic states: Del., Md., Va., W. Va., N. C." S. C., Ga., Fla.
MID-MONTH PRICES RECEIVED AND PRICES PAID
Georgia
United States
I
Item
,
Sept. 15 Aug. 15 Sept. 15 Sept. 15 Aug. 15 Sept. 15,
1958
1959
1959
1958
1959
1959
Cents' Cents Cents Cents Cents Cents
Prices Received:
. Farm Chickens (lb.) Com. Broilers (lb.) All Chickens (lb. ) All Eggs (doz. )
14.5 , 15.5
15.5 49. 1
-
12.5 14.5 14.4 39.8
12..5 14.8 14.7 40.7
12..5 16.3 15. 5 41. 8
10.2. 15.7 14.7 30.9
>,
9.6 15.7 14.4 32..8
Prices Paid: (per 100 lb. ) Dol.
Dol.
Dol.
Dol.
Dol.
Dol.
Broiler grow. mash Laying mash Scratch grains
5.2.0 4.90 4.35
4.75 4.75 4.2.0
4.70 4.70 4. 15
5.06 4.50 3.96
4.83 4.44 3.93
4.75 4.37 3.86
--------------------------------------------._._--.---.'.-.---------_.-.--
For this project State funds were matched with Federal funds received from the Agricultural Marketing Service. USDA, under provisions of the Agricultural Marketing Att of 1946.
------------------------------------- ... ----_._---------------------- .. _-
End-of-Month Stocks of Poultry, Poultry Products, Meat and Meat Products, United States
Shell eggs: Decrea,sed by 183,000 cases; September 1958 decrease wa~" 204,000 cases; average September decrease is 303,000 cases.
frozen eggs: Decreased by 13 million pounds; September 1958 decrease,,~as 17 , million pounds; average ~eptember'decrease is 19 r,nillion p~llnds., "
Frozen poultry: Increased by 50 million pounds; September 1958 increase was 82 million pounds; average September increase is 59 million pounds.
Beef: Increased QY 6 ,1l1illion pounds; September 1958 increase was 6 million
-
pounds; ave~age September change i,s a decrease, of 2 million pounds. ,
Pork: Decreased by 21 million pounds; September 1958 decrease was 22 million
i
pounds; average September decrease is 25 million pounds.
Other meats: Decreased by 11 million pounds; September 1958 change was an increase of 1 million pounds; average September change is a decrease 'of 5 million pounds.
Commodity
Unit
I ISeptember Septemberi
I1954-58av, 1958
I
/
t
Thou.
Thou.
I A ugust September
1959
1959 1I
Thou.
Thou.
Eggs:
Shell
, , .. '
.
Frozen eggs, totaL .
Whites
,
Yolks
, .. ,
'.
Whole or mixed. , .
Unclassified
,.
Total eggs 21 (case eq.) ..
Poultry, frozen:
Broilers or fryers , .
Roasters .. , , .. ,
.
Hens. fowls
,.
Turkeys ,
.
Ducks
, , , ..
Unclassified. , .', . , , ,' ...
rotal poultry.. , . : . ~ ....
Beef:' Frozen, In cure
& cured
.
Case
777
290
' 739
556
Pound 142,047 116,645 149,086 136,313
do. 42,637
39,687
36,327
J3,911
do. 34, 153
30',077
38,750
34,051
do', 58,963
42,441
66, 833
61,010
do,
6,294
4.440
7. 176
7.341
------------------------------------------
Case
4,451
3,243
4, 513
4,007
------------------------------------------
Poun 17,709
21, 817,
26, 133
23, 525
do.
5,776
3,678
8,867
7,754
do. 44, 551
54,270,
58,475
67,990
do. 112.486 160,808
87, 115 132,747
do. 12,247
8,492
10,765
11, 563
do. 32,295
29, 584 ,35, 119
33,369'
-----------------------------------------
do. ~ 225,064 278, 649 226,474 276,948
-~---------------------------------------
I
I
do. I 113,061
123,459
162,835
168,767
Pork:
~ Frozen
,.,,.
In cure or cured , , . ,
'Ido. ' 97, '307
do. 66,878
79,372 47,716
139,925 43,820
119,961 43, 184
Other meats and meat products, ..... , ..... ,'.
Tutal all red meats. , .. , .
do. 61.326
66,891
85. 564
74,450
-------------------------------------------
do. 338. 572, 317,438 432. 144 406,362
II Preliminary. 2/ Frozen eggs converted on basis of 39.5 pounds to the case.
ARCHIE LANGLE Y Agricu~tural Statistician In Charge
R. R. HANCOCK - W. A. WAGNER Agricultural Statisticians
'"
tf.Q.
q()()1
s~~3 GJE(Q)lR{CGllA <C~(Q)1P'
TUNG )]ElR{VllC[
N~
d, ')...f)
AGRrCULTURAL EXTENSION SERVIC~ UNIV~RSITY OF GEORGIA AND THE STATE DEPARTMENT OF AGRICULTURE
aAthens, G~orgi~
UNIVERSITY OF GEO~GIA ~
, '
OCT 23 '59
U. S. DEPARTMENT OF AGRICULTURE AGRICULTURAL MARKETING SERVICE 319 EXTENSION BLDG., ATHENS. GA'. ,
October 20, ' 1959
LIBRARIES
",
PULLET CHICKS FOR BROIb~!t P!A I'CRE'R Y; SUPPLY FLOCKS
September 1959 - United States
IS
;
The indicate'd d6m~stic placement of pullet chicks for broiler hatchery
supply flocks by leading primary bree'ders of broiler replacement stock totaled
1,480,000 chicks during September 1959. This was 42 percent less than domes-
tic placements ,of 2, 546, 000 chicks in September 1958. Total placements
(dome stic plus, e?,ports) were reported at 1, 727,000 as cOn:'lpared to 2, 718, 000
a year earlier. '
,
The pla~e'm~nt data include pullet chlcks sold during the month, plus the number of pullet chicks expected from eggs sold during the preceding month. The conversion from eggs to expected pullet chicks was made on the basis of 125 pullet chicks per case of hatching eggs sold. The primary breeders included in this report account for a very large percentage of total supply of replacement pullets for broiler hatchery supply flocks. Sales of replacement pullets by
these breeders provide an indication of the potential numbe{of' pullets available for addition to hatchery egg supply flocks several months before the pullets will ' actually move into the flocks.
,Pullet Chicks 1/ Placements for Broiler Hatchery Supply Floc;ks (Reported by,leading breeders)
Month .
',
1957
Total 1958
1959
Domestic
1958
1959 '
1959 0/0
of 1958
Thou.
Thou.
Thou.
Thou.
Thou.
Percent
January... , ..... 1, 886
1,982
2, 124
1,842
1,884
102
February........ 1,997
2,281
2,414
2, 162
2,256
104
March.......... 2,538
3,132
3,450
2,997
3,209
107
April. .......... May............
3,033 2, 899
3, 331 3,641
3,765 3,007
3,234 3,522
3, 573 2,861
110 81 ",
June ............ 2,060
3,409
2,575
3,234
2,392
74 '
July...... , ..... 1,676
3,071
2,408
2, 892
2,279
79
August.......... 1,410
2,668
1,834
2,486
1',706
69
3eptember ....... 1,935
2,718
1, 727
2, 546
1,480
58
October ......... 2,297
2,585'
2,473
November .. , .... 1,926
2, 153
2,048
December ....... 2,238
2, 165
2,004
, , --------------------------- ----._---------" --,-------.----
Annual Total. .... 25,895 33, 136
31,440
~
1/ Includes expected pullet replacements from eggs 'sold during the preceding month at the rate of 125 pullet chicks per 30-dozen case of eggs.
,ARCHIE LANGLEY
Agricultural ,Statistician In Charge
- ('
" . ..
.. I ,'.'
,"
W. A. WAGNER
.,
Agricultural Statistician
.?
l.':;:. .
\'.'" . .
.
C!i'rCKENS TESTED
.. .
.
,.
. ..~'.. ..: . ..:1
GEOR9IA,~' In Georgia. '512, 3~5 chickens for supplying broiler hatching eggs were :.1;.../,' .<'.'; , tested for, plil1or~m disease during September 1959--24 percent more
thartthe \4:13, 264 tested in September 1958. Testings of egg-type chickens for
September were 15, 187-- 57 percent less than the 3,5, f,52 teste.d in September
last year.
UNITED STATES: There were 2,376,006 chickens for supplying ~roile,l' hatching
.
eggs tested in September 1959~-down 10 percent from Sept~q.l
ber 1958. Te~tings July through September totaled'S, '827,000 compared with ',': '
5,868; 6-61 during the' same period in 1958.
.
"
..
, '.,\ ,'i
. . .' " ~
','
,
. ..'
. , . . . " , " ;.~.
. \.
,'~
1~ the States for which compC\tisons are available, 988,683 chickeRs for. ,
supplying egg-type chicks were tested during September--down 21 percent from
September 1958. Cumulative testings of egg-type br~eds, J'uly ~h,rough Septem-
ber, were 2,018,018, compared with 2,343': 823 during the same pe~iod year... '
earlier,.. . '
. _.
..
" . , 'I~:
.
... I ,\
. This rep.crt is made possible through the cooperation of the National ."
Poultl'y.. rmprovement. Plaz:l official State agencies, the Animal Husbandry Re- ;:'
search'Division, AgJ:icultural Research Service, and the Agricultural Esti-
".
mates Division, Agr1.cult.ural Marketing Service.
."
'.,. '
Month
Geo:rgia - Chickens Tested by Official State Agel!~~~~
- - - - ~ - - ~ _ _ _ _ _ _ _ : . - - ,
~-~-----~T
For B'roiler Production .:. ':. ',:,.,Egg-Type Chickens
By Months
: Cumulative' "
:, " ., ., By Months
1958.. 59 : ).9,59-60 : 1958-59 : lfI59.:.60; 1958-59, ; 1959-60
July '-:,':.,253,865
Aug!..... ~ ..: ~ 24.0, 302
Sept.'i... : 413,264
Oct.
: 458,442
Nov. ': 388, 136
Dec. : 132,318
Jan.
~,564,491
Feb. ,.: .482,212
Mar. :. ~.' 400,437
Apr. .:' 275,275
May:, 242, 067
June (':,253,013
245,365 357,772 512,325
253, 865
494, 167 907,431 1,365,.873 I, 754, 009 Z, 186,,327 2,750,818 .3, 233, 030
3,633~467
3,908,742 4, 1'50, 809 4, 4.o3~,822
24.S,.3.65 603, 131 1, 115,462
30,299 42,581 35,652 41,043 26, 186 84,778 34, 194
5,280
4,994 6,179 5, 561 25, 032
40,259 19,898 15, 181
United States - Chickens, Tested by Official State Agencies
Month
... Fo"r' Bro'iler Production
by Months!!
.' " " ... '
:... '.. 1958-'59
.: 1959-60
:
For Egg-Type Chickens
:
by Months 2/
: 1958.. 59
;
... i959-60
:
July Aug. Sept. Oct. Nov. Dec. Jan. Feb. Mar. Apr. May June
: ",'1;',628, 129'
::';'l~ 596,792-
: 2,643,740 : 3, 119,754 : 2,951,368 : 2,794.873 : 2,601,927 : 2,363,505 : 2,320,302 : 1,928,397
.: 1, 647, 255 1,609,452
1,537,073 1,913,921
3-/
500, S58 599,607
2,376,006
1,243,658
2,318,229
2,349,994
2,487,248
...
1,648,909 156,864
421,587
267,870
241,636
323,650
' 454835,,5775963-/ 988,683
1/ All States except Mont., N. Mex., Ariz., Nev.
'/ All States except Ohio, Del., Okla., Mont., N. Mex., Ariz., Nev. 3'/ Revised.
~" "-'~.::-i{;:'"-','":l 1iI~'I,. . '
'\i \,.-',.1.;.
__
'~. '... . . . , . ;: ... ~l' . ,_t I ~ _ ).', .\.
".",~: .~~;: l.~1 t ~ ~ ..-- ~ ~" .. ~"'" I
,
1ft,
,
.
..
~
11
"t
~ , ' -
~l
-- .
:I
'f
I n &';\'\., \.,~'f.'...... t.:':......\.~~.~~':t.:jt
,
;
.J
G E 0 R G I A C R 0 PRE PO R TIN G S E R V I G. E . ~ JS-:-
. r r .
.
I
r ~ J< . '/ \I'/. .;....oJ..:......J
-r J \f 1 \I
""., , , C r r Of GOR.IA
\
J ..:.....J
I
rr
I : j\
,
tl.q 2 2 59
..-
Released: 10/Z 11 59
LIBRARIES
GEORGiA CHICK HATCHERY REPORT
.4
;
.'
Athens, Gal., Oct. Z1 A total of 4, 500.000 broiler chicks were placed
w~th producers .11\ Georgia during the week ending October 17, according to the
Gf!lorgia Crop ~eporti~g Service, This compares with the 4, 510,000 placed the
pl;"evious we~k.and!ifJ 11 percent les8 t~an the 5,077,000 placed the same week
last year. :'.
'.
.. Eggs s'~t by Georgia hatcheries amounted to 7. 000, 000 compared with
6, :.896,00.0 the previous week and is' 3 percent 1es8 than the 7, 'l34, 000 for the.
co.rre~ponding week last year.
. The majority of the prices paid for Ge'orgia produced hatching eggs were
r.ej)orted within a range of 50 to 60 cents with an average of 55 cents for all
hatching egg~ and 53 cents for eggs pU:f.chased at the farm from flocks with
I~'
h'a~chery owned cockerels. Last week the range was from 50 to 60 cents with
an 'aveJ\'age ot 55 cents for all hatching eggs and 53 cents for eggs purchased at
the far~'from flocks with hatchery owned cockerels. Most prices ~charged for
chl:Ck. were reported within a r.ange of $8,00 to $9, 'l5 with an average of $9.00
pe~ hundred compared with a range of $8. 00 to $9. Z5 with an average of $9, 00
pe~ b~dred last week. The average prices last year wer.e 67 cents for eggs
an4 $11. 00 for chicks.
,
::. Weighted average price from the Federal-State Market News Service for
broilers during the week ending October 17 was Georgia broilers Z 3/4 - 3 3/4 pounds, at farms 14. 45~.
,
: ,. GEORGIA~EGGS $.E_T._IihTC_ffiNGS,.AND. CHICJ< PLACEMENTS $
BROILER TYPE
EGG TYPE
Week Ending
I Eggs S~t.!J
Chicks placed for . Eggs Chicks Broilers in Georgia Set . Hatched'
'.
1958
1959
1959 %
of 1958
1958
1959
1959 %
of 1958
1959
1959
~ I
,
... : ' i
Thou.' Thou. Percent Thou. . ~hou. lPercent Thou. Thou. -
Aug'. 15 Aug~ ZZ
Aug.~'l9
Sept~ 5' sept.1Z Sept. 19 Sept.'l6 Oct. 3.
Oct. 10 Oct. 17
7,448
7.'l94
6,968 6,971
7,'l98
7,319 7, 141 7, 110
'.'l48
7.Z34
6,93Z 6,775 6,485 6,373
6. 141
6.39'l
6.300 6. 538
".896 7,000
93 5.868 5,730 93 5,660 5.370. 93 5,493 .5,331 '. 9.3 5. 179 4~81'l 84 5.023 4,668
87 4,873 4,537
88 4,85'l 4.45Z 9Z 5,15'l 4,383
95 5, 117 4, 510 97 5.077 4, 500
!
98
205
97
95
'lIZ 144
97
161 168
93
lZl 154
93
189Z/ 166
93
ZOl Z1 1Z3
9Z 85
'l17'fj
146
91
14'l
Z/
88
Z63 154ZI
89
150 163
t
1/ Includes eggs set by hatcheries producing chicks for hatchery supply flocks.
T/ Revised,
ARCHIE LANGLEY Agricultural Statistician In Charge
w. A. WAGNER
Agricultural Statistician
--_ . . . ----._--------------.--.-----_.---_._----.-----------_.-.-.---------
u. S. Department of Agriculture
Agricultural Extension Service
Agricultural Marketing Service
State Department of Agriculture
319 Extension Building, Athens, Georgia' .
.
-~----.-.-------------.-----------._--------.-.------- -------------------
EGGS SET AND CHICKS PLACED IN COMMERCIAL AREAS. BY WEEKS - 1959 Palle Z
STATE
Oct.
Oct.
Oct.
3
10
17
Week Ending
Sept. lZ
Sept. 19
Sept. Z6
,
-
Oct. Oct.
3
.10
~.
o
Oct. 17
,
EGGS SET - THOUSANDS
CHICKS PLACED - THOUSANDS
.
Maine Connecticut Pennsylvania Indiana
1,098 845 835
I,Z69
1, 101 87Z
955 1,386
I, 1"97
973 966 1,4Z4
i
I
838 I, 407
817
898
831
7Z4
33Z \ 40Z
346
37Z
514
445
I
7Z4
667
633 , 6ZZ
590 571
658 494
597 566
483 5Z4
Illinois
164
175
167
III
106
lZI
83
114
106
Missouri
I, 113
I, 133
I, 169
6Z7
557
598
506
564
574
Delaware
I,Z06 1,3Z6 1,489
1,419 I, 179 I, lZ5 1,097 I,OZZ 1, 189
~
Maryland
Z,56Z
Z,8Z1
Z,93Z
I, 718 1,871 1,8Z7 1,797 1,880 1,833
Virginia West Virginia North Carolina
1,019 Z17
Z,751
l,37Z ZZ4
2,649
1,755 ZZI
Z,771
896 386 Z,355
688 374 Z,089
7'39 Z96 Z,186
83Z
391 Z,Z3Z
831 381 Z,ZOZ
658 344r ,. 1,841
South Carolina
425
448
445
Z57
1.67
Z71-
Z70
Z83
Z95
GEORGIA
6,538 6,896 7,000
4,668 4, 537 4,452 4,383 4,510 4, 500
~""lorida
316
345
309
Z34
168
179
145
167
155
Alabama
Mississip~i
3,041 Z,373
3, 143 Z,331
Z,958 Z,3Z9
Z, 568 Z,596 Z,405 Z,Z84 Z,4Z7 Z,306 I, 618 1,689 1,675 1,656 1,554 1,614
E-4
o~
Arkansas
Z,741
3, 145
3,07Z
Z;657 Z,648 Z,554 Z,6Z0 Z,483 Z,656
114
LouisialUl Texas Washington
457 2,Z49
301
478 Z,Z95
277
497 2,316
354
318 1,895
Z8Z
308 1,711
244
3Z7 1,689
194
331I, 596'
Zl1
39Z
432
I, 51Z ,. I, 560
260
205
~ ~ ~ ~
Oregon
145
200
Z81
177
107
160
172
185
172
~
California
1, 185 1,429 1, 526
852 '7Z6
916
962
951
859
::x::
u
f-4
~
TOTAL 1959
3Z,850 35,001 36, 151
Z5, 565 23,963 Z4,039 Z3,990 Z4,ZZ6 Z3,475
::x::
~
TOTAL 1958
36,Z41 37,907 38,08Z
Z7,Z65 Z5,781 Z5, 50Z Z7, 134 Z7,Z77 Z6,158
~ ~
~
1959 '10 of 1958
91
9Z
95
94
93
94
88
&9
90
r1l ~
.. ~-........
...*,,'.' ~1
.. "1'"I...,..' 1
'
,
. .. ~..-1.~...
.. ~
I /.'
.~.
,
1# ".,
.
, . L J, "~.
... . , '\' ... I , I,' It' ( . I ..~ "', I . - "1'(,
f .~,- _\...:.l&.1~ J :,.I.~."....~,J~\;-. 1t
~ _ "\.'. ,"
,,' .... ,'- II ';"',:'
\...... .......
-
')-.
.'. '."' ,
~f..
.... "I..'
I'
"~~",:."~,&""~'--".
\
GEORp~A CROP REPOR",TING SERyICE 31,5'
\/\/ r 1< L Jf ~~ ,~J
Ulih 1.1~:;'TY OF GEORQlA
OCT3?'59
t Fz Y LIBRARIES
}-J ;-\j Cbr]
Released: 10/28/59
GEORGIA CHICK HATCHERY REPOR T
I
,
. Athens, Ga., October 28 - - A total. of 4, 802, 000 broiler chicks were
placed with producers in Georgia during the week ending October 24, acco'rding
to. the Georgia Crop Reporting Service. This compares with the 4. 500, 009
placed the previous week and is 5 percent less than the 5, 034, 000 placed the
same week last year . .. ~
Eggs se't by Georgia hatchories amounted to 1, 138,000 compared ~ith
1) 000,000 the previous week and is 1 percent less than the 1.239,000 for the c0rres~onding week last year.
. . The majority of the prices paid for' Georgia produced hatching eggs were
x:eported within. a range of 50 t~ 60 cents with an average of 56 .cents for all
hatching eggs and ,54 cents for eggs purchased at the farm from flocks wit.h
hatchery owned cockerels. Last week the range was from 50 to 60 cents with
ani average of 55 cents for all hatching eggs and 53 cents for eggs purchased at
the fa'rm from flocks with hatchery owned cockerels: Most prices 'charged for cQicks were reported within a range of $8.50 to $9.25 with an average of $9.00
per hundred compared with a range of $8.00 to $9.25 with an average ~f $~. 00
per h\:lndred last week. The average prices last year' were 61 cents for eggs
and $11. 0.0 for chicks.
Weighted average price from the Federal-State Market News Service for
broilers duringthe week ending October 24 was Georgia broilers 2 3/4 - 3 3/4
polinds, at far ms 15. 18~.
:
GEORGIA EGGS SET, HATCHINGS. AND CHICK PLACEMENTS
BROILER TYPE
EGG TYPE
Week Ending
."
:
Eggs Set !!
1958 Thou.
19-59
1959 %
of 1958
Thou. Percent
Chicks Placed for . E;ggs Chicks
Broilers in Georgia
Set Hatched
1958 1959 Thou. :Thou.
. 1959 Ufo
of 1958
1959
Percent Thou.
1959 Thou.
Aug. 22
Aug.29 : Sept. 5 Sept. 12 Sept. 19 Sept.26 Oct. 3 Oct. 10 Oct. 17 Oct. 24
1,294 6,968 6,911 7,298 7,319 7. 141 7, 110 7,248 7,234 7,239
6,115 6.485 6,313 6, 141 6.392 6,300 6, 538
6,896 1,000 1, 138
93 . . 5,660 5, 310 . 95
93
5,493 ~, 331
97
93
5, 119 4,812
93
84
5,02J 4,668
93
87
4.873 4, 537
93
88
4,852 4,452
92
92
5, 152 4,383
85
95
5, 117 4,510
88
91
5,077 4, 500
89
99
5, (B4 4,802
95
212 144
~61
168
121 154
189 166 . 2Q 1 123
2119702_/
91 142
263 154
150 163
123 143
1/ Includes eggs set by hatcheries producing chicks for hatchery supply flocks.
Z/ R~vised.
ARCHIE LANGLEY Agricultural Statistician In Cha~ge
W. A. WAGNER Agricultural Statistician
u-..
--S.
-----------
Department
----------------------
of Agriculture
-
-
-
-
-
-
-
------------
Agricultural
----------------
Extension Service
Agricultural Marketing Service
State Department of Agriculture
319 ,Extension Building, Athens, Georgia
--- ~----------------------------------------------------- -.--------------
, STATE
. - EGOS SET AND CHICKS' PLACED IN COMMERCIAL oAR -
..
.
- - - ,-, ......~. ..
-:
,,
: Week Ending
-,
.
I
.>
Oct. 10
. Oct.
Oct..
'17<~'~' 24
,.
Sept. - ' . 19.
. ; Sept. Oct. .' Oct. 26 " , 3 I 10
:
",
Oct. ' 17
:.
Oct. 24
EGGS SET - THOUSAND'S ,
CHICKS: pLACED - 'I'HOUSANDS
.'
.,-
Maine
Connecticut
Penn~ylvania
Indiana
Winoia
Missouri'
Dela~e
Maryland Virginia
_. -
West Virginia
~'S:~oou~tthb_C~a~r~oo!liin.ana
GEORGIA
Florida
Alabama Mississippi
::
Ar)uulsas
Louisiana
Texas
'
Washington
Oregon
California
1. 101 872
--
1,
191 ,973
955'
,966
1.386 ;'1.424
175
167
1. 133 . .1, 169-
1,326 1,489
2,821 2.932
1,372
1,755'
224
221
2,649
~;1'H .
448
44S
6,896 .,. 7,000
345
'309
3,143
2.331 3,1.5
.18 '2,295
277 200 1,429
2.958 2,3'29 3,072
497 . Z,316
: 354
281 '1,526:
1.2.15" . ~ '893 996
1~ 410 , '183
1, 160 " 1,371 , 2.989 1.133
252 2,864
466 7,1'38
289
3.159
2:'454 3, 147
495 2.201
338 262 1,608
,.
,,
407 I
817
402 . 346
667
590
622
571
106
121
557
598
1, 179 1, 125
1,871 1.827
688
739
374,. , '296
2,089 2, 186
267
272
4,537 4.452
168
179
2.596' 2.,405 1,689 ....675
' 2,648 , 2,554
'. 308
321
1,711 1,689
244
194
107
160
..- .. 726
916
'898 ,- 372 .
658
494
~
83
506
1-,097
1.797
832
391
2.232
270
" 4.383
145
2.284
1.656 2,620
331 1,596 . 211
172 " 96Z
831
724
949
. 514 r 445
597 , 483
:493 .
440
566 - 524
633
114 I ' 106
95
564 I 574' , 511
1,022 I 1, 189 ',1.428
1,880 831
i
.
1
.833 658
1.765 443
~ 3~1
344
235
2.202 ' 1,841 2, '045 .'
283
295' 293
4,510 4,500 4,802
161
2.427 1,554 2,483
392 1.512
260 185 951
155 2,306 1,614 2,656
432 I, 560,
205
, 172 859
1.8
2.200 '1,771
2.451 325
1,542 252 91 831
TOTAL 1959 . 35,001
TOTAL 1958 . 37,907
1959 ~ of 1958' ,
.. 92
36, 151
38,,082: .. 95
36,623 38;.12,1
95
"
. 23,963 2,~,039 23', 990 24, 226' 23,475 'i3,743
.,
25,781 25, SOZ 27, 13. 21~ '217 '26, 158 -'2,6, 076 " , ,
93 -
94 ., 88
~9
90
91
,
.~ ;. - ..,
,
~"
~ '1
31j-
GIE:OImGHA C1R{O!P..'.".. JR{lEJP'O~1rJ(N,<G Slf:~VHCm:
,~,AO:It~U"TURAL
,
I!XTENSIDN,sERVICE:
UNt~lJE''R-s-ir~rQ.F..Gt,o..PG.1,A~ :,~ U. '.,OSPAR""NT-<M' AGRIGUt.TUIINIo',,,,
8 U.NIV~ASITY t# GEORGIA AND THE .
' . AGRICULTURAL MARKETING SIRVICE
' .. ST.~,,! DI"ARTME~~ AGRICU"T,U~E: () , ' , :59~; .~.
EXTENSION .LDO ATttf;~e4.~::r
.._,,~~~~.ns!. georg~a
~..:' _ n T.~, ':.J'~~', ,O~tOQ~r. 208" 1959. .. . _
,.
j ,~:,- 1., ,: ,
GRAI~ Sl~
.. 't ,\
,,3 ' .
TOBER 1, 1959
:
t\ ,~ ;'-4 ~~l~
," ,..; .;, '. i:.:". J
GEORGIA: Stocks of old corn (cr6p of:1958 .orearlier) in all storage p08iticms"~' .,; '. ' . on October 1 totai'ed 3,..070.000 bushels. an h~c'rease of 38 percertt.'::;
from ~~e 2;. 224. 000 bushels in .stora8~.. a year 'ago. Oats .stor.e~ ~n a~l pos~t-i.~1\8~..
aino~ted to 4, '972.000 busheb on. Qclober. 1.a decline of 20 ,percent from the 6,.17.8~..000 bushels in stbrage ;i.:: y~ar '&go. '. Total bushels of wheat stored in aU - .....
positions increased 30 percent from last year to 1. 837.000 bushels. Stocks 9'~(1' '. :~
barle.~ rose 32 percent ~o 192. 000 ,bushels. Rye stocks were up 17 percep~..~~ r :;' .
119. Q~O bushels. ' .
,.
.
,'" r
.. " .. ,jo'
.'
.....
"
'
: .'.
e .......
.,~ ~ " ,
!;',: 1; 'GEORGIA GRAIN STOCKS;' OCTOBER' 1959 'WITH COMPA'R'ISONS
,. '
ON J.t~ARMS
. Oi'F FARMS .' ALL POSITIONS ..
~ GRAIN" : 1958 : 1959 :' 1958 : 1959 : 1958 : 1959 ..
~4'4
. I, 000 bushels' ,
'I. 000 bus,hels
1,000 bushels' . . " .~ :
r"
Corn
,: Z.043
z, 9~3
181
1~7 . 2,224' '3,070 '.
Oats.
: 4, 736
4~ 1~4
1,442
828 6, 178' 4, 972 I~.;
Barley
130
'173
Sor.gh.um' Grain
.'17
,1'8~
-1-5
_1.9-
'14~
17
19i' '. 18 .. - . -.,
Wheat
653
777
762
1.060
1,415 1, 8~1.. \. i .~-
Rye 1,"
.. 97
~_. .~~-'-~.
-':'""'-------------------- - 108
5
. ._---'
11
102
119',. 1.... '.'
.... ! ; ." 'I ..
UNITEO'STATES:' Stocks of old corn. sorghum grain, and oici, soybeans ilt~li''':
: . ' '.... ". ,:... , poslIt\. OnS' on, October 1 jncr.ealiled-to,' . new. recoI rd levels. f'o. z. i l_'_
the d~t-e .. ~ .Corn stocks;of 1. 5 bil.ion bushels, sorghum grain at 501 million and soybeans at '62 'million 'bushels 'exceeded the prev'iousrecords' by~:4. 6~ and-rlJ6~".; ;" percent, respectively. Oat stocks weresbarply below last year and the sm~Ue8(;'
since1944.. 'Barley'stocks were a tenth 'smaller than last year's record'i)'old-' .-';
ing.. Increased holdings of c'orn and sorghum grain above a year ago were" .':-
.. '
I
..., t
largely offset by decreased stocks of oats and barley; 'resulting in less than one' ....
percent increase in feed grains. Wheat stocks of 2. I billion bushels were, a~out .~~
the same as the' previous year but rye holdings were down 15 percent. So~b~a:Q. ):.'
stocks were roughly three times larg'er ,than the previous record carry-over ..... ". stocks ollast year but flaxseed holdings shrank to the lowest level for the dai~:)~'l'" ';
since stocks reports began in 1947.
Stocks of 2, 125 million bushels of wheat stored in all positions on October 1 were the second laraest of record for that date, slightly smaller than the record stocks of the previous year but nearly one-half larger than the 10-year average. The stocks total is nearly double the 1959 production, reflecting a continued large carry-over of old wheat on July 1.
Off-farm wheat stocks of 1.678 million bushels were the largest of record and more than a tenth larger than a year earlier with stocks in terminals and mills. elevators, and warehouses increasing well above previous record levels. About three-fourths of the total off-farm stocks were either owned by the Government or were under GQvernment loan.
ARCHIE LANGLEY Agricultural Statistician In Charge
CARL O. DOESCHER Agricultural Statistician
,
. UNITED STATES
Stocks of'Grains, October 1. 1959 with Comparisons
>,
Grain 'and Position
. . (In thousand bushels)
.
Oct. 1 Av.: Oct. ,1
1948-57: 1958
July 1 : " Oct. l'
1959
1959
WHEAT
On Farms 11
472.718 643,900 114.908 447.305
Terminals "1.1
338. 543 472. 590 391.378 526', 717
CommodityCredit Corp. 3/
55. 30Z
83, 731
81. 067
77.006
-In-t.-M-i-lls-..-E-l.e-v.-8-tW-h-se.s.. .1.1.4/-_5-7-3,-99-. 1---9-4. 0-,-83-8---6-91-, -Z4-1--1-,0-73-.8-0-'9-,-.
TOTAL
' 1,440.554' 2, 141.059 1,278,594 2.124,837
----~~-----------------------------------~--
CORN
On Farms1'"
348,633 344. 187 1. 115. 366 329,632
Terminals-21
34, 157
85, 125 112,944
98, 184
CommodityCredit Corp. 3/
346. 505 611.614 532,214 564,817
- - - - - - - - - - - - - - - - - - - - - -. - - - - - - ... - - - -- - - Int. Mills. Elev. &Whses.1/4/ 102.343
~ -~-
~
.
- 429.568
- - - 445.090 536,354
------.---T-OT-A-L----'----83-1-.6-38--1-.4-70-,-49-4--2, -Z0-5-, 6-14--1-.5-28-,9-8,-7-
OATS
On Farms 11
1,052, lZ0 1.202.549
Terminals 7.1
28.997
38.380
CommodityCredit Corp. 3/
3.370
4,932
':n!: Mi1~~El~:..~Wh~e~'R~ __ ~4.:..54: __ !9, ~80
299.734 898.819
15,847
30.984
6.665
3, 188.
~~63~__ ~~ 06~_
- - - - - - - - -T-O-TA-L- - - - - - -1-.1-49-.0-3-1 - -1,-33-5-,0-41- - - -36-8,-87-9- -1-.0-11-.0-5-6'-
SORGHUM GRAIN
On Farmsll
!
5, 173
13.412
34.553
19.336
Terminals~1
10,667
84.777 119,392 116,804
CommodityCredit, Corp. 31
1,039
3,096
5. lZ2
3.855
-In-t.
----- 'Mills. El '.
e-v-. 8-tW-
TOTAL
h-s-es-. -I-T4--1-
-
-2-2.-99-9-.-
39.878
-2-08-. -11-3
309,398
-
-
-357Z-09..-~5-0358-
-
-3-6 50
1-.4-9-6
1.491
-
!J, E~tirnii_tes of the Crop Reporting Board.
21 CQ~~ercial stocks reported by Grain Division, ,AMS. at 44 Terminal cities.
'31 Owne,d py C. C. C. and, stored in bins,' ships or other storages owned or con..
Golle,d, by .q. C. y. ; other C. C. C. -owned grain is included in the estimates by
posi~ions."
,
,
41 ~ll off-farm ,storages not otherwise designated. including merchant mills.
[j OctC?ber estimates reported by C:rop Reporting Bo.ard. July estimates
repor,t.e-d by Census B~reau.
I,
-,
...
:\ '0'... r. 'j.:, \{, . : '. " . , " '~,.. ~'~"': r~ '~ I-~. . '\. t"I"'~1' ,.~:=OE,:~.~~.I~ ,~~O~. R,.EPO~!~.NG
1.' ' . 'J " .:' .:' , I;'. .:. .,,. ." ,. .i-77 ~ ''''~-. ~'-1"'~ ~ ~ t , \-, Y
1, . 'n.' ,
II
,'.
...., ; 1
. , I,'
.',. ~
.""
~ ~ .
-
\ .,.... '.,
.
.'
.,
.1.;..,.:.'...J"...:.I....';;;,::J. :
.
'
.'.
.
.
.
.
'.
;....
J
.
I
S.ERVI~~E~ .
.
!.
! /.. i '. j' ; '-f'::: r'" '\f ~ ~'~.'., ~, ~~~~~~. r, \ -.. =\"..., ." : ," ;' I ;"1 , I
r . . r r'J 3I'
", "
!',.
"'l
'I
. ,:' , ,: I ,,'.,,'
,t..,~ 'i
l.
'f ',",,"'~;' .
' ",\
.... -
~ ~'\
1\
.. ,
l l,. '~'- J .
.' r '4\ '0 ,,' . ._.
_.J i.;,
",,"
~~.tI~',"':"..
~~., \~' I,
....
,
:.:I~,,.,,~t
".,
,I J,..I:.....J' \
~
...:..-J
'.
.
ft.eleasf,1c1L _tUn 59
..', ,
,."
' I
CEORGIA CHICK HATCHER! REPORT' . ,. "
1.. ,. '.
NIl\/ b '59"
j ES"
\
'.'
..
...
LlBRA'RI',
.
, Athen~, qa. No~. 4 - ~ Ato~ai of 5, '080, 000 br~iler chi s were placed
w~th pr:tOduce.rs in Georgia during the week ending October 31, according to the : q~orgi~ Cr~p Reporting Servi:ce. Tl1is compares with the 4, 802, OOO"placed the:
p.evious' week and is 1 percent less than the S, 121,0.00 placed the same week
l~st year. : ,
, .'
.,
. . ,""
. .. .
'. : Eggs set by Georgia iJ,atcheries amounted to 7,267,000 compared with
7.: 138. 000 the previous week and i.s 2 perce,nt less than t~e 7,394,.000 for the
co,
r
r
e
sp
o
n
d
i
ng
~
..~Iw:. e'ek
. las~
year.
.,
., ~.
. ' I . :." '
-' I
,: I 'the majority of the prices paid for Oeorgia produced hatching eggs were r~portE!d within a range of 50 to 60 cents with an average of 56 cents for all
hatching eggs and 54 cents for eggs purchased at the fa.rm from flocks with
l\~tchery owned" cocktlrels. Last week'the range was "'from '50 to 60 centa',With .
~~ a~erage of 56 cents for all hatching eggs and 54 ce1\ts for eggs purchc"sed
;t.~, the farm from flocks with hatchery oVl(ned cockerels. . Most prices ch'arged
ldr chicks were reported -wi~hin. a range of $8. 50 to $9. Z5 with' an average oj
~9. 0.0 per hundred compared with a range of'$8. 50 to $9.25 with an aver"age 'of
$9. OQ per hundred last week. The average prices last year were 67 cents for
eggs:ll~d $11. 00 for chicks. .
..'
;.':. ; . Weighted average price from 'the Federal-State M~rket' Nerws Service for
~~oilers during the week ending October 31 was Georgia broilers 2 3/4 - 33/4 PQunds, at f~rn.ts 14. 71~.
.
'0 . - --
l
.
-r
j
-
- _. -. --- - -
--_.~
--- --- -
-
BROILER TYPE
W;eek :
E
,
_.
".d
i
i
ng'
:
.
. '. '
". .
~
!.! ' . "
. ':' i
Eg.gs Set.
.- .
."
~ 19:58
!
1959 1959 0/0
of 1958
Ch i cks Plac;ed for
.:Broilers in Ge6rgi'a '.
,
~
I
1958
1959 1959 %
of 1958
, ,
!
"
'.
,
';t'hou.
;
Thou. ' Pereen., t. Thou.. T.:h:.ou. -" Percent
.' !
,
A.ug. Z9 ~,968 6,485
93 5,493 5.331
97
Sept. Sept.
:5 1,2
.;
.'
6y,.
971 298
6,373
93
.6:, 14J . ..' 84 .
5,' 179 4.812 5,' 023 ........; 6M:\ .'
93 93
Sept. ~9 7,31~ o. 6'~ 39'Z . 87" 4~ 873 . 4, 53'1 . 93
Sept. 2'6 7, 141 6,300
88 4,852 4,452
92
Oct. 3 7, 110 6. 538
92 5, 152 4,383
85
Oct. 10 7.248 6,896
95 5, 117 4. 510
88
Oct. 17 7,234 7,000
97 5,077 4, 500
89
Oct. 24 7,239 7, 138
99 5,034 4,80Z
95
Oct. 31 7,394 7,267
98 5, 121 5,080
99
-,.- _. -- .
EGG TYPE
Eggs Chicks Set Hatched'
:
1959 ,1959
T h o u .. .
'
"
.
Tho.. u.
' 1.61 121
1~9
201 217 190 263 150
123 98
.. 168 154
. 166
1~)
91 142 154 163 143 210
11 Includes e'ggs set by hatcheries producing chicks for hatchery supply flocks.
ARCHIE LANOELY Agricultural Statistician In Charge
w. A. WAGNER
Agricultural Statistician
u--. -S-.--D--ep--a.r-tm.-e-n-t--o.f_A.g-r.ic.u_lt-\-lr-e_.-._.-----------A--g-r-i-c-u-l_tu.r-a-l-E--x-te-n-s-i-o-n--S-e-r-v-i-c-e
Agricultural Marketing Service
State Department of Agriculture
319 Extension Building, Athens, Georgia
... ----------_.-------_.-----------------------_.-.----------------------
. EGGS SET AND CHICKS PLACED IN COMMERCIAL ARE
- WEEKS - 195.
~
,:
Week Ending
,
J ..
I
!
STATE
Oct. 11
Oct. 24
Oct. , 31 :
Sept. Oct.
Oct.
Oct.
Oct.
Oct.
26
3
10
11
24
31
EGGS SET - THOUSANDS : '
CHICKS Pl4\CED - THOUSANDS
,;
Maine
1, 197 1,215 1,115'
811
898
831
724
949
931
Connecticut
973
893
949,
346
372
514
445
493
452
Pennsylvania
966
996 1,075:
590
658
597
483
440
623
Indiana
1,424 1,410 1,532
571
494
566
524
633
579
Illinois
167
183
190'
121
83
114
106
95
68
Missouri
1, 169 1, 160 1,216'
598
506
564
514
511
'539
Delaware
1,489 1,371 1,409
I, 125 1,097 1,022 1, 189 1,428 1,563
Maryland
2, '932 2,989 3,052
1,821 1,791 1,880 1,833 1,765 1,869
Virginia
1,755 1,733 1,646
139
832
831
658
443
641
West Virginia
221
252
243.
296
391
381
344
235
405
I;
North Carolina
2,771
2,864
2, 898~
2, 186 2,232 2,202 1,841 2,045 2, ;106
South Carolina
445
466
462,
272
270
283
295
293
302
GEORGIA
7,000 1, 138 7,267
4,452 4,383 4, 510 4,500 4,802 5,080
.r~lorida
Alabama Mississippi Arkansas Louisiana Texas
Washington Oregon California
309 2,958 2,329 3,072
497 2,316
354 281 1, 52.6
289 3, 159 2.,454
3, 147
495 2.,201
338 262 1,608
304 3,313'
2.,390: 3,2.21:
491' 2,275
349 2.50 1, 507,
119 2,405 1,675 2,554
32.7 1,689
194 160 916
145 2,284 1,656 2,620
331 1,596
211 172 962.
161 2,427 1,554 2,483
392 I, 512
260 185 951
155 2,306 1,614 2,656
432 1, 560
205 172 859
148 2,200 1, 771 2,451
32.5 1, 542
252. 91 831
151 2.,667
I, .801 2,723
323 1,336
210 134 ,991
TOTAL 1959 TOTAL 1958 1959 Cfo of 19 58
36, 151 38,082
95
36,62.3 38,721
95
37,220 39,430 :
94,
'24,039 23.990 2.4,226 23,475 2.3,743 25,494
25, 502 2.7, 134 27,2.77 2.6, i58 2.6,076 2.7, ,170 .,
94
88
89
90
91
' 94
3/6
GJEO~GnA CROff ~ia7dB;\i
UNIVERSITY 0
AGRICULTURAL EXTEte'ON SERVICE
UNIVERSITY OF GEORGIA AND THE STATE DEPART_NT OF AGRICULTURE
NOVl2'59
Athens, Georgia
L1BRARIEJ
1rllN<G SJEJR{VllCE
U. S. DEPART_NT OF AGRICULTURE AGitlCULTURAL MARKETING SERVICE 118a:XTE"'ON BLDG., ATHEte, GA.
Novet1ber 9, 1959
GEORGIA C<Y1"1'Olf REPORT AS or NOVEMBER 1
Athens, Ga., Nov. 9 .- GeoJ"gia cotton prospects declined still further dur-
ing OCtober as a result of ac1verse weather c0n4itions, the Georgia Crop Reporting
Service said today. ,Based on information twnished by .crop correspondents as of
Noveober 1,. production 1s now forecast at 520,000 bales, a decline of 15,000
bales, or apprOXimatel three percent froa a month ago. The current crop prClJises
to be 48 percent larger than the 352,000 bales produced a year ago, but 21 percent below the 1948-51 average of 655, 000 ba~s.
The indicated yield per acre of 378 pounds will be the second highest of
record, beill8 exceeded only by the record yield of 443 pounds obtained in 1958.
. Frequent rains during October delayed harvesting operations throughout most
of the state. The excessive I:1oisture and rank vegetative growth caused some rot-
ting of bolls and reduced qual1ty of the crop. Heavy growth ot grass and weeds
as well as cotton plantsJ resulting frcx.l the acple ~isture supplies are makiog
harvest difficult.
.
. census ginnings to Novetlber 1 were 450,000 running bales canpared witb
338,000 to the sace elate last season and 360,000 bales in 1951
..
CARL O. DOESCHER Agricultural Statistician
ARCHIE LANGIEY
.Agricultural statistician In Charge
"
GEORGIA MAP SHOWING IND~CATE~ PRODUCTION ] 959 AND FINAL PRODUCTION FOR 1958&1957
,,;
i~:1~; ~<(,. .". . .".~~~~.;;~M
1957-25,000
I
RIME
1959 production indicated on
November 1.
. - STATE -
1959 - 520,000 1958 - 352,000 1957 - 396,000
Districts shown are Cr~ Reporting Districts and NOT Congressional Districts.
AUGUSTA
. ".'
1959-94,100
1958-69,400
1957-66,000
VII
VIII
IX
1959-64,500 1958-53,700 1957-55,000
1959-95,500 1958-83,300 1957-90,000
VALDOSTA
1959-19,800
1958-14, Boo 195712,000
.~
PLEASE TURN PAGE FOR UNITED STATES INFORMATION
:' , :...
.. ,'"
t. I ' "
I.
,
t.
tJmTED STATES - COTTON REPORT AS OF NOVEMBER 1, 19S9
o
."
The .9rop, Re.pQrt1nl BoUd
of
the
Agricultural
Marketins- .1.
..
'.
,S.~e .,' .' -i
J
..
makes the
to11cnd.Dg l"tlport trOll data tuPn1ahed by crop correapoaclellts, field statiat1c:1aDa,
Bureau ot the Cenna, Commod1t1' Stabilization Service, and cooperating 'State
1... dunnc ageneie. The final outturn of cotton compared with thi. forecast will depend
upon whether the variO\l. ~_noe. a!t..t1ni the orop.
the remainder ot
the .eason are more or
tavorable than uaual.
..Unto y' -
... -
.
- ' - ... "'- - - - ~ -- - ~ ~J"",:-' ..,. - -",'::;''' ... ' - , - ... - ..' -
" . _ t. Ac;res t.
)'ielel per
I
-
-~o' "du-ct.i;.o'r-i-
-
-
-
-- - ..
State. ~,
.
: tor S
'hanested
:hanest:191iS=S7s- -.- -
.&Cl'e ",SOO-~
-7 19~9- -rI9lia.;S;7
~o-s"J:-w1e"!gh1t9.b59al-e-
'1/:.,r..el . I :19S9
19,8 . : indica :avel"age' 19S8 . : .\ indic. '\
. ,\ I - . . . " " - - - -"..- - :- - - ... - - - .- - - .. - . ... - - .' 1_:..
.f
1,000 acres
"'l~
Pound.
~_ ~
'-'I -
~-
-- _ ......... -
-
-
-
-
-
... ~
"
.. \ ' .
,'.,
'\..'
Pounds
Pound.
-.:.___
1~OOO bJ!e,
1,000
~l~s
1,000
bale.
North Carolina
South Caro11.na Georgia~ TeMeee ~'~
3~ ')24 " -466
395
56, 310
660
S15
,238921
406 . 443
SOl'"
3S3 .378 597
,49189 ,67525 .
2S6
325
,20 . : 299 4lS IT')'
352-
419
640
Alabama ~. , 815' 312 ' '98
MiasilS8~ppi '1,440
396 " 409
427
844
S.33 1,710
439
125
9.61 1,600
AH1rk8asnoura,.1,b,
400
1,29$
)96
.)86
446 \ 612 4.36 . "S71 .
366
1,429
275
510
925 : 1,540
Louisiana
495
396
.392
470
624
297
485
Oklahoma
600
184
)65
300
367
)1)
)15
Texas 6,300 .232
)8j
348
.3,95.6' "4.,.306
4,S70
New MeX:l.co.~
198" ',82
'820
8)2
27,
301
34.1
Arizona. )80 8.31
9.31
~60
740
734
760
California 875 748 1,049 1,070 1,424 1,604 1,9$0
other States )/ 58 304
403
.3S8
48
29
43
= = '= ~~~=r~~= =~~:= =~~= =~~= =~~~:==~i~~==~~:~~= =
1/ 'lI --- Au-gu-st-1-e-st~im-J- t8- . ~-~ Pr-od~uc-ti- ol- l g-in-ne-d-an-d-to-- be-g-iM-e-d.--A-SO-O--1-b.~ba.le_J/ oonta1ns about 480 net pounds ot l:tnt. Virginia, Florida, Illinois, Kentucq, W and Nevada. Illc1uded 11\ State Md United States totala. Grown in Texu, N
.~ex1co, Arizona, and california.
-
CROP REPORTIIO BOARD '.
...
t'''"! '
~
<GlEO~GnA C~OI? ~lEJP>O~TnN<G SJEJR{vnCIE
AGRICULTURAL EXTENSION SERVICE UNIVERSITY CW GEORGIA AND THE
lI"" c.,,~JlY OF GEORIIA
STATE DEPARTMENT C)If AGRICULTURE
Athens 1 Georgia
..
NOV 1 b '59
LIBRARIES
U. S. DIPART.NT 01' AGRICULTURE AGRICULTURAL MARKETING SERVICE III EXTINSION BLDG., ATHENS, GA.
November 101 1959
GEORGIA: The AU 'Commo41ty Index Of Prices Received by 'Georgia i'amers de'elined
nine points to 236 percent ot 1ts 1910-~914 average during the. mOnth '
eDded October 15 I 1959. The October 1959 Index was 25 points (approximately
'.
10 percent) belOw the October 1958 Index of
any
month ,
since
Ja. nuary
1.950
when
the
Inde.x
261 vas
1
'and
232.
was
at
the
lowest
level
tor
Lower prices, tor hogs; catt1e-. cottonI corni and peanuts were primarily responsible tor the decline in the Index . Part1~lly offsetting were price in... creases for wholesale milk" wheat) oats; and rye.
The mid-month average ot 8.9 cents a pound (.$178.00 a ton) tor peanuts vas the lowest average price Georgia fB.rmers have reeeived tor their peanuts in the ~st 13 years. In October 1946 the mid-month avvase was 8.6 cents a pbund or
$172.00 a ton.
mUTED STATES: During the month ended October 15 the Index ot Prices Received by
Farmers dropped nearly 1 2/3 percent (4 points) to 235 percent
ot its 19,10-14 average. Primarily,res1'OllS1ble for the decline were lower prices
tor cattleI hogs", corn) grapefruit) calves 1 and eggs. Partially offsetting were
Fiee increases tor wholesale milk; tcmatoes. and wheat. The mid-October Index
w..as. 6 pe',r'cent (1,4'.points) below a year earUer.
'
The Index of-Prices Paid inc1\l41ng InterestI , Tues; and Parm Wase Rates declined 1/3 percent (1 point) I as declines in the "easonally adJusted index ot
tarm wage rates aDd in the index of production goods were only partially offset
by an increase in the index of prices paid'tor goads tor 'family living. The
In, dex was. about 2/3 percept above ~ year earlier.
Summary '!'able tor Georgia and the United States
1910-1In44e=x .
100:
Oct. 15 1958-
UNITED STATES
Prices Re~eived :
Parity Index Y:
Parity Ratio : ,.
249:
?94: 85:
GEORGIA
sept. 15 : Oct. 15
1959_ .. ~_ __ 1959
,
,
I
239 : '~35
'297 : ?96
. 80 ...L.- 79
, Record b~gh . IDa.ex :lJite
. : 313 :Yeb.
195J
: 299:Y APr. 1955
: 123:Oct.
1949
Prices Received :'
. :,
:.
All Commodities 261:
245
:
236
: 310 :Mar.
195)
All Crops : . 276:
265 : 257
: 319: J/Mar. 19..21
Livestock and : .
:
Prod~ct8
:' 229:
." .: 203 : 194
: 295: Sept. _194e
Y y 'J/ Prir.es Paid1 Interest I Taxes; ancl Wage Rates based on elata tor the ind1cate4
dates.
Also May 1959.
Also April 1951.
.,
ARCHIE IAIJIEY Agricultural Stati'st1cian In Charge .
' RAYMOND R. HAN.COCK
.~
A(!ricultural statistician
l' I
c- ,-
'~tucEs RECZJ;VED' BY' FARMERS OCTOBER 15, 1959 WITH COMPARISCilS
.~ ;: ,.
.. . I . , . . ". '
.: ....,
r './:
CO!.fAODITY .lIND WIT
Wheat, bu.
It::,., . 17
..... ., . ~a ,.; .. ~~"'. :.: 4: ....1
'
... ;....
'.
GI!: 0 RG I/\.
,~ 11~Verag;TOot. 151' Sept. J5
1910-1411958
1959
Oot. 15, 1959
UN ITE n S'l'ATE S
I
I
Average Oot. 15, ! Sept. 151 Oct .15
1910-14 1958 I 1959 1959
I
I
I .' I
II
$ 1.23
1.,~4
1.75
1.80
I
I
I ._-
.884 I 1.73
1.72
1.76
Oa.ts, bu.
$ .67 I .95
.80
.83
Corn, bu~ . Barley, bu Sorghum GhinjO'Wt. Cotton, lb.
..;" $
~. $1
$
."
f
.91 12.1
I
I'
1.15
1.1.5
I 2.10
I 34.7
1.17
1.07
1.05,.1., 1.10,
1.95
1.95
34.5
~~.5
Cottonseed, ton
$1 23.65 I 49.00
Soybeans, bu.
$1
I
Peanuts, '~b'.
SWeetpotatoes,owt.
$
Lespedeza Seed,Al1,awt.$
'5.2 .84
2.00 10.4'
iI 4.70
i
Hay, b~ed, per toni
All
$
Alfalfa.' ,
$
Le ipede~a :
$
Soybean, & ,Cowpea, $
Peanut
$
I ", Z7.00
,": I 3259..7000
I 29.00 22.00
39.00 '35.00
I 2.00
1.95
9.0
8.9
4.75
~I
26.00 34.50 29.00
29.50
23.00
4.20
I
I
..II -, 2:5.80
j"34.00 'Z7.00 ag.50 23,.00
Wool, lb.
MUk caws .~, ' head' .'
Hogs, cwt.
I I
$1
33',.'8,~,
'1~3~8O..0oo
I
44.0 1.65.00
44.0 .[170.00
I $ 7 .36 19.40 13.60 12.40
Beef Cattle, owt.
Calves,owt
MUk,Who1esale,cwt .1 J'luid Mkt. Manut. All
Turkeys, ~.
per 9hiokens,
Ib:
, Fa.xm
Com l 1 BroU.
All
$ 3.96" 1~.20 19.20
~.
'lli
I ~3.30 I 24.5~
17.20 22.80
- :' I' $
6.39 6.00
I $
-
I 3.69 3.50
$ 2.43 Y6.33 !IS.90 Y6.10
I 24.0
23 .0 11 23.0
13.3
15.0 15.2 15.2
12.5 14.8 14.7
11.5 14.2 14.1
Egg~, doz ...
I (; 21.4 ,'49.6 40.7
41~3
Y !I Revised.
PreHminary Est ima.te
I
.3991 .552
I .642 1.04
.520 .65C'
1.09
.990
..619 I .865.
.~46
.866
1~.4
22.55
1.57
33.26 I '43.20'
1.52 I 1.48
.. 33.12 ,I . ~2.51
'r 37.90 T '39 .10
1.Q3 .. 1_, ,l!~O
1.93
4.8
10.5
?8.97 ' 8"~93
1.60
2.97 I 2.68
2;54
I
"I,
18.00 18.40
19.90
Z7 .20
19.80
18.3
"
7.V
", 36.1 220.00 18.50
5.42 ,,22.30
6.86
19.90 " 20.5 20.70 21.30 20.80: 21.50 26.10 _ 26..60 i9.10 .. 1~.30
.,43.4
41.8
233.00 I; 2?8.pO
13.40 12.60 ".
22.50 ,I -21.30
6.75 26.10
26.80 25.40
1.60 14.4
4.98 3.34 1/4.46
23.9
, 4.89
I 3.26
!/4.36
22.6
?/4.49
22.5
11.e
15.8
11.4
14.9
'I I 21.5' 39.0
I,
.
9.6 15.7 14.4
j 32.8
9.3 15.0
I 13.6 31.6
,-L'- - - - 1 ,..- - -
PRICES PAID BY FAM;RS roR Sl:IEC'IED lEEDS OCTOBER 15, 1959 WITH CGAPARISQlS
.' '.
---_._------------
- - - - - - - - - - _.
KlND OF """"D
GEORGI/\.
I , mITED STATES
'---r~t-: 15--1 :Sept. i51--O:t~'-15 "\ Oct. 15
SePt.l;--00-t-.-1-5-1
,,:~~ ~59 !. '~59. I ~ ,,' .
_
, 1959, ,'959
1959
~ 7 ~~ Mixe.t llo1rx Feed
JDol: ars Per
Pound,s'
,'
All Under 29'~ Protein
1168%"~
~tein Protein
20}~ Protein
245~ Protein
3.90
3.80 4.10 4.00 4.30
3.85
3.75 4.00
I'I, 3.85 l!
3.75 4.00
3.63
3.57 3.56
3.61
3.57 3.49
4.00~, 4.00 \"
3.86
3.82
4.15
4.25 ,I 3.99 I 3.90
3.63
3.58 ,3.54
< 3.B3
3.89
H~h Protein Feeds
~ tonseed Meal (41%)
Soybean Meal (44~~) Meat Sorap
3.80 4.05
3.65 4.00
3.55 4.00
3.79 4.32
3.97 4.12
3.90 4.12
Grain ~-Produots
Irra.n -
Middlings Corn Meal
3.15 3.35 3.25
3.25 3.50 3.20
3.25 3.55 3.20
2.66 2.79 3.28
2.70 2.85 3.19
2.76 2.93 3.11
Poultry Feed tfroiler GroWing Mash
Laying Mash Sera.toh Grains
&1' III
a.l
~Baled)
a.
All Other
5.00 4.75 4.20
4.70
4.70 4.15
I 38.00
31.00 .....1I_ . _ _.J...
42.50 33.00
4.60 4.70 4.10
4.97 4.45
. 3.91
I II 42.50
I 31.00 -J
28.90 Z7 .20
4.75 4.37 3.86
29.40 26.40
4.69 4.36 3.85
30.60 2'7.40
-
316-
II I r
" " " "~
,.~
~...
1,' "
:, ,',',':::,'/ 'II':. ~~;,,.~ -'''--:.:~'t.:.~; _~."
;
J.
"'::::-
~
I"
~
.1 ! -
..'".!'
'-',
,'- "
~,,,'":..
'. ,"t:,..
";"-t/ . ./ I ;.;.,
if!"":,~,,,(.-~,
"',
L~ '.'",'~~:"' .'). ~.", I ,
':~'; Il:"'\~" 1\'!1&."!':,"~;'\',I..' ,-~:<~'~,{ ~'J
GEORGIA CROP REPORTING SERVICE
".
,
\ \/,.......J 1< \f ,.......J J I~. I~, ---' ..:.-J rr \f J I\ -J
...:......J
\.,
'-J
rI 'J~.-I--J,J 'r:\;
LIBRARIES
11/1 Z/59
i~' :
'CEOR'GIA CHICK HA TCHER Y REPOR T
.!
~.,
~thens, Ga. Nov. lZ -- A total of 5,051,000 broiler chicks were placed
,with producers in Geo:cgia during the week ending November 7, ~ccording to the
:Georgia Crop Reporting Service. This compares with the 5,080, OQO placed the
previous week and is 1 percent less than the 5,095,000 placed the same week
last year.
."
Eggs 'set by Georgia hatcheries amounted to 7,4$5,000 compared with 7, Z67; 000 the previous week and is 1 percent less than the 7,549, OPO for the ~orresponding week last year.
'".'
The majority of the prices paid for Georgia produced hatching eggs were,
:reported within a range of 50 to 65 cents with an average of 57 cents for all
'hatching eris and 55 cents for eggs purchased at the farm from flocks with
,hatchery owned cockerels. Last week the range was from 50 to 60 cents with
'an average of 56 cents for all hatching eggs and 54 centa for eggs purchased
:~i the farm from flocks with hatchery owned cockerels. Most prices charged
for chicks were reported within a range of $9.00 to $10.00 with an averase of
$9. Z5 per hundred compared with a range of $8.50 to $9. Z5 with an average
:of $9. 00 pe~ hundred last week. The averas.e prices last year were 67 cents
f~r egg sand $11. 00 for chicks.
, , Weighted average price from the Federal-State Market News Service
fqr broilers during the week ending November 7 was Georgia broilers Z 3/4 -
3-)/4 poUnd~ at farms 13. 99~.
'
.
".
GEORGIA EGGS~SET.'HATCHINGS. AND CHICK PLACEMENTS
.
,Week EJ1ding
BROIl...ER TYPE
EGG TYPE
Eggs Set.!! ..:~ ...
Chicks Placed for
,Eggs 'Chicks
Broiler s in Georgia
Set Hatched
1958 Thou.
1959 Thou.
1959 0/0 1958
o~ 1,958 Percent Thou.
1959 Thou.
1959 % ' 1959 .. 19 59 '
of 1958
Percent Thou. '. Thou.
Sept. 5 6,971 6,373
,93 5, 179 4,81Z
93
1Zl 154
Sept.1Z
7,Z98 6, 141
84 5,OZ3 4,668
93
189 166
Sept.19
7,319 6,39Z
87 4,873 4,537
93
ZOI 1Z3
s;pt.Z6
7, 141 . 6,300
88 4,85Z 4.45Z
9Z
Z17
91
Oct. 3 7, 110 6, 538
9Z 5, 15Z 4,383
85
190 14Z
Oct. 10 7,Z48 6.896
95 5, 117 4,510
88
Z63 154
Oct. 17
7,Z34 7,000
97 5,077 4,500
89
150 163
Oct. Z4
7,Z39 7, 138
99 5,034 4.80Z
95
1Z3 143
Oct. 31
7,394 7.Z67
98 5, 1Z 1 5,080
99
98 Z10
Nov. 7
7,549 7,45$
99 5,095 5,051
99
140 113
1/ Includes eggs set by hatcheries producing chicks for hatchery supply flocks.
ARCHIE LANGLEY Agricultural Statistician In Charge
W. A. WAGNER Agricultural Statistician
u. S. Department of Agriculture
Agricultural Extension Service
Agricultural Marketing Service
State Department of Agriculture
319 Extension Building, Athens, Georgia
EGGS SET AND CHICKS PIA
",
.,.j .
'
,
" ,-
STATE
OCt.
Oct.
a" " '31
Nov. 7
C
A
"
-,
Week'E~ding ,:~
..'
" '.
'
,..Oct.
,3
Oct. 10
.
Oct. 17
Oct. 24
5
-';2
, ,-
,
. ~-:,:' :~, ~::' ::.~.
:'
.~
.'
.
_0.
I
,"j
.. , ' _.' "...t ..,'
Oct. 31
Nov. 7
.t
.......
-.
::~
.-..
.,
.;.-."
.:-) ~
.'.
.. ,
ios SET - THOUSANDS :
. : .. -. CHICKS PLACED - THOUSANDS
"
. ;. .
,.
~
Maine
1,215
I, 175
I, 183
967* 92'S*- ,-724
949
931
960
Connecticut
893
949
767
3,72~' , 500* ":445 1 493
452
309 '-,
.Pennsylvania
996 . 1,075
1,036
5~
597
483
440
623 - 710
lDdiana
1,410
1, 532 " 1,469
494"
566' -~ '524
633
,579
617 '
lllinois
183
190
184'
~' tn,"
114 . :'106 ' , 95
68
51
,M D"e.ilsaswouarrie
I, 160 .., 1,216 " I, 518:' .~ 1,371 '. 1,409 ' ' 1,633 ..
:, ,506, 1,097
564", ' "574,
I
511
1,022 I, 189 1,428
539 1,563
500 1,484
(
. Maryland
;..
,
Virginia
2,989
~,052 " 3,056, ,
1,733 " , i,646
1,716
1,797 832
1,880 831
1,833 I, 765 " 1, 869 '658 ' 443 ' 641
2,069 860
-' .......... ~:':
" West Virginia
252 .
243
241
391
381
344,
235
405
467
.Ncirth Carolina
2, 864~ , "2', 898
2,858
2,232 2,202 1, 841 ' 2,045 2, 106 2, 103.
South Carolina,
466
' 462
489
270
283
295, . ,293
302 , 300
~~ GEORGIA
b~lorida: , "
Alabama
" ....
"
7, 138
289 3, 159
7,267
304 3,313
7,455
286 3, 150
.. ,: 4,383 .:: 145 .\ 2,284
4,510
167 ' 2,427
. 4,.500 : 4,802 ., .. :1,55 ; , ,148
2,306 ' 2,'ZOO.
5,080 '
151 2,667,
5, 0:51
151 2'; S~8, '"
Mis'si8~iPlri , .
2,454
2,390
2, 591 '-OJ
1,656 I, ~54 1,614 l,7'U.> 1,.-801,' ~1.706 ..
Arkansas'
3, 147 3,227 -: 3 395 " "
2,'620, 2,483 2~~6'56 2,451:::' 2,.723,:, '. 2, b90 .....
Louisiana
495
' 491 ' . ' 46i .' .,,: .
331
392
'~32
.325
323
279
Texas
,
Washington
2,201. 338'
2,275 . 2,229 . . . I, '596 1,512 1,560 I, 542 ,1, 336 1,490
349
319
211
260.
205
252 ,; , 210
290
,,
..~'
Oregon
262 '
250 . . I 227
112
UJ5
,172
9(-. 134
170
California
-'" TOTAL 1959
1,608
1,507
1, 594' ..
"978* 951
859 ' ! 831 '. 991 I, 131
,',
,~
~
..
,'
36,623
.37,220
.
'37, 857
'
":,.:'
" ,
23,999~ 24,306* 23,47~ 23, 743, '25,494
25,976
..
..
,'
"
TOTAL 1958
"
" 1959 % of 1958 "
38,721
,
95
39,430
.'
4-0,OU) ".
:',
:,'
~
Z7,: .
-13
4'
27,277, ", .~.
' . 94
..
95
' .. ..
88'
89
26, 158'
. '-~ ,
2.6. ,-076
27,170
27,429
,'
'90:~ , " , 91.' ~. :.' 94' .",., 9.5...
. ,- .
. I
: ; ..
-,.~"
..
."
-.~ "
... '!
Revilred. ,
3/S
G[OJR<GHA eJRQ)JP>
AGRIC-ULTURAL EXTENSION SERVICE UNIVERSITY OF GEORGIA AND THE STATE DEPARTMENT 01' AGRICULTURE
U. S. DEPARTMENT OF' AGRICULTURE AGRICULTURAL MARKETING SERVICE 111 EXTE... ION .L.OG ATHENS. GA.
Athens, 'Georgia
November 12, 1959
.
rem GENERAL CROP REPORT dEWY:-"ns.Jp NOVEMBER 1, 1959
BIG CORN CROP: Corn production in Georgia is forecast at 81,984,000 bushels baSed on conditions prevailing on November 1, the Georgia
Crop Reporting service said today. The 1959 indicated production is second o~
to the record crop ot 86,752,000 bushels produced 1n 1958. The current~ est1rJated yield per acre ot 28.0 bushels 1s exceeded only by the record high yield ot
32.0 bushels produced in 1958. Harvest operations were delayed in October by continuous rains during most of the l:1onth.
GOOD SOYBEAN CROP: Soybean production in Georgia 1s forecast at 1)312,000
bushe ls, an increase of 17 percent above the 1958 production of 1,125,000 bushels. The current yield per acre estimate of 16.0
bushels is a new record high for the State exceeding the previous record ot 14.0
bushels made in 1957 by two bushels. Conditions have been tavorab1e for soybean growth this year with most fields having a heavy set of beans. Combining is underway although rank vine gro~rth has harJpered harvest operations"
PECAN CROP DOWN: Current indications point to a Georgia pecan crop of 37 rJillion pounds, 18 percent below the 45 million pounds
harvested in 1958 but up slightly from the 1O-year (1948-57) average production
of 35, 370,000 pounds. Harvest of the pecan crop was hampered by the continuous rains and cloudy, damp days that prevailed during most of OCtober. Production
v~ies considerably among the ditfe~ent areas ot the State.
PEAN'l1l' PROSPECTS DECLINE: Georgia peanut production is estimated at 545 .. 000,000 pounds based on indications as of
November 1, the Georgia Crop Reporting Service said today. This is a drop of about one percent from the October 1 forecast as continuous rains during October lowered yield prospects. Peanuts harvested in October were dacaged by the rains
With the reduction in quality causing LlanY of the peanuts to go for oilstock
.The. Novelll'ber 1 indicated yield per acre of 1,090 pounds is 100 pounds below the 195e r~c;ord per acre yield of 1; 190 pounds but 1s higher than all other years of record except 1956 when 11 090 pounds per acre was also produced.
MILK PRODUCTION UP: Cows on Georgia tams produced an estimated 100 million pounds of milk during OCtober I an increase of two per..
cent over the 98 million pounds produqed during OCtober 1958. Excellent 'sucmer pastures in all areas of the State prOVided good grazing considerably. later in the tall than usual.
GEORGIA
:ACREAGE:
CROP
:. (000) ':
YIELD PER ACRE
Ta.rAL PRODUcrION (000
. . . . . AND
: Incti.cated:
: Indi-
. UNIT
: 1959 :Averase : 1958
Nov. 1 : Average : 1958 : 'cated
. 9
~~5 CORN, ALL .... bu.: 2,928
32.0
19~ : lt48-~7 : :0 5,17 86,752
~
'Bi,
~ bu.: 100
16.7 230
.21.0 2;099
1;633 2,100
OATS bu.: 259
28.0 330
32.0 11,412 9,108 8;288
BARLEY bu.: . 13
239 290
29.0
189
290
377
R'XE bu.: 16
10.0 125
125
78
HAY, ALL tons: 611
.73 1.02 .. 1.03
679
162
200
641
651
TOBACCO, ALL .lbs.: 72.1 1,248 1,540 1,498 119,353 91,018 W7,985
POTATOES, IRISH, CWT: . 4.1
46
46
53
312
222
215
ParATOESJ SWEET, C\-lr: 10.0
CO'ITON bales: 660 PEANUTS (P&ll') lbs.: 500
42
48
.!/2J83646 -,414903
47 1,137
528
470
,308990
655 540)052
352
535
612,850 545,000
SOYBEANS
tor beans bu.: 82
11.1 12.5
16.0
536 1,125 1,312
SORGHUM
tor grain bu.: 33 gj19. 1 24.0
250 gj581
888
825
PEACHES Total Crop bu.:
-
-
-
-
2,101
4,000 3;200
PtARS
Total Crop bu.:
PECANS lbs.: PASTURE, CONDITI~:
---
.. -
--
68
68
-- 147 35;370 85
98
85
45,000 37,000
g Y Pounds.
Short-time average.
ARCHIE LANGLEY Agricultural Statistician In Charge
RAYMOND R. HANCOCK Agricultural Statistician
PLEASE TURN PAGE FOO UNITED STATES INFORMATION
UNI'1'ED STATES - GENmw. CROP REPORT AS OF NOVEMBER 1, 1959' .'
.t 'Tpta1 i:lrop. p~oduction equal to last year's record now 'seems assured. A
slight~.improved outlook for. cotton, sorghum; rice a~ sugar beets counteracted
small r~duc~ions in corn and soybean prospects. Harvest progress is lagging be-
him, the rapid advance during the sunny October days in 1958 but is ahead of the
unusually slow. rate during the' cool)
tall of 1951.'
CORN is estimated at a record 4,402 million bUShels, 1 percent less than
October 1, but 16 percent above 1.958, 'and' 35' percent above aver.age.
SOYBEANS, second to the record crop of last year,' are estimated at 528
million bushels, down 8 percent from 1958, but about 62 percent above the 10-~ar average.
SORGHUM GRAIN is estimated at a r~cord 589 million bushels, down 4 percent
from 1958. but abo.ut 2 3/4 times' the '10-year average.
.' '
RICE is estimated at 53 mi'llion lOO-poUhd. bags, '1 percent above october 1.
13 percent above 1958) and 11 percent above average. '
.
"
APPLES are estimated at 118 million bushels, '1 percent below last year,
but 8 percent above average.'
.
PECANS are estimated at 123 million pounds, 5 percent below OCtober 1,
29 ~er.cent below last year, and 18 percent below average.
CRANBERRIES, es'tilDated at 1.2 million barrels, are down 2 percent from October 1, bu~ 1 percent above 1958, and 28 percent above average.
EGGS laid during October, at 4,784 million, were down 1 percent from 1958 but 12 percent above average. : .
- - ,\- - - - - - - -' - -: - - - -:' -U:-NITYEiDeldSTAPTeErS:-' -: - - - - -ProductIon -, - - - --
CROP
': Acreage: Acre Indic.: Average:
: Nov. 1,
-'" - -. - - - - - - - ~ ~: .- \o15ao5J~'-::-N-:o- v.-.1~ -19.~"-9:~ -1\9o4O8o-Jl7- -::-., \O1O95oT8 - -::- \O1O95o.2T- -
Corn, All ~ bu.: 84,387:
52.2: 3,251,064 : 3,799;844 :4,402,416
Wheat, 'Al1 .. bu.: 53,217:
21.0: 1,075.391 : 1,462,218 :1,117;430
Oats . bu.: Cotton . ,'...bales: Hay, All ... ton:
Soybeans, for beans bu:
Peanuts gJ ...~.. lb.:
28,823: 14,991:. 70,991:"
21,968: 1,496' :
y
37.3: 474;
1;306,458 : '1,422,164 :1,075,3'78 14,046:. 11,512,: 14,801
'1.60: 107,134' : ", 121>~: 113,884
24.0: 326,020.: 574,413: 528, ~
,'1,107 ' : 1,642,502 . : '~,835',800 :1)65~,~
Tobacco ... lb.: 1,157: 1,557: 2;090,481 : 1,736;204 :1;800,,251
Y Y Pounds.
Picked and threshed.
- - - - - - - -. - -. - - - - ALL PECANS~-:- Production- - -:- -:- - -:- - -,.~ ~ .- - - ~-
__8'N.E_ ..: _0'_ l
Aye!.as.e_1~~-.2.7 _' __:
1:92,8
l P".e.!i!!!i~_1252,
': .. ,_ . ,1,000 pounds
. . .1,000 pounds
1,000 E0unds
N. C.
::
2,023
. 3, 200
'. 950
s. c. '
:.,. 3,640'
. 8,000
3,000
Ga.
:
35,370
',. 45,000
" 37,000
Fla.
".:
4,860
2,600
2,500
.Ala.,
, :. "
~6,688 ;
:.
37:,600'
9,000
Miss.
' :.'
'9,515 .' ~
16,'000
4,000
Ark. La.
:: :
- 5,549 16,490 "
."
2,350
5,000
14~'OOO': . . 20,000
Okla. : ' , :
'18,620
15;'500
14]000
~s
:
35)040
26,000
23,000
N. Max.'
:
gj 3,030
4, 590
4,900
u. S.
- - - - - - 150,521 - ,- - - - - ~ - 174,750 - - - ~ - -1237350-
yBudded,-grafted7 or-tapworIred-varFeties":' -g Short-time-aVerage7 - - - -.---
"
..~.
h
~.-;;
;'~. :,'.'
~)5"
,.~:
mag IBSmlEZA SEED PRODUCrION UP 38
.......
w
:.:
GEORGIA: The 1959 J.espedeze. seed production :in' Ge~a -is e~,cted ,to be, 4,200,000 pounds i ac~'orCUDg -t~, the' Oeorsia, CrOP. Reporting ,service
The current," crop 1s 38 'percent "above the ,3,040,oo(f pounds harVes~d .1n",1958.' ~
increase in productioh i8 due 'to a larger acreaae and' yie,ld ,~r' acre than" last: ~ar. Indicated acres. tor b&rvest is 21,000, or 5,,000 ~,~ :~s,t 'se~son.' ','; aExvpeectread,gyieel.d',per acre of 20' 0 PQ~s is. 1..0 poUD4a above 19,58 and 25 p.o. .~s a'.bove '
veri . Weather cOndti0D8 were
't~~orabl.i 'for the :leBpe!deza seed-~ ~~a~ 'dup-
ing September arid :OctOber enabled the Kobe and 8ericeai varieties to 8t$7, green
and growing mueb~ .lOnger than us\B1. Harvesting ,.operations are ,l:ater t~ normal: ,.
The 1959 prodtmt1on by varieties is as follows: 1J oo8,OOOiand ,~rean) 252.000 pounds.
SericeaJ
.2,940J OOC)i
Ko~,
... "
'.' " .~.. "
tEARs" '.' "
"
UNITED STAT!s..tESPEDEzA SEED 1fARVEST LATE: CROP SMALIEST IN' FIVE
''!'he 1959,:-:c~QP Qt~:M"ped~~a
Crop,Re~ing'Board announced t
seed i oday.'
sTfhoisre
cast at 123:,740,000 is ~ per~ent, less :t
pounds, han: las
the
t ;ye
ar's
,.,
,.
,
outtUrn Of l4S)015,OOO pounds and 17 percent less than the 10-year avera8e pro-
duction. .
If
t~
~..
crop ",turni s
out
as
forecast
it ,W. ill
be
the: small.est'
since
195~.
' '::.
I
.
.
(-i' .
I
....
'.
<
',fhe cur~t;lt fore~~st' . ,1ndi:cates a marked shitt in production by species. and
'- varictties. ~uetiot;1:of. ~:re'an is _~ sharp~, but .prospect:t.ve .crops, are . .'.', .
!Ounds, larger tor Kobe, Sericea,: e.n4 'Tennessee 76 and C~on. The estimated production .. ..
for each' in thousand
with last year in parenthesis fol+ows:
.':
Korean 74,567 (101,470 j Kobe 37,014 (36,332); 8ericea 10,428 (8,371); Tennessee
76 and Cc:mnon 725 (666 i and other varieties 946 (1,176).
Product1cm is eXpected to be ,smaller than last year in 8 of the, 15. Statel! --
4. along the Western edge of the producing area inc1Ucung illinOis, Milisour1';:
Kansas, and Oklahanai and 4 states along the Atlantic Coast from Maryland to
South Carolina. However, increases are expected in Georgia, Alabama, Mississippi. Arkansas, Tennessee) Kentucky', and Indiana. The bulk of this year's decline in
production occurred in Missouri, the leading lespedeza seed producing State. Growth of lespedeza in this State was retarded by trosts in late spring and dry
weather in July and August. As a result of the general need for hay, much of the lespedeza that made a fair growth' was cut for hay leaving less for seed harvest. Heavy rains and floods in October further reduced the acreage that was intended for seed not on~ in ltl.ssouri but also in Oklahoma and I<ansas. The Missouri crop ill forecast at on~ 22,800,000 pounds, less than one-halt the 46,800,000 pounds produced last year. In North CarolinaI the 2nd ranking State last year, lespedeza made good growth but wet weather in OCtober caused abandonment of some acreage intended for seed. Production in this State is estimated at lBJ 81O,OOO pounds, down 10 percent trom 1958 crop of 20,800,000 pounds.
In contrast with the declines in the west and east, the srOW1ng season from Kentucky southward to the Gul:t ''laS favorable for lespedeza, and larger seed crops are in prospect. Increases over last year of 38) 20, 17) and 14 percent,
respectively, are indicated for Georgia, Mississippi; AJa.bama, and. Tennessee. The Kentucky crop 1s up 8 percent with increases in the Franklin-Russellville
area and in the central part of the State, but prospects are not so good in the western part and in counties along the Ohio River.
The acreage harvested and to be harvested tor seed is estimated at 604,000 acres) 12 percent below last year and 19 percent below averaae. '!'he U. 8. yield of 205 pounds per acre is 10 pounds less than last year. Because of the late harvest) estimates of both acreage and yield contain a greater than usual elmnent of growers' intentions and appraisals.
(OVER)
Supply of 1espedeza seed (1959 production plus carry-over by 'farmers and dealers, on June 30, 1959) for the 1960 planting season is indica-ted at 138;647,000 ,pounds,'~,~, 15 percent less than the 162,374,000 poWlds last year an4 16 percent less than averege. The current~ indicated supply is 6 percent short of last year's domestic 41sappearance of 14~1;467; 000 pounds and also the 1O-year average usage of 147,873,000 pounds.
Lespedeza Seed: Acre8.8e harvested, Yield per acre, and
_ _ _ _ _ _ _ ~2d~C!i20__A!e~_124-2.7L~~1_12.5~ ~ !929
... ' _
:__A1"!aae_h!.1'!e!~_d _:,
Y!e.!dy!r_a1"! __ lP!:~u,t!o~ ::. l!.~ !e!,d_
.:
:
; IncU- :
:
: Indi- :
:
: Indi'-
State :Average: 1958 : cated :Average: 1958 : cated :Average: '1958 :,cated
___ ~124-2.7~
1 _1252 ~12~-2.71 __ '__:_ !92.9_:!9~::.51:
~ ~1252._
:-
1)000 1,000 1,000
: Acres Acres Acres Pounds Pounds Pounds pounds pounds 'POunds
Ind. : 25,600 21,000 22,000 200 220
5;264 4,620 !i,840
Ill. : 24,000 26,000 26,000 181 200
4;458 5;200 4)160
Mo. : 206; 500 208) 000 114)000 196 225
42,440 46,800 22) 800
Kans. : 29,450 14,000 14;000 200 240
6; 740 ,3,360. 2,870
Md. y18,167 19,000 18,000 y236 210
y4,386 3,990 3,240
Va. : 24,100 28,000 21)000 173 160
4;348 4,480 3,150
NC. : 139" 300 104, 000 99; 000 100 200
26, 524 20,800 18,810
S.C. : '42,000 47,000 47,000 166 170
7,468 7;990 7;755
Oa. : 41 1 0 16 000 21 000 175 1
7
040 4 200
Ky. ': 3,000 5,000 70;000
0
13,710 :, 5, 00 , 00
Tenn.' :'" 51,700 88,000 100,000 178, 200
9;546' 17;600 20,000
Ala. : 14,700 9,000 10)000 149 190
2;230 1,710 2,000
Miss. ': 12,450 8,000 9,000 136 150
1,775 1,2QO 1,440
Arlt. : 42,500 30,000 29,000, '258 350
375 11) 195 10,500. 10;875
- - -: .'. - - yOuSk.FliSao..r::t:~-It6I'mO3eI0V5\ab_v8e82r'O~0Oe0O0.--6044~o0O0O0-
-:
1C;0
f2b: -
-
-
225
-2-12.-
--,
--
200
-,2-05-
-1-li-18'~2~64,S46--1-li-18,~1-o2I5-5-
800
~12-3"L7_li3
REISSUED THROOOH ~RGIA CROP REPORTIm SERVICE' - NOVEMBER 17, 1959,
.r
..
.,~ ': '
~
" .. '
":: ,I'
..
,'~
; -:.~
,',
v
,,.I,.'
,'I
.1 i ~'"
,',
",
'~,
"
.:!
......
.. I
r"
I,
.,
~
'I'
\' ;.
It!.
,. '
...
. .....: _\ _J
,,
"
. I. '.,e
.'.~' r. .,',
... '
:
:,.
I
,
315
;:.~ ...~\ ;. ~':'. ~11: ~ .~:f'?I~~I~If~ C~R 9l~." ~~. ~ ~-::I N~ '.
. ..
OR
S.f R(V ICE
":\f (, .. { :'::
j.'~"'I('\>."""". ": ''':'.;, ~'":1it' J:/~.,; ...'..
.
I:."
.
\ '\';"
:.'"
r'--~-J.''.,r---'J,.~~:;
1:<:">..
.:.
r .~..
:
(~:
;.
j f 'J- ~ " 1 I~.".
(
,
...1 ..~-
:' .:.
1
:~\:\.. ..1".~,"":...
. I' ,.
Ij.---J A
If-:J'.~; ~,
...:....;...J ....:..-.J '::
I'
..:-J
..
J \ i \ ;,\\\~ ,(I. "'~ " '..".t ')".,.,:'_'
"( ,, 'j (T '. "J. r J f ~t-~,.'
I,,:
,,\~ ~,f'\
l~
\.
' , : t .. 1,'\'
..' . . .
I:. I :. ,-,. . . . "'..., -,
' _J . '-;-":"-'~"~'~l.,..~_. ,I,
~., <1\'"
:
I
- , ' ~
JI ..: ,:r; :
..
.
~e.lea.8,eQ.,-.1-l1J ,I-
,J _
:,1 ~r'
.t ~;
~ \
-.'"
I,.
. JI ' '-.;.J
,..:...-l
.!
, .- U NTYIOFV . GEOE R'iA R S I ' i 18/59
H
,j
I;' I
?w~ Ji\!2~0h
R. GAtlhAeinC.~H:i; <e?~~~':/~~~JT:q~;H"'iE8'R:~"Y~
p.rodu;cers in Georgia du'r
AREtPoiOa~R~~~
ing the we
~',.
ek
O5~&~~'V~A~U{)it'5:9.1 Lt i~kS.'.~.e.r;.~.
ending Novembe-1 14, accord
p~I ced
iI\g to t
h
e
Geprgia'Crop Reporting Se.ryice .. , Tqi~ comp~res with t~e 5, 0.51, 9,00 placjed the
p~,vfous we~.~ !~~~ ,~;~.r!{r.~~~t ~~~,e' t,han the '5, 0,1,6, O~?~~pl~c~.d the s~.~e ;week
last year.
'.. ,.
'{
,' . ".\ .. ',' _'. ".
'. 1'., .","'" -.t.:..'.
\ *' .... I ,;"', '.
_
... ".
6.
..
.'
.,.
:
"
.
,.J'
I
... ."
~..."
'
~,
'_
"."J
II.
"Egg~ aet by Georgia hatcheries amounted to 7, 501,000 compared wjth
7, 45~, QOO~the pr,evious week and is ~ pe.rcent less than the .7, ;~95, 000 for~the
corre's~c;lilfg week'last y.e-ar': ". .;
. ':
I':.: \
':' ',.}: ';':''':;'':\:~.. :':.::"
. ',.
'. . .
..~~:(.~:~r I.~:.
'.'..'' ,'
~.
I
~
Tfie maJorify~.or-the"pl'ree.spaid for Georgia "prOdUced hatching eggs ;were
reported ~thin a ral1ge of 50 to 70 ceI\ts with an average of 68 cents for ~ll
hatching eggs. and 57 cents for eggs purchased at the farm from flocks wi~h .
~~tchery 6wnE;<k:~QC~erds.,::: ..L,~.:,~~e.~\,t~e,:~ang~. ~.~!:f!!'.9m 50 to 65.~n.t'S':~ith
an average. of 57 cents for all hatching'eggs and 55 cents for eggs purcha~ed
_. at the farm from flocks with hatchery owned cocke~e1s. Most prices cha~ged
of for chicks were".~eported within a1ral),g~ of. $.9 ...00. to $UkZ5 With an ave.~age of
$9.50 per hundred comparEld with' a range $9.:.0(r~ '$1'0. 0.0 with an a:Yerage of
. $9. Z5 per hundred last week. The average prices last year were 67 cents for
. ~ggs
:
and
$11. 00
'for
c h. i c k s . !
,.'. -::. . ~
: " Weig~~ed ay.,er.age pr'ice from tbe. "''''ederal~St~~ Ma.rk~t ~ew~ Se~.viJe for
broilers. during the .week ending November 14 w~.Is'G'eo-rgia broller'l:J Z 3'/4~-
~ 3/4 pounds at farms 13. 75~.
.i
"i
.\
.!
I
."'.:'
.~ !
...I I
:' I
Week Ending
GEORGIA EGGS SET, HATCHINGS, AND CHICK PLACEMENTS!
f. '" ..~
',' , I BROILER 'TYPE
EGG T;YPE
Eggs Set !!
Chicks ,Placed for
Eggs Cthcks
, ~roi~ers.in .G.e~rgia .. Set Hatched
/ ..
. 1-958 :" :. l cis9-
1959 % ,1': 1958
. 1959
./195,9 0/0
1959
1959
'\
I
of 1958 .
of 1958
I,
,I Thou. Thou.: IPercentIThou. Thou. Percent 'Thou. Thou.
:r:
I .;.
! i '~I (.,
i
"1
S,ept.1Z
S~pt.19,
7/2908 .; 6: 141 ,7,319 6.39Z
84 .S,. Ot3' 4,668
87 4,873 4, 537
93
-189 . : 166
93
;~01
lZ3
I Sbpt.U~
,7. 141 6,300
88 " ~, 85Z.; 4,45Z
92
:~17 . 91
Oc~;" ~
dcf 1Q
dct. 11
1, 1l.E)
' 7 . Z48 7,Z34
6, 5}~. 6,896' :" 7,000 -.
9Z. , 9'5.
.. ,5~~~1.51 .fZt:..
.. ','7
.
97 5,077
4,3.83
4; 510.. 4, 500
85
88
89
Oct. Z4
7,Z39 7, 138
99 5,034 4,80Z
95
'190 i 14Z
lZ63:t ,154
11555021
'163 143
Oct. 31 Nov. 7 Nov. 14
7,394 7, 549 7,595
7,Z67 7,455 7, 501
98 5, 1Z 1 5,080
99
99 5,095 5,051
99
99 5,016 5,054
101
98
~10
140 113
1Z4 116
r,1/ Includes eggs set by hatcheries producing chicks for hatchery supply flocks. Revised.
ARCHIE LANGLEY Agricultural Statistician In Charge
W. A. WAGNER Agricultural Statistician
---------._._----.---------------.----.----_.---------------------._._.--
U. S. Department of Agriculture
Agricultural Extension Service
Agricultural Marketing Service
State Departm~nt of Agriculture
319 Extension Building, Athens, Georgia
------------_.------------------------------------------------_. __ .. --_.-
":""....
EGGS SET AND CHICKS PLACED IN COMMERCIAL AREAS..- BY --
o Week Ending
KS - 1959 P
STATE
Oct. 31
Nov. 7
Nov. 14
Oct. 10
Oct. 17
.. 9ct.
Z4 ~
0
Oct 31
"
Nov. 7
..
Nov: 14
EGGS SET - THOUSANDS
CHICKS' PLACED - THOUSANDS
L
Maine
I, 175 I, 183 '1. 186
9Z5
7Z4
949
9Jl
960
975
Connecticut
949
. 767
785
500: 445
493
45Z
309
435
Pennsylvania
1,075 1,036 1,085
597
483
440
6Z3
710
70Z
Indiana
1,53Z 1,469 1,493
566
5Z4
633
579
617
62.8
Illinois
190
184
ZZl
114
106
95
68
SI
99 .
Missouri
1, Z16 I, 518 1,493
564
574
511
539
500
557
Delaware
1,409 1,633 1,660
I,02.Z 1, 189 1,4Z8 1,563 1,484 1, 506
Maryland
3,052. 3,056 3,Z8Z
1,880 1, 833.. ,I, 765 1,869 2,069 2.,09Z
t
Virginia
1,646 1,716 1,774
831
658 .. 443
641
860
840
West Virginia
Z43
Z41
Z4Z
381
344
Z35
405
467
489 .
North Carolina
Z,89&
Z', ~58
3, 151
Z,ZOZ 1,841 2.,045 2., 106 2., 103 Z, 190
South Carolina
46Z
489 -' 383
Z83
Z95
Z93
30Z
300
344
GEORGIA
7,Z67 7,455 7,501
4, 510 4, 500 ..; '4, 80Z 5,080 5, 0.51 5,054
~
Florida
304
Z86
2.47
167
155
148
151
151
150.
Alabama
3,313 3, 150 3,Z45
Z,42.1 2.,306 2., ZOO Z,667 2, 588 Z,591
Mississippi
Z,390 2, 591 2,65Z
1, 55-4 1,614 1,771 1,801 1,706 .. .1, 793
Arkansas
3,227 3.395 3, 593
Z,483 Z"'656 2,451 . Z,723 . 2;6~b Z,815
Louisiana
491
461
503
39Z 43Z
325
3Z3
_279 . .~Z79
Texas
2,275 2.229 2,390
I, 512 1, 560 1, S4Z 1,336 1,490 '1, 508
Washington Oregon
349
319
343
Z50
2.Z7
315
Z60
205
Z52.
.210
:~290
282
185
17Z
91
134 . 170
157
California
1, 507 I, 594 1,555
951
859
831 '. 991 1, 131' 1, 172
TOTAL 1959 TOTAL 1958
-
1959 % of 1958
37,220
39,430
:
94
37,851 40,010
95
39, 099-' 40,611
96
24, 30:~ 2.3,475 Z3.743 25,494 25,976 Z6,658
..
27,Z77 Z6, 158 Z6,076 2.1,. 170 27,429 27,651
89
90
91
94
95
96
3/~
GJEOlR{CllA (clRO>~ l'HhGU ,Q~1rnNG SJEIR\Vncm:
U'I'
.,a'
AGRICULTUlltAL iXTENSION SERYICE
U. S. DEPARTMENT M AGRICULTURE
UNIYERStT,y oit GEORGIA AND THE
AGRICULTURAL MARKETING SERYICE
ST~T. D.PMTMENT M AGRICUI.TURE
II' EXTENSION .LOG., ATHENS. GA.
Athens, Georgia
November IS, 1959
I~
:"
This summary of poultry information 'on hatchery pz:oduction, poultry slaughter,
egg production, pertinent price data and end-of-month storage stocks is being
furnished you in a cQndensed fC?rm to enable you to have a ready current"
reference.
"
'
POULTRY SUMMARY. OCTOBER, 1959
l
Item
' L.. ~" i '
ir- r
.
I During October '10 of
1955!!
last 1959Y year
Thou!
Thou. Pet. ,
Jan. throulZh Oct.
1 1955!!
1959~1
Thou.
Thou.
Chicks Hatched by Commercial Hatcheries: ,
Broiler Type
Georgia
, . United States
,
'
Egg Type
"
Ge.orgia ,-
United Stahu
..: -::.
" 'I.
l
"
j
_... .:.
, ~
: ~!
J.
.. - J
- ; .
. ~ ~~ I,";,"
i ; I '
I.
..... " . .-
~
.. J
~3,343 21.433 92 133, 512 119.667 90
o If~
f
"
.. L
:.
f
;,
.. -... -....
~
.,..
-. . .. :'
265,217 274,769 1, 538,615 1, 547,826
., .'
1,004 16,904
I 705 70 14,375 85
9,769 560,528
14,771 518, 528
0/0 of
last year Pet.
, "j
104 101
151 93
Commercial Slaushter:~
Young Chickens .'
Georgia
United States I
- Hens and Cocks Georgia
.-
"
.
United States :
.
Egg Production:
24,945 143, 575
487 17,723
Mil.
Georgia
41
South Atlantic- ,
United State s
119
I
511
4,818
24,795 140,033
.J ,
99
246,374
98 1,289.348
.
251,059 102 1,386,671 108
,
559 115 17,015 96
--- 3,445
-- --- -4,656 135
Mil.
136 114
J
546 107 4,784 99
Mil.
.~< -
1,117 5,098 50,489
Mil.
1, 317 118 5,704 112 52,075 103
11 Revised. 21 Preliminary. 31 Federal-State Market News Service--For the
purpose of this-report a commerCial poultry slaughter plant is defined as a plant
which slaughters a weekly average of at least 30, 000 pounds live weight while in '
operation. (Converted from weekly to monthly basis.) 41 South Atlantic states:
Del., Md., Va . W. Va., N. C., S. C . Ga., Fla.
-
.. , Item ,.
MID-MONTH PRICES RECEIVED AND PRICES PAID
Georgia
United States
Oct. 15 Sept. 15 Oct. 15
1958
1959 1959
Oct. 15 Sept. 1~ Oct. 15
1958 1959
1959
Cents Cents Cents Cents Cents Cents..
Prices Received:
-- -
-,
.
.
Farm Chickens (lb) Com. 'Broilers (lb) All Chickens (lb) All Eggs (dozen)
15.0 15.2 15.2 49.6
12.5 14.8 14.7 40.7
11.5 14.2 14. 1 41. 3
11.8 15.8 14.9 39.0
9.6 15.7
14.4 32.8
9.3 15.0
',
13.6
31. 6
Prices Paid: (per 100 lb. ) Dol.
Dol.
Dol.
Dol.
Dol.
Dol.
Broiler grow. mash Laying mash Scratch grains
5.00 4.75 4.20
4.70 4.70 4.15
4.60 4.70 4.10
4.97 4.45 3.91
4.75 4.37 3.86
4.69 4.36 3.85
. ~-.------------ .... -._--_.-._--.---_._----------------------------------
For this project State funds were matched with Federal funds received from the Agricultural Marketing Service, USDA, under provisions of the Agricultural Marketing Act of 1946.
---._ ..-.---------------.-.---------------_._-------.--------------------
End-of-Month Stocks of Poultry, Poultry Products, Meat and Meat Products,
United States - October 1959
.
~: Decreased by 6 million pounds; October 1958 change was an increase of 14 million pounds; average. October change is an'increase of 15 million pounds.
Pork: Increased by 21 million pounds; October 195'8 increase was 7 million ". pounds; average 'October increase is 12 million pounds .
. .. ).
Other meats: Decreased by 2 million pounds; October 1958 change was an increase of 8 million pounds; average October change is an increase of 3 million pounds.
Commodity
!,
Unit
October 1954-58av.
Thou.
October 1958
Thou.
September 1959
Thou.
October .. 1959
Thou.
Eggs:
Shell .......... ...... Case
563,'
207
554
465
Frozen eggs, total. .. Poun 119, 062
'rn,687 134,786 119.910
White s ............ do.
35,875
32,281
33, 192
28,643
Yolks ............. do.
28,870
25, i43..: :: 33, 850
29,6.3
Whole or mixed.... do.
48,821
33, 133 '. 60,432
56,010
.. ----------------------------.--- Uncl~..ssified.......
Total egg's21 (case eq.).
do .
5,496
Case ~'---3-,-6-4-3
3, 130 2, 579
7,312 3,966
5,,614 ,3, 501
------------------------------------------
Po'4try, frozen:
Broilers or fryers ... Poun
21,385
27,276
23,864:
25,622
Roasters........... do.
'7,676-
6,267
8,250
8, 154
Hens, fowls ......... T;~::'keys. . . . . . . . . . . .
do.
61, 505
75,538
do. : 195,604. 254,849
65, 556 133, 501
78,888 216,271
D'lCks .............. do.
U:;'1.c1as sifiei:l~ ~ ......
do.
I ~otal.po<ultry... '... ~ ~ . do.
12,007
9, 136
12,'191
II, 565
' 37,955
34,973
33, 724 , 37, 503
~.3_3-6-,-1-3-2--~"-.-4-0-8-,-0-8-9-----2-7-7--,0-8-6-----3-7--8-,0-0-3--
---------------------------------------_.-
I I Beef: Frozen, In Cur'e & cured......... do.
127,878
13'1. '~'17, 171,089
l64,6~4
Pork: Frozen............. do. In cure or cured..... do.
109, ,620 66,287
89, 141 45,220
121,039 42,408
142,084 42,282
Other meat and meat
products ...........
do. " 64,641
74,'854
73. 703
72, 190
Total all red meats ..... I
do.. ,
-----------------------------------------368,426 346,492 408,239 421, 160
!! Preliminary. 2/ Frozen eggs co~verted on basis of 39. 5 pounds to the case.
ARCHIE LANGLEY Agricultural Statistician In Charge
R. R. HANCOCK - W. A. WAGNER
Agricultural Statisticians
1... _ .
I'
f
'"
rda
HD 8-'1113
...
CGJE((~GnA (C~Q)IP' ~lF-0)~
MG SE~VllCClE
51
AGRICULTURAL EXTENSION SERVIC~
u./I, ~,,~if ( OF GEaR. fA
U S. DEPARTMENT OF AGFtlC4LTUR~
1 UNIVERSITY OF GEORGIA .ANO THE STATE DEPARTMENT OF AGRICULTURE
AIO'/2 1 '59 A ~ICULTURAL MARK~TING SERVICE
I~
8 EXTENSION BLDG., ATHENS. GA.
Athens, Georgia
oveinbe~ 19, 1959 ' '
LIBRARIES"
PULLET CHICKS l'""OR BROILER rIA TCHER Y SUPPLY FLOCKS
October 1959 - United States
J/rI
"
,
The indicated dOq1e stic placement of pullet chic~s for broiler hatchery
supply flocks by lead~ng primary breeders ~f broiler replacement stock totaled
1,994,OQO chicks during October 1959. Thi's was 19 percent less than domestic
pla<;~men~s of 2,473,000 'chicks in October 1958. Total placements (domestic, '
plus exp9rts) were reported at 2, 121,000 'as compa,red to ?' 585,000 a year
earlier.
'
The placement. data, include pullet chicks sold during the month, plus the number of pullet chicks expected fz:om egg~ sold during the preceding month. The conversion from eggs to expect~d'pullet chicks was made on the basis of
125 pullet chicks per case of hatching eggs sold. The primary breeders in-
cluded in this report account for a very large percentage of total supply of
replacement pullets for broiler hatchery supply flocks. Sales of replacement pullets by these breeders provide an indication of the potential number of
pullets available for addition 'to hatchery egg supply flocks several months,
before the pullets will actually move into the flocks.
Pullet Chicks 1/ Placements for Broiler Hatchery Supply Flocks
(Reported by leading breeders)
.'
"
Month
1957
Total 1'958
1959
1958
Domestic
1959 1959 as 0/0
of 1958
Thou. ..
Thou.
Thou.
January.......
1,886
1, 982
2, 124
February....... March........ ' April. .........
1,997 2, 538 3,033
2,281 3, 132 3,331
2,414 3,450 3,765
May . . . . . . . . . . . June ...........
2, 899 2,060
3,641 3,409
3,007 2,575
July........... August .........
1,676 1,410
3, 071 2,668
2,408 1,834
September .....
1,935
2,718
1,727
October ....... November ..... December .....
2, 297 1,926 2,238
2, 585 2, 153 2, lei
2, 121
~---------------------------." Annual Total ... 25,895 33, 136
Thou.
Thou. Percent
1,842 2, 162
2,997 3,234 3, 522 3,234 2,892 2,486 2, 546 2,473 2,048 2,004
1, 884
102
2,256 3,209
,
104 107
3, 573 2, 86 ~
",
110 81
2,392
74
2, 279
79
1, 706
69
1,480
58
1,994
81
''
..
------------~--------------
31,'440
.. '
1/ Includes expected pullet replacements from eggs sold during 'the preceding month at the rate of 125 pullet chicks per 30-dozen case of eggs.
ARCHIE LANGLEY Agricultural Statistician In Charge
W. A. WAGNER, Agricultural Statistician
.-
t.'.
:.<:: ~
',. '"
I' , ~ '~
,~ '~:.,
" ,:'.~ ~;;: :~"\~'~' ~:~..,
",
.. ,;, : ...:~,' ,,' "
:\
i . "':.'.' ~,:',~.~'. ','~.~ ,::~l.:.
t ':'1" ....
.,
:: ....::
'l!::: ,'. CHICKENS TESTED '.' ,. !. " . ~:':'.~'';;'. ":'. 1~;:" , : ~'''.
" f .
, t . ' . .., , .... I
.,' ,... ,.
.f,.
.
.'
,,'... .~\1' t. '::..' .'/ :t.:.' ;f.: .
, ...' .
."
':: .
GEORGIA: InGeprgia 370, 1.,6 chickens for supplying broiler hatching eggs were
tested for pullorum disease during October 1959--19 percent less
than the 458, 44Z. te.sted i'n,Ootober 19.58.. :' .T.estings of .egg:-type chic~ns for
October were 65,138--59 pe1'.cent more thall th,e 41,043 tested in October last
year.
,
' , .. I
:..'
' .
~.' ,,' I I '
,
','
UNITED:STATES:. Inthe States for'1!Vhfch compari80~s .are available 2,.881,615
.chiGkens..for supplying. broiler hatc;:hing eggs were tested
during O.ctob.er-~down 8. p~rcent 'from Oetober 1958. Testings July through,
October of this.year totaled 8.108, 615--down 3 percent from the testings qur,ing
this .period in 1958. The number 'of chickens for other purposes (egg-type)' .".
tested in October totaled 1,909, 435--down 18 percent from October 1958. The
number tested July through 'October 1959 totaled 3,927,453- -down 16 perce~t
from the number tested duri:ng this pe.riod in .1958.
. '.. :.:".
". ::i.j
" , . ,..,j~
,~ .1 . .'.:.\:: ",~,:l ',:,:
This 'report is made .possible. :thr.ough. the cooperation;'Qf .~h..~ N~U~I)aJ.'.:-.,;):~:
Poultry Improvement Plan official State agencie 8, the; Animal.l:Ju~bit-l\~ry '. .;
Research.Division, Agricultural Re.8-ea~(:hService, and the Agricult~r~l Esti~: .
mates DiVision, Agricu1tur.a~ M'ar;1(e'ting Se:rvice.
.; .
'1,. :'
) ", I
~.
: :'
"
. . .' ,~'j , ' i , Georgia - Chickens Tested by 'Official State_Ag~n~!es_ , - - --- -----
J,
'
: '"
t
: , ,."
For Broiler .Produc'tion .
: Egg Type Chicken.
Mon-th
. By ""
:
.M~nths" -_. ':" 'C~n:"uiative"
:
By Montha
. ... 1.9$8-59:
,
'.~
195.9.-6.0 '" :
195' .8-59
July" .' ; lo53, 865 245, 365 Aug.. -.~ 240,'302: 357, 77.1.
Sept." ': 413. t64' . 512,325
Z53~ 865 494, .1-67 907,431
'.;''
,.
1959-60 '
:
"
1.958-59
."
Z45,365 30,Z99
.. . 603, 137 42, 581
L 115,462 '35,652
.: 1959-60
'.
40,259 19,898"'
15, 187
Oct. . ". : 458, i42 370, i46 L 365, 8J3 1,485,.608
41.043
65, 138
Nov. ,':: 388, 136 .
Dec. ..,,: 432 .318 .'
Jan. ',':: 564,49.1 ',.
Feb. '. : 482, ZIZ ..
Mar. : 400,43,7"
Apr. : 275,275
May : 242, .067 ..
June
: 253,O~3
1, 7-54, 009 2, 186, 327
2, 1So" 818
3,233,030
3,633,467
3.90'8,742 4, ISO, 809
4,403.822
26. 186
: 84,778 .
34, 194
:
..,
,
,~
.' .
5,280
4,994 6,779
: 5, 561
.- 12~, 032
:: :'
.' 0- -;. ' .1' ..
. . ': "' . -
. ,. ..~',"
.... .~' ' ,
, :" ..f:J.~
' , , ' ~ ' ..I , ...
."------__~ ~ '
t' ,
': :
, ~ t,.., ;
. ....
. " " i i:. . . . . .
,
"
. ..' ...~
United States - Chickens Tested by Official State. As.endes
.,.. , .
... "" ...: ~.. . For Broiler Production..
, : .. For Egg!".Typ.e Chickens .. _, .__.....
y. , Month"';':
by Months!!.
.;.
by Months
~
f: \..
. . ..
. __ ~_.
.. "'~ --.1 . .---Li.L,',
.
; .. 1958-59
; 1959-6,0
;
: - --- ---
--
:-
:
'. t.,l ,"
. : ':'.
1958-59:; i95?-60 : . '"
... '~,) '1..' . ' .., .
July Aug. Sept. Oct. Nov. Dec. Jan. Feb. Mar. Apr. May June
1, 628, 129
I, 596,792 2.643,740 3. 119,754 2,951,368 2,794,813 2,601.927 2, 363, 505 2,320,302 1.928,397 I, 647,255 1, 609.452
1,537.073 1.913,921 2,376,006 2,881.615
500, 558
599,6tl7 1,243,658 2,318,229 2,349,994 2,487.248 1,648.909
756,864 421, 587 267,870 241,636 323,650
":
443, 579 585,756 988,683 1.909.435
11 All States except Mont., N. Mex., Ariz., Nev. 21 All States except Ohio, Del.. Okla., Mont., N. Mex., Ariz., Nev.
.3J-S
i " "' .. I'~
GEORGIA CROP REPORTING SERVICE
I~' .
;,,".:'.;----.. .i/ .. .. ,. . '. -'\Y:" '.'. t: \{' '. I ''''
:;, , ' J
~ t
...... ,-
.~
..... \, \ : \ ,"
'..
....
~ ..
J'~
"
\.'':'':~ r.: ~'. ,.' :. <:;' ,:
i I,:..,.,4';:':; D;;.;.;L:','.: t( ~..:' ': .:: ' :.,:
"J
fl
,
I.,\. ..:'::.j , ',:. :/ . . J J\: i'-,r:;r, "' . ,lJ .' ,', r,. \r ',1
' r '.r n J . ~-..;,
I ~' ,. .:~:
t. c J.,
, -.;.:':.-~",l,.
~:,)",.,..~;fA: ,
~I ~'!'..'l~.
~~, , .... ,.:~:j
" _ '\.', ,. ,
'\.\''-:'"''~\''''
" .
.
.~ {,"I
~
.~.~
'.,
-r~;',-,;,:
. ',-~ .;.-;--I:.
I ' : ' ,.. , ' \
":.' "
-I' .. ,.:;'~' ,l~ UNIVERSITY OF GEORGIA ,~"
, /'
..
~~,"
..
:
::"
DEC 1 '59 .J' .:
'--J
~
'..
..
~.;
r :.
Ji,
.,
.:,''~ ~~.Ij~.....-A.''~;.
" ~....
/
!
.
t ..J . TI'-.y. ot:... - -\)'"I . '" \
~'"tt_.._.... ....
.. .
, _ . , Re'le'as". e'd.' '1'1. /''~''5'/&~, 07 . '\
:'-'
LIBRARIES'
:
" .,/'
."
;~ Eggs set by Georgia hatcheries amounted to 7,692,000 compared with
.7~ 50 1,~000 the previous week and is Z percent more than the 7, 524,0.00 for the
.cprre8pondi"ni~eekla~tYea.r. : .
.
\
...
. ":, .
: , ... '.
' '. " .
.":.'
. ,.
'''. .. I
.
the majority of the prices pald for Georgia produ.ced hatching eggs were:
If"~ported within a range of 55 to 70 cents with an average of 59 cent. for all !
wa. ~\ tching eggs and 51 cents for eggs purchased at the farm from ~ocICs with iJ
.oatche.ry oWned cocKerels: ' Last week the range'
from 50 to 10' c'e-nt.' ~tlf"'~
~h ~ye;r~ge 9f 58 cents for all hatching eggs and ,57 cent~ for eggs purchas,ed r
,:pt tl(e utm fro~ flocks with hatchery owned cockerels. Most prices charged .
:l~r ch~cks were ;reported wittlin. a range of $9.00 to $1'0. Z5.with an average of ;
.$9. 5~ :per hundred compared 'With a' range 01 $9.00 to $10.25 with an average of
*cl $'9. S~ 'per hundred last week. The average prices last year were 67 cents for :
(
.
..
i
.elgs $11.00 for chicks.
: :: . "
.
..~:; ",:. ~ ..~.~.
..
' . " " .',
.~ ." <:,.: ',17,;: . ~
, i :.~ ;: . ;
':',:
Weighted average price: fi'om'tije ~-ed~!r.al-StateIMar'ket 'Ne'f8 Serv.:i.ce .for i
\~:roilets duri~g ~he week ending November ~~1 was Georgia ~roile'r8 2 3/4 -
..~: 3/4 pound. at 'arms 13. 69~.
".
~
, ., '.
: .-',
;~ ~
i~'
...~
\ .1
.
..
:
.
"~'; ;. GEORGlA.EGGS'SET. HATC:HXNGS~ A-NO CH"lo(~PLACtMEN'tS
",. f
,
.'J
.., !
'Week : ':.
Ending '.
.. (
,
..' .
~"
:
..
BROiLER'TYPE" .
'.
!/ .' ,'..._ : .~, .; Eggs Set
I
:'. '.
~.
. . '.
Chi.cke ,Placed for .. Broil.era in' Georgj~
. EGG TYP.E i
.
I
E~i8 Chicks .' : Set Hatched
; 1:958
;
,
1959 1959 '0/0 1958
of 1958
1959
1959 % 1959
~
1959
of 1958 ..
.
~:. .... 'Thou. , Thou.
,...,l
).
S~pt.19
, .' .. , ,7, 319 6,392
. Pe. rc. ent Thou .
87 4,873
T
h
ou
-,
...,........P
e
r
c
e
."
n
t
:
,
T
ho
'.
u
.
...
Thou.
:
4,537
93 . 201 123 :
,$~pt.Z6 " rr,14'1 6,300
88 :4,852 4,4$2 .. 92..
~17
91 ;
qct. 3 ~:. . ' ;7, 11~0 6,. $38
92 5, 152: 4, 383 ' . 85.: 190 14Z
qct. 10 ' . ~,Z48
Oct. 17 1.. 23:4
' 97 ~,,89~. ; . . 95
7,000
S, 111. . 4,':S 1O . ~\ 8~' : 2<63
5,'077, 4, 50'0 . ',. 89~"
1'50
154 ~ 163 :
Oct. 24 7.239 7, 138
99 5,034 4,802
95
155 143
Oct. 31
7,394 7,Z67
98 5, lZ 1 5,080
9'
llOY Z10
Nov. 7 7.549 7,455
99 5.095 5,051
99
140 113
Nov. 14 7, 595 7, 501
99 5.016 5,054 101
1Z4 116
Nov.Zl
7,5Z4 7,692
10Z 5, 196 5. 173
100
90
82
1/ Includes eggs set by hatcheries producing chicks for hatchery supply flocke.
'/ Revised.
ARCHIE UNGLE Y Agricu.ltural Statistician In Charge
w. A. WAGNER
Agricultural Statistician
------------_._._--_.------------._._------.----------------------------
u. S. Department of Agriculture
Agricultural Extension Service
Agricultural Marketing Service
State Department of Agriculture
319 Extension Building, Athens, Georgia
.. ----_.- -----------------------------~------._-------------------------
ECGS
SET
AND
CHICKS
PLACED
IN
COMMERCIAL
-
AREAS.-
BY WEEKS -
1959
.
W.eek Ending
Palle Z
,
. STATE
Nov. 7
Nov. - . 14
Nov. 21
Oct. 17
Oct. 24
Oct. 31
Nov. 7
Nov. 14
Nov. 21
.'
Maine
EGGS SET - THOUSANDS
I, 183
. I, 186
I, 206 ~
. ~HlqKS PLACED - THOPSANDS
..
..
,
'724
949
931
960
975
934
Connecrticut -
767 ~.
785
794 :
445
493
452
309
435
462
Pennsylvania Indiana Dlinois
1,036 1,469
184
1,085
1,255
1,493
1, 531
221 < . 213
483
440
62)
710
702
741
524 .. 633
579
617 , 628
583
106
95
68
51
. 99
92
Missouri
1, 518 . 1,493
1.460
574
511
53~
500
557
'629
Delaware
1,633 , '. 1, 660
1,703
_ 1, 189 1,428 . I, 563 1,484 1, 506 1,664
If
.Maryl~nd
3,056
3,282
3,265
-1.833 1.765 1.869 2,069 2,092 1, -838
Virginia
1,716
1,774
1,922
658
443
641
860
840 1,017
West Virginia
241
242
279
344 . 235
405
467
489
402
Nor.th.:Cu-olina
2,858
3, 151
3,265
1,841 2,045 2, 106 2, 103 2,-190 2,284
Sotith Carolina
489
383
495
295. 293
3~ . ,300
'344
317
GEORGIA
'-Fl-orida Alabama
7,455
' 286 3, 150
7. SOl
247 -3,245
7,692 303 ..
3, 189 .'
4.500
155 2,306
4,802 . 5,080,
. 148
151
2,200 ' 2,667
5,-051
151 ?,588
5,054
-150 2,591
5, 173 --
148 ~,674 .
Mississippi
2,591
2,652
2,636 ,
1,61:4 1,771 1.801 1,-706 .. I, 793 1,792
.Arkansas Louisiana
3,395 . 3,- 593
461
'503
3. 556 474
. 2,656 432.
,
2,451 32.5
2,72332.3
2.690' , 2, 815
2.79
2.79
2,813 . 302.
Texas Washingt.on
2, Z29 319
2.390 343
2,451 417
1, 560 2.05
1, 542. 2. 52.
. 1, 336' 1,490 "
2.10
2.90
1, '508 '2-82
1,607 282
Or'egon
,2.27
315
2.68
172
91
134
170
157
14Q
'California
1,594
1, 555
1,413
859
831
991 1, 131 1, 172. 1,097
.
-:IOTAL 1959
37,857 '; ~9,099
" ,. . .
39,787
2~,475 2.3,743 '~5,494 2.5,976 26,658 26,991
-
'TOTAL 1958 ."
.-.; .1959 % of 1958
.40,010
. 95
. 40,611
'"
'"
96
. .. 41,340
'
96 .:
I
26, 158 90
26,076 27, 170
..~ .~I
.91
94
27,429
. 95
27,651
- 96
28,426 -- :95
...
':p9tJ~?-. ........ <~
.3 1~I.
' : ;, "":.._ I
J.[...:. . .. 'l sct
"~" I ......
't\
,.,..' '.
~''';-''''-I........
,f
r !,
I. ..' "\.', '. ,'' ; . C..,
I -<.
I .(,~,-. 'I'"r!'~:~'I ~"',
'<~~.-.'t'".,'\.'~\"d
:' .' \.. .')....- .
. j ,.,,> \': ~ ~, "",1
'.
i'.~}
\ \,
'
\' ~ '/i~
t".. \~t..__
',1" I '
~ (I',".','' ' ~~"~,'...'l;".~t..;...-,..*N..'"_.J~
..
,
GEORGIA CROP REPORTING SERVitE 3/S-
'-IV EEJ< Y," . . ":
. .' I~NIVERSITl'OF GEQ
~
OEC4 '
r-J ;-\-t CAfRY
Released: 1Z/Z/'59
GEORGIA CHICK HATCHERY REPORT
Atnens, Ga. Dec. Z -- A total of 5, 40Z, 000 broiler chicks were p1a~~d
with producers in Georgia dllring the week end~ng NO,vember Z8, accordingto the
Georgia Crop Repo~ting Service. This compaJl'es with th-e 5, 173,000 place.d the
previous week' and is Z percent more than 'the ~, 3Z0, 000 placed the :same w'eek
last, year.
';
.
.
Eggs set by Georgia hatcheries amounted to 7, 633, 000 cempared with
7,69Z, 000 the previous week and is 3 percent,l:ess than the 7, 83Z, 000 for the
corresponding weel~ l~st year.
Th~ majority of the prices paid for Georgia produced hatching eggs were
reported within a range of 5.5 to 70 cents with an average of 60 cents for all hatching ,eggs and 58 cents for eggs pu'rchased at the 'farm from flocks' with
hatchery' owned cockerels. Last week the range was from 55 to 70 cents with an average o~ 59 cents for all hatching eggs and 57 cents for egg~ purchased at the farm -from flocks: vritt~ qatchery ..owned coc~erels. Mos~ prices charged
for chicks were reported within a range of $9. 00 to $10. Z5 with an average of ' $9:75 pe~ hundred compared with a range of.$9. 00 to $10. Z5 with an aver~ge of $9.50 per hundred last week. The ~verage prices last year were 67 cents for egs sand $1l'. 00 fot c~i,ck~.
Weighted average price from the ~""'ederal-State Market News -Service for
broUers 'during the week ending November, Z8 was Georgia broilers: Z 3/4 -: 4
pounds at farms 14" 50~..
,
I
.. -., "
... : 'f"
. ' , r'" ~,..
.'
;GEORGIA EGGS SET, HATCHtNOS, AND CHICK PLACEMENTS
Week Ending
' ..
:
Sept.Z6 Oct. 3 Oct: 10 Oct. 17 Oct. Z4 Oct. 31 Nov. 7' Nov. 14 Nov. 21 Nov.Z8
BROILER T Y:pE
Eggs Set !.!
"
Chicks Placed for Broilers in Georgia
.1958. 1959 Thou. , Thou.
1959 % . 1958
of 1958 ,,
Percent Thou.
' 1959'
,-
1959 0/0
of. 1958
: Tlioti. . Percent
. 7,141,6,300
'7,'110 . 6,538 7,Z48 6,,896 7,Z34 7,000
7,Z39 7, 138 7,394 7,Z67 7,549 7,455 7,595 7, 501 7, 5Z4 7,69Z 7,83Z 7,633
88 4,85Z 4, '452 ' 9Z
9Z
5, 15Z
4 "
383" .."
85
95 5, 117 4, '510
88
97 5,077 4, 500
89
99 5,034 4,80Z
95
98 5, lZ 1 5,080
99
99 5,095 5,051
99
99 5,016 5,054
101
10Z 5, 196 5, 173
100
97 5,3Z0 5,40Z
10Z
EGG TYPE
Eggs Chicks Set Hatched
1959 19.59
:
Thou. Thou.
Z17
91
190 14Z
263' 154
150 163
155 143
110 Z10
140 113
1Z4 116
90
8Z
1Z9 108
1/ Includes eggs set by hatcheries producing chicks for hatchery supply flocks.
ARCHIE LANGLEY Agricultural Statistician In Charge
W. A. WAGNER Agricultural Statistician
u. S. Department of Agriculture
Agricultural Extension Service
Agricultural Marketing Service
State Department of Agriculture
319 Extension Building, Athens, Georgia
",
" . ' . ~ ....,
. ,,~:
~_":.
:
6_,.,.
:._
_ _ ' .
EGGS SET AND CHICKS';PLACED IN COMMERCIAL' AREAS,' BY WEEKS'- 1959' Page Z
'7
.,.
STATE
'. '
..
;
-
Nov. " . 14
"
No~. Z,} .
,, .
Nov. . ! ..
28 ~
,I
EGGS SET :- -:-T~qUSANDS
:
:
-. ,W. e'ek E_n<.i.iD..g,::
Oct: .' "Z4
.,Oct. .: 31 ..
"
,.?. N,~ o7v. .
;': "Nov~ 14
Nov. ' 21
C~CKS. PLACE;D - THOUSANDS
Nov. 28 ... ,
,c
Maine
Connecticut
Pennsylvania
Indiana
illinois
)dissouri
::Delaware
. ..Maryland
,,;,;-::tt .' Virginia
~.-
hV~~~t:a I-
South Carolina'
GEORGIA
I, 186 785
1,085 1,493
221 '.
1,493 , 1,660 ..
3.282 1,774
3: 242 151 383 7. 501
~ ,
1. Z~6 ' 794 .
1, 25.,5.: .
I, .53} :. 21-3
1,469 I, 703 . 3. ~65 . 1,922
279 .
~, 26~
495 7,692
I, 197' ; 846 ~
.- 1..'118.- ,
1,)lt)"O. ,
-':21.0 !
1,:526 i 1,'121 ,:I
, 3,20,8 j ..
1,840 .
276 3,'.201
487 7,633 !
949 , 931
493
452
440
623
: (i33
579
:"'; "95
68
" :.: '511
539
:-'.I~ 4~8 1,':563 . ~~ 1,65 . 1,869
,: 4'43' :'. '. ,641
~ Z3~ .~: ~05
Z, 045 ' '2,:.106 293 "'~ .302
.., 80~ ~ '..5,;080
<160'-, 975 '. 309 .~:..: 435
710 .... 702
617
628
51
99
500 : 557
, 1.484," 1, 506
2, 069 .': 2, '092 : ~. 860 : 0;'840
467 2, 103
"
;'Z,
489 1'1
300 : 344'
5,051 ! 5,054
934'.. 931
462: 4Z:o 741 ' 'lli1
583
52~
92: -". . 9-Z
. ':6Z9:" 648
1,'664, I, '7~: . '.
1"83.8 1,90,8
1,017, . 97~
.402
.1'4
2,284 2,173
'317
'.324-
5, 173 5,402
Florida .Alabama Mississippi . Arkansas Louisiana
Texas Washington .Oregon California
247 3,245 2,652 3,593
503
2,390 343 315
1,555 ,.
' ,303 3. 189 .:
2,636' 3, 556 .
474: 2,451 . " '417 . 268
1,413
330
I I
3,2~3 ~
2".702 !
3;'.544 I
'~78 1
2,426 ;
315 '319
,
1,476 ! ..
1.48 ,: ';lSI
.: 2,200 '. 2,667
.; 1.771 '1,'SOl .-: ~, 45i 2,'::723
:' ~ 325 .. 323
I, 542 I, ~36
252
210
91 " '134
$31 . '991
151 , 150 -.2:, 588 : '2, 591 :: 1~' 706 : ), 7~3.
.... 2, 690 " '2,815 ~::279 ,'. 279
1; 490 ,.: I, 508
.. . 290 . . 28Z'
170
157
1;. 131 .I, 172
, , 148,'.. 1ZO 2. i~74: 2, 587
I, 791" 1. 9()J '
2,813 2,962
302 ' Z92
J.607' 1,646
: ' Ze,2
l5.?' ,
140
130
1,097 1,09-6
-- . :.: ... ,
".~:
. v-
-
~#
- . ~.
'
_. -;:"',J
.~.
'.'
'TOTAL 1959
'I '39,099 39,787 39,516
...
2
.
3
"-,'7
43
'." 25,~494
:
25, 976 :26~'658 26,990: 27,'267
I :~OTAL 1955 i
}O,611 41.34P 41,973
267 076 '21,-170 l7.429 27,651 Z8,426 Z8,Sr.7
'0 --1959 of 1958 I
96
96 .:,
94
91
" 94
95 ; 96
95
'95
.;
, .''"
"
Gm:o)~GnA <C~Q)ur;;;,/~~.!Cd( ~L
AGRICULTURAL EXTENS'ON SERViCe: ' UNIVERSITY 01' 'GEORGIA AND THE STATE DiPARTMENT OP AGRICULTURE
Athens, Georgia
U. S. DEPARTMENT OF AGRICULTURE AGRICULTURAL MARKETING SERVICE I I ' EXTE. .,ON BLDG ATHENS. GA.
December 1, 1959
~ER15, 1959
GEORGIA: ' TOe All Commodity Index of Prices Received 'by Georgia farmers declined , nine points to '227 ,percent of its 1910-1914 average during the month' . '
ended IQovember 15, 1959. The November 1959 Index MaS 34 points (approximately 13 'percent) below'the November 1958 Index of 261 and Was at the lowest leve1'for
, any. month since June, 1946 when the Index was 222.
A three' and one-half cent drop in the average price of cotton was a main contributor to the decline in the Index from the previous month. Cottonseed was also down sharply with farmers receiving $8.00 per ton less in November than one month earlier. Other commodities contributing to the decline were peanuts, sweetpotatoes, beef cattle and all chickens. small price increases were recorded' for corn, hogs, eggs: and turlteys which help to modify the decline of the ~dex.
pUITED STATES: During the month ended November 15 the Index of Prices Received by
,
Farmers dropped 2 percent (5 points) to 230 percent ot its ,
1910-'14 average, the Crop Reporting Board annoWlced today. Primarily responsible
for the decline were lower prices for meat animals, cotton, and oranges. The most
important increases were reported for millt. potatoes;' wheat, turkeys, and soybeans.
~e mid-November Index was 1 percent below a year earlier and the lowest since .
March 1951. :
. ~'
.
.
Higher prices of fami~ living items pushed the Index of Prices P81d by Farmers for 'Commodities and Services including Interest, Taxes, and Farm Wage
Rates. up one-third of one percent to 297 , its late-summer level. This was eo new
November high.
.
Summary Table for Georgia and. the United States
Index- . : - Nov. -15- ':'- 15 -Oc~;--15'-'-:-Nov"
1910-14 = 100: 1958 :
1959
:
195
!TED STATES
: -Recorcf high
Iridex : Date
Prices Received
235
230
1
I
bEORGIA
:
Prices Received :
All Commodities:
261:
236
:
..
227
All crops'
:
277 - '--: - --257--" :
243
L1vestock ana. :
:
:
::
I Products
:
226 : . 194.:
193
: ~5 : Sept. 1948
11 Prices Paid, Interest, Taxes, and Wage Rates based on data for the indicated
y JJ dates.
Also May 1959.
Also April 1951.
ARCHm LANGLEY Agricultural Statistician In Charge
RAYMOND R. HANCOCK Agricultural Statistician
. PRICES R.ECEIVED B.Y., J'AURI, N. OV. E.MB- Ji;R.15, .19'59 W'ITH.. COOARISCN$ .
,
..
~.,
-
'.
,
GEORGIA
' LNmD STATES
CQ.t,.{ODITY " ANDlNIT
Average Nov. 15 Oot. 15 NOT. 15 Average Nov. 15
1910-14 1958 1959 1959
1910-14 1958
Wheat, bu.
$ 1.23 ,1.93 1.80' 1.80
.884 1.74
Oats, bu. Corn, bu.
$ .67
.93
.83
087 "
.399
.569
.'
$ .91 1.17 1.07 1.09,
.642
.942
Barley, bu.
$
,
Sorghum Grain, owt. $
1.20 2.10
1.10 1.95
1.15
, ~ - 1.90
.619 , .891 1.63
Cotton, lb.
~ 12.1 ,34;.5
Cottonseed, ton Soybeans, bu. .
\
Peanuts, lb. Sweetpotatoes, owt.
$. 23.65 .' 50.00
$
-! ;':., 2.00
~ 5.2..i.
$ .84
10.5 4.75
Lespedeza Seed,All.owt$
Hay, b~ed, per to~' . All ." '. , $
Alfalfa ",
$
Le,Jpedeza '
$
Soybean & Cowp~a '$ ,
Peanut .'
...... ' $
.. 12.20
, . 27 ,20
,.
, 35.00 '28 .00
.'
29.:;50 '
22.00
32.5 '35.00 .' 1.95
8.9 4.20
. .-
25.80 34.bo 27.00 29.50 23.00
29.0'"' " I
27~OO
' 1.90 8.6,. 4.10 12.40
12.4
22.55
-
4.8
1.60
.-
32.38 43.50 1.89 lC.7 3.35
"
. 6.83
25.70 3.6.00 27.00 29.50 22.00
-
" '----.
lS.20 18.50 21.00 27.40 19.50
Wool, lb. Milk Cows. head Hogs, owt.
~
39.0
$ 33.~5 . 160.00
$ 7.36 lS.90
44.0 44.0 ',"
170.00 : 1165.00 12.40 12080
18.3
-
7.27
35.2 222.00 17.90
Beet Cattle, owt. Calves. owt. Milk,Whole sale.owt.s
F.Luld Mkt. Manut. All
$ 3.96
$
.
$/... _ ..
$ Sl 2.4~
18.60 23.00
6.16. ., 3.72 ' !I5.10
p.20 16040
..
22.S0 20.90
.. ... ...
- 6.15
!I,36..7100" 2/ 5.95
5.42
. ','
6.75
--., ,
1.50
22.30 26.20
5.02 3.34 4.49
Turkey., lb.
Chriacmken' s, pe'~,'' lb.
Com'l' Broil." All Eggs, doz.
~
. . ,.;.....
.,~ , ' ~
~ 13.3 ~ 21.4
23.0
',
15.0 15.0, . 15.0 50.4
. 23.0., ' .. 25.0
14.4
11.5' , 14.2.:, 14.1
12.5 ... ' , .
- 14.0' - 13.9
11.4
I
41.3 43.1
21.5
23.0
12.0 15.8 14.9 3S.9
Oct. 15 Nov.15 1959 1959 1.76 1.79
.650 .669 .990 .982 .8156 .879 1.48 1.51 32.51 30084 39.10 38.80 1.93 2.00 8.93 9.87 2.54 2.61 6.86 8.30
20.50 21.30 21.50 26.60 19.30
21.00 22.00 21.90 26.50 19.20
41.S 40.9
233.00 223.00
12.60 12.20
21.30 20.00
25.40 23.90
5.06 3.38 4.54
--4.60
22.5 24.9
9.3 9.6 15.(' 15.0 13.5 13.8 31.6 31.3
!J Revised .... y .. Preliminary Estate. ,\
':nTH ,
0
PRICES PAID 13Y fARMERS .roR SElECTED lEEDS NOVEMBB:R 15, 1959
CCNPARIOCNS
.
ItlND or JEED
Mixed Dairy reed
All Under 29% Protein
16% Protein 18% Protein 20% Protein 24% Protein
H~h Protein Feeds
t,;o'ttonseed Meal ~ 4~~ J
Soybean Meal
44%
Nov. 15 '. -19'58
.. 0
.,
3.95 3.85 4.20 4.00 4.30
3.75 3.95
GEORGIA
4 I'
.,
tlUTED STATES
Oot. 15 Nov. 15
1959
1959
Nov. 15 1958
Oct. 15 1959
3.85 3.75 4.00 4.00 4.25 3.55 4.00
Dollars Per 100 Pounds
.3oB5
3.75 4.05 4.00 4.30
-'
3.63 3.57 3.55 3.83 3.93
3.75 4.05
3.S4 4.11
3.63 3.58 3.54 3.83 3.89
3.90 4.12
Nov. 15 1959
3.68 3.62 3.57 3.90 3.96 4.05 4.19
Grain By-Products Bran Middlings Corn Meal Poultry reed BroUer Growing Mash Laying Ma.h Scratoh Grains lMa"U :le'd} lll"9ther'
--
3.15 3.35 3.20 4.95 4.70 4.15 40.00 31.0Q
3.25 3.55 3.20 4.60 4.70 4.10 42.S0 31,.00
3.25 3.50 3.15 4.65 4.65 4.05
43.00 31.60
....
2.76 2.87 3.16 " 4.eS 4.38 3.87 29.00 27-.20
2.76 2.93 3.11 4.69 4.36 3.85 30.60 27.40
2.82 2.95 3.07 4.72 4.34 3.94 31.10 27.90
3/~
CGIE(Q)~<GHA,C~OU,'> ,~L-'W'.A~,UM.G SElR{VHC]E
AGRICULTURAL 'EXftN$loN "RVIC.
U.NIVC~S.IT,Y OF GEORG'IAU. t. OEPARTMENT OF AGRICULTURE
UNIVERSITY W GEoRGIA ANO THE . STATE OEPARTMENT OF, AGRICULTURE
OEC 1 1'59
AGJltICULTURA,L IMRICETtNG SERVICE 31. EXTE. .ION BLOG., AT HE", GA.
.) ,Athens, Georgia
December 8,1959
I tBR.~ '''''c::
GEORGIA CCYl'TON !REPOR'.P-- AS-OF-DECEMBER 1
durtni' . Cotton production in Georgia
'1959 is estimated at 525,000 bales
(500 pounds gross weight) or 49 percent ~bove the, 352,000 bales' harvested in 1958
but 20 percent below the 10-year (1948-57) a.verage ot 655;000 bale8!, The indica-
ted lint yield per acre of 383 pounds is th~ second highest of recot,d, being ex-
ceeded only by the record yield of 443 pounds obtained in 1958. The harvested
acreage of 658,000 acres i8 73 percent above the 381,000 hnrvested last year but
....
it is still 42 percent below the lO-year a.verage of 1,144,000 ac:ces. The largest ac.reage harvested in the State since 1866 when estimates were started ~s
(1 5}157;, 000 a.cres in 1914. Acreage harvested last year is by far the lowest of
record for the period.
The sharp drop in the yield. per acre obtained this year canpared 'nth a year
ago was due to unfavorable weather tllat plagued the crop at various times during the groWing and harvesting seasons. ' Wet weathe-r in early spring months delayed planting and made it difficult to secure good stands. Unusually heavy rains the last halt of May drowned out the crop in low places in many fields and hampered cultivation. Some domge occurred iran dry weather early in JU~, and again about mid-August. Frequent rains the first halt of September and duripg the month of October delayed harvest and .reduced quality ~d yield per acre.'; "
, '.
, The Bureau of the Census reported 509,552 running bales. sinned to December 1
compared With 346;787 bales ginned to the .same :~te ~8tl';~,.r. ....,._... '.
. - ~. ~:, .,.
".
",I
0'
. '. ,
.... . ",
. CARL",O ...DOEsCHER ".'
. "AgricuJ.~:ural Stut1-stie1an
. . .
....; . '~: :.. .... .
I
, ,.
"
;~ ' o
" r- ' .' ,
_ ' AR.CIUE. LANG~
"
~ri~ul~ur~l ato.t18~ic:[an In -Charge
<. ~l .. '~
.~~ ." ."':'
~.:, ... :, : .
I"
~,.} ':.
-: ."
"
..
~ ,
, :':-::" GEORGIA MAP SHOWING nmICATED PRODUCTIO~ 1959 AND FINAL PRODUCTION FOR' 19'28&l!'7
.; :.
" ,.
.......
'. }
,"S' :
.~
...l:
195942, 1958 - 19, 4~ .
:1,. ;, 19.57.- 25, . '
.- .':, .
";
~.
I
I
',.
~1. I ~
\ 1,0' .: ~.
1':'
t'
- STATE'
........ ,
,
:~ :..
1959 - '25,000 ':-", '
1958 - 352', OO~ ., : ;' ..
~95.7 396:,000
\.
.,
" ......
, .h
JnBtr1c~~ shown .flI."e :er.6p
~eportiDg D1str1ct~~
NOT C0D3::r\'68s1Q11Ql Ms-.
..... _ " t, r1c~s J
.' ....
..:
.' r" \o.t
.'
'",
.-. .. .. \ -, -- I : t": ..
"
.. ,"
,
..
\ :"
VII
(
VIII
1959 - 64,000
1958 - 53,700 957 - 55,000
1959 - 97,000 1958 - 83,300
1957 - 90,000
'VALDOSTA
rx~~
:J 1959 - 20,000
1958 - 14,800 "c)
1957 - 12,000 }U
),i
PIEASE TURN PAGE FOR UNITED STATES INFORMATIOI~
;.
''2_0.
I.
1.S
B
.i
~ 1.0
f2 <f3
08 '.
~ .5
~
ACREAGE AND PRODUCTfON OF COTTON IN GEORGIA
1949-19S9 - Pre~ Estimate 19S9
.1,
'
.;
< .2.0
ACRES HARVESTED
~
1.5 ~
i
"
. /.l , ..
1.0
t2!
.~
/
. , _ - 0..,
~~,~
.f
-.".......... ..." ,.,_...
i
,..
, BALFS .PRODUCED'
_.y , / _ .~__..
.5
O!
.
+
Io
1949 50' Sl ..'. S2' S3 S4 ~5 .56 'S7 58 59
i
. Years
,
____ ':"
UL.2_~Q1!0! ~T-.A2 QF_D!C~E! 1,_12.$2 - - - - - - ~ r __
. Acreage harvested Lirtt yield p e r :
Production 11
State l ~w ~ - - - - - - - ;:t _: __ !:!.arv!S~2 !cz:e__ D20;:12.,..O!,s_W1._b!1!S_ :19qo-~7: 1958 : 19~9: 1948- : 19S8: 190$9: 19q8-57: 1958 : 19S9
____ lqet 8&el
:_ !8!_~S.7_ax._:
l _eat., l !.v!.ry!:
J_e!,tL,
= !qi
!'
Thousand
acres
;
f
i
Pounds
I!
Thousand bales
i
N.C 1i 623 263 390 i 324 466 400 I 419 256 32S
S.C i1 . 939 352 S6S 1 310 406 353 I 598 299 4lS
Ga"~n '1~144
Tenn....I] '17
A1a1f 1,345
381 65.8 j 284
400
S30,
S83039. !i
392 312
443
SOl
398
383 627
US
'!1 i
6SS
S72
84h
3S2
419
439
52S
66S
720
Miss....i! 2,116 1,12S 1,46O! 396 409 516: 1,710 961 1,570
!!
Mo n47~ .29S
!
398! 396
446 609 it
386
275
50s
Arkli 1,826 1,015 1,303: 386 436 573 [ 1,429 92S 1,55S
La Okla
iHl
764 982
-364 410
495! 396 62S! 184
Texas li 8,460 S,39S 6,415! 232
I 392 480 1
36S 296
624 367
297 313
49S 38S
383 337 i 3,956 4,308 4,500
l!
I .'
!
N.Mexn 234 176 198. i - . 582 820 793 1.. 27S 301 327
Ariz !l 436 Calif :1 .. 943
other .q
States"V 78
377 732
382 1 877:
831 748
931 1,OU9
942 1,051
!i'
740 1,424
734 1,604
750 1,920
34
I:
56 304
i' i
403 373
48
29
44
tr.~.-
Total
-jJ:T~
2-1-;0-76--
1-1-;8-49--
1-5-:1-64--i'--
-329-
---
-
-
-466-
---
-
-
4-6-5T! --1-4,0-4-6
--11-,5-1-2
--1-4,7-0-i
AEmgayrp-t !in!l 57.3 76.2. 6S.9:;f 435
I
525 S31!i . 4~. 7 '. 83.6 72.8
:l
.:
....
.y "1-:P-ro-du-c-tio-n-gi-nn-ed-a-nd-t-o ''be-g-in-ne-d.--A -50-0--1b-. -ba-le-c~on~ta~in-s -ab-ou-t -48-0 -ne-t ---~
unds of lint. Sums of acreage BnP production for "other States" rounded for
1usion in United States totals. Estimates'for these States are shown separa~
JI ~l, \lded in Stat~ and United States t o t a l s . ' .
.
\
-'.
:! ~:. ~ t ' ...
,~ .
,,: ~
'"
".~\ .
,
- - ....-:."':'----. ...::--.......... ;;-~
'C t - ... 7....
,_t
.~ ...... _....... ,. '--:"~~ ~'ta-_,._.
.. .~ '-....' ....
-... '~~~--"-z~9t/jrl\~w~",w'''.' """"'i~p
~Iii.' i F . r=- -"
."Q , r rr
'\ -;oJ" /'I.. 1 .'-~..-, ( '..
..-::::' i ~ f
~.
-d
''f'''.
~. _~H_- "~'",::, }I,,I,Nil!'
/'
,I , ' J ""..,~
""~.. ,,-', . . . . . . ,
~
,..'"r
I .. "'=" ~ :":..:',' ,,~, J
. 'f I I.
t .". t,
' . '">:....
4"
., ...
"'1. .. '
I '''t1'.'
.
'f.
,' ".
.',.,,. .
.
;I...,"..
,
. I' " ~ ~' ,
t:" :-. /\ )\r ,_.~--tj ..: ......
, '"
-
~. "',
I', .".... r
,", 1.
,,t':.'~' -~,
. _.1
~
GEORCiIA CROP REPORTING SERVICE
\I\/'I~~~~J1<, ~J\j
}-LA\-rC }-JE RY
Ui,l, 'r.\-Il 1 Of GEORGIA
1
DEC11 '59
Released: lZ/9/59
CiEORGIA CHICK HA TCHER Y REPORT
IBRARIES
Athens. Cia . Dec. 9 -- A total of 5.381.000 broiler chicks'were placed
with pr9ducers in Georgia during the week eqding December 5. according to the (\ieorgia Crop Reporting Service. This compiiLr~s with the 5. 40Z. 000 placed the
previous week and is slightly less than the 5. 388.000 placed the same week
iast year.
'
Eggs set by Cieorgia hatcheries amounted to 6, 396,000 compared with
1. 633. 000 the previous week and is 14 percent les9 than the 7, 4ZQ, 000 for the
corresponding week last year.
.,'
The majority of the prices paid for Georgia produced hatching eggs were
reported within a, range of 59 to 70 cents with an average of 6Z cents for all
Ilatching aggs and 60 cents for .eggs pur.cha..ed at the farm from flocks' with,
llatchery owned cockerels. Last week the range was from 55 to 70 cents 'Yith ~l) average of 60 cents for all hatching eggs'and 58 cents for eggs purchased at the farm from flocks with h~tchery owned cockerels. Most price~ charged for qhicks were reported within a range of $9.00 to $11. 00 with an average of $10. 00 ~er hundred' compared with a range of $9.00 to $10. Z5 With an a~erage of $9.75 Iter hundred 1ast week. The average prices las~ year were 67 ,cents for eggs a;nd $11. 00 fQr chick.
, Weighted average price from the Federal-State Marke't News Service for
~roilers during the week ending December 5 was Georgia broilers Z ,3/4, 3 31.
Rounds~ at farms 16.19~.
. i ~,-:
,
j
Week
~nding .,
I I
.
GEORGIA EGGS SET,' HATCffiNGS, AND CHICK PLACEMENTS
BROILER TYPE
,
,
Egga Set!!. :'
Chicks Placed for Broiler s 'in Georgia"
1958
1959
1959 0/0
of -1958
1958
195~
1959 0/0
of 1958
EGG TYPE
Eggs' Chicks Set Hatched
~959, 1959
Thou. Thou. Percent Thou'. Thou. , Percent Thou. Thou.
I
Oct.
3
Oct. 10
Oct. 17
Oct. Z4
Qct. 31
Nov. 7
lo{ov. 14
~ov.Zl
Nov.Z8
Dec. 5
7, 110
7.Z48 7.Z34 7,Z39 7. 394 7. 549 7. 595 7, 5Z4 7,83Z
7.4Z0
6,538
6.896 7,000 7, 138 7,Z67 7,455 7, 501
7.69Z 7,633 6,396
9Z
95 ,:. 97
99 98
99 99 10Z
97 86
5.15Z 5. 117 . 5,077
5.034 I 5. lZ 1 5,095 5,016 5, 196 5.3Z0 5,388
4,383 4,510 4, 500 4,80Z
5.080 5,051 5,054
5. 173 5,40Z S,381
85
.I 88
'' ,.
89
95
99
99
101
100
102
100
190 ..' 142
263 154-
ISO 163 155 ' 143
110 ZlO
1l4408Z-1
113 116
90
82
lZ9 108
79 111
11 Includes eggs set by hatcheries producing chicks for hatchery supply flocks. rl Revised.
ARCHIE LANCiLEY Agricultural Statistician In Cha'l'ge
W. A. WACiNER Agricultural Statistician
u--.-S-.-
. . . --------------------------------------._._--------------_.-------
Department of Agriculture
Agricultural Extension Service
Agricultural Marketing Service
State Department of Agriculture
----------.--------3.1-9--E-x-t-e-n-si-o.n_.B-u.-il.d-i-n-g-, ._A.t_he-n-s-,--G-e-o-r.g-i-a---------------_.-
STATE
EGGS SET AND CHICKS PLACED IN COMMERCIAL AREAS.
.,
I::;
,. . ,",';: Nov::' .
21 .... : . .~
.. ~ .... .'
' . ;
)..
~.
.... 6! ~. :!
~d;'''' ..
';: :':'Z8.o .-..
:# /'
~..
..
De~ .
, 5 '
"
'.
";'
_ '
:';
......
0,
. " .~W:eek,:Ehding
,. .--.,.
: Oct.
Nov.
31
7
BY WEEKS - 1959 p
Nov. 14
Nov. 21
Nov. 28
. EGGS SET - THOUSANDS
CHICKS PLACED - THOUSANDS
2
-
Dec. 5
Maine Connecticut Pennsylvania Indiana illinois Missouri Delaware )4aryland Virginia West Virginia North Garolina South Carolina GEORGIA
Florida ~
Alabama, Mississippi Arkansas LOuisiana Te:xa.s Washington
O~egon
California
1,206 . I, 197
794
846
1.255 1. 118
1,531 1,400
213 1.460 1. 703 '
210
1. 526 I, 721
3.265 1,922
279 3,265
3.208 1,840
276 3,201
495 7,692
487 7,633
303 3, 189 2,636
3. 556 474
330 3.263 2,;702 3~: 544
,478
2.451
417 268 1.413
'2>426 315,
319 1,476
......... ..
TO.'-TAL 1959, ' ,39,787
,-
TOTAL 1958
41,340
1959 % of 1958
*R~vised.
.r'
96
.. 3,9 ..-:st6'
. ; :
'. \
.;'
'. ~
4J,973'.-
,,
.:;' '" 94 " .- . ... "!'
_r
1,242 703
1.069 1,308 ,
165
1.421
1.514 3.066
1. 157 249
2,278
471 6,396
312 3,262
2,580 3. 147
.
382
1.825
275 2.84
~. 338
931.' 452 606*
5~9
68 539 I, 563 1.869 641 405 2. 106 , 302 5,080
151 2,667 1,801 2,723
323 1,459*
210 134
991
9'60
309 663* 617
51 500 1,484 2.069 860 467 2.103 300 5.051
I 151 2,588 1,706
2.690 279
1,490
290 170 I, 131
975 435 702
628
99 557 I, 506 2,092 . 840
489 2, 190
318* 5.054
150
2. 591 1,793
2. 815. 279
, I, 508
282 157 I, 172.
934 462 760* 583
92 629 1,664 1,838
1.017 402
2,284 317
5. 173
148 2,674
1,791 2.813
302 1,607
282 140 1,097
931 426 664
524
92 648 1.790 1,908
916 414 2,173 324 5,402
120 2,587
1.903 2.962
292 1,646
2.59 130 1.096
912 - 420
600
576 77 616
1.904 2.053
1.024 401
2.354 328
5.381 r
148
2.772 2,030
3. 192 358
I, 771
2.82 204 1~ ~42 .
"..
34..~4
.'
2...5.600* 25.929* 26.632* 27.009* 2.7.2.67
2.8.605
..
39;'.644
27. 170 2.7,42.9 2.7.651 28,42.6 28. 817 2.9,306
-.:. ~7 '
~ -~
"
"
94 . ..
'.
I
-.'.. .. ;J ....
94*
..
96
, 95.
..
95
.. ..
~ 98
' .'
..-... !
1 '..1:
" l
<
"
,..
....... _ _ __ . ~.!...!~ ~.l'~._~~~ ~.! _~.!.,.e..."=,,,_. _._~:,:"':.-._.",,,,,,=,,,.'=_~ ,,,"u._....-..:..,............,,.. ,..,._.....
....,
~
~_ _
3/~
.,
::~1
G E OR GIA CR O.P RE POR TING SER VI CE
:/I.:~;-;':',".-~.:Jr;..' \;\j F FJI< I
r----_ ~Y ... , <;'I;.'
, {,. . ~~
......J'
,l _ ,.
" ,,1
,"
II
~
..".::-, "t(' j" :. '/' UNiVERSITY OF GEORGIA
r J'.}-\:\-. :r. J I. '. r~"l fl. ,It
~.:~
.rc "'if . ,......t-.: I ,t'}.
'f \" '
I' DEC l1~..!59
I
...:.......J
t,.~~\,\',...Ii,!
j ..
i..\.. !.'
"'.
1 . ~ :"-:"~2-~, .
,
I
'
l:IBR~RIES
(~.,Ir J~'\"-,:~' \JI\
Released: 12/ 16/159 ~
. - _l....~" .., ....:~..
.-
,
't
..."
t
I.
.
.'
.~
(
GEORGIA v!u'J ......... __ . ~.,ER Y REPORT
.;
:~' :
,i
Athens, Ga., Dec. 16 -- A t'.. tal of 5, 506,000 broiler,'chicks were pla~:ed i
.\Y\ ;ith ..producers in Georgia during the week ending December 12, according to th~,
.Georgia Crop Reporting Service. This compares with th;e 5,381,000 placed-,the' '.
:pf..evious week and is 5 percent more than the '5, 255; 00,0 placed the same week .
~st year.
"; ~
, . . ...
;:
.1
.
.,
\ E;ggs set by Georgia hatcheries amounted to 1,865,000 compared with .';.,
'(),,:396, 000 the previous week :a.nd is 3 percent less than the 8, 146,000 for the
..c:,Qrres~onding week last year.
,~
.
.
.
'"~: The majorit)t' of the prices paid for Georgia p~oduced hatching eggs were It
r~epor,ted . within a .range of 6'0 ~o. 70 cents, with an .ay.~r.age :0 .64.. ~.~~~E! ...f9.z: .~ll_"""::"'_-i_'M'
hatchlng eggs and 62 cents for eggs purchased:at the farm from flocks wlth
i
h~~chery owned cockerels . . Last week the range was from 59 to 70 cents with
~n\ average of 62 cents for all hatching eggs .and 6~ ceJ)ts for eggs purchased at
~t!'e farm from flocks with 'hatchery owned cockerels. Most prices charg~4 for
~hicks were, r'eported within a range.-of $9.00 to $ 1-1 .,25 with an aver,age ,of. ~;l0:...25:
pE;t hundred:compared with a range of $9. 00 to $,11.00 with an average of $1.0.00 i
p~i; hundred last we~k. The average prices last yeaI: were 67 cents for eggs
artd $11. 00 for chicks. ,
,
~ . "
_
"
0"'
. "; ~ Weighted average price from the Fed~ral-State Mark~t News s'~~vice.'f~~ , .
~r:CSilers'during the week ending December 12 was Georgia broilers Z 3/4 ~.3 3/4
p. o."unds, at farms 17. 60.
", I
,.,;.
. (",
.. ,
\
.;
:
We:~k
~n~ing
:GEORGIA.EGGS SET, HATCHINGS, AND CHICK PLACEMENTS
,
. "':"'1
. B.. ROILER TYPE
! ! .,
I' : Eggs Set
Chicks Placed for Broilers in Georgia
'. E
EGG TY.PE
ggs .Chi~ks
.::;
Set Hatched
~
~~
.) ~
,
:
.. i
. 1958 1959
'Thou. :Thou.
1959 %' 1958 of 1958 Percent Thou.
1959 Thou.
.',
. 1959 %'. "1959 ' 19~
of 1958
-,
..:: t
Percent Thou. ~. Tho,., u.
Oct:.: 10
7,248 6,896
95 . 5, 117 4, 510
':-:88
26'3 - 154
Oct~~ 17
7.234 7,000
97 ' 5,077 4, 500
89
159 163 ..
Oct.; 24
7.239 7.138
99 5,0,34 ,: 4. 802
9~
155 143
Oct.. 31 Noy. 7 Nov., 14 Nov.;21 Nov.~28 Dec.,' 5 Dec,,12
7,394 7,549 7,595
7,5Z4
7,832 7.420 8,146
7,267 7,455
98
5, 121 51 O~O.
99 5,095 5, 05'1
. 99
99"
.
. 110 ~i40
..
210 113
'
7, 501
99 .. ~ 5; 016 5,054
101
148 11't>
7,69Z
102
5,r 19() '. 5~"173
100
:~.,
90
82
7,633 ' ' 91 ',. 5, 3'20 5~ 40'i " 'i02
129 108
6,396
86 5,388 5,381
100
79 In
. 7,865
97
.:
':'5 ,
r ,
255"
..... ."
..
,
5, 50~ ..: ~ 10'S
:..... ~........ h .! ."
244
77
- ..
1/ 'Includes eggs set by,h~t.ch~ries prod'ucirig chicks fO'r" hatchery supply flocks.
ARCHIE LANGLEY Agricultural Statistician In Charge
W. A. WAGNER Agri.cultura1 Statistician
u. S. Department of Agriculture
Agricultural Extension Service
Agricultural Marketing Service
State Department of Agriculture
319 Extension Building, Athens, Georgia
.
.
EGG~ SET ,AND CHICKS PU""CED IN~OMMERCIALAR - . . -
K5 - 1959
- ...... -~-
-.
'
.:
.. '. '.
: . ..
-
...,
.
. Week Ending
,"
,.
- c~ .
STATE
-
.....
Nov." 2,8:. I
0'
Dec. 5
....
, . . . . " or
Dec'; : lZ' . ,-"
N-ov.' 1
:
N~v.
N.ov.
Nov.
14 " ' Z I - 2,8
Dec. .,' 'D~c~
5 " 12.
-
..
Maine Connecticut Pennsylvania Indiana Ulinoi.
.
.
.
EGqS SET - THOUSANDS'
<: ~1. 1. 19'7 '. 1, 2.4Z '. . 359:,'
846 .
103
1, 118 1,069 .
1,4'00 ': ' 1,308,
i 10
165
827", 1, 42.'5~: :' I, 478~
zoi.
~
"
- CHICKS PLACED - THOUSANDS
,
.
..
!.-
. .%0
915
934
931
91~
r
891
309'
435
46Z '. 42,6
42,0
'318
6.63
102 - ..760 : 664': 600' 841
(,11
62.8
583' . 52.4 .' 516
62.8
...
51.' 99
'. 9Z
92.' 11
:,H>6'
Missouri Delaware Mar:yland V,irginia West Virginia:
1.5Z6 . 1,42,1. 1.146:'
1. ~~1 .' ~'. 514 .... 1.899. ~
3. ZOB. 3., 666
3. 587
l.MO '1,157 ". 1, '152,',.' ,
Z76 . __ Z49
2.83'
500 ,.1.484'
2-,069 860
, . 467
557 1. 506 Z,09Z
840 . 489
62.9
648 616
695
1,664 1. 790' : 1,904 1;141
1'-83'8 1.908 i 2.,053-" 2.,,2.34
1,017' ,976 : 1; 02.4 (:', 'i,'056 ..
4G2.
414
401 ~ 346
l. 1
<
North Carolina" SOQth Carolina CEORQIA ."
3,ZOl:.. i.Z78 3,64l .
48' : '.471 '. - 505'" 7,6)3..' ,-6~ 396' '7,865 .. :,
Z,.103. 300
5,051:
2.196 318
5, ()'54
2.2.84 311
5" 113
2.173 .2.,354 32.4' 32.8
5,40Z (5, 381,
2,,506 348
S,' 506
. Florida' Alabama Missis8ippi Arkansas Louiaian.
330"
. 312. . . 344!
3.2.63 ,'3.2.62, '.:. . 3, 51 ci.
Z, 70~ " i, 580:' 2.,954
3. S44 '. 3. 147 ., 3.76$.. .
478 " - 382.
5Z4'
151 150
i . .588' '2.,591
1,706 1.793'
~, 69.0 "2., &15
'279
1.19
148 2 ....6 1 4 1,791
12.0: . 148 2.~ 581 2..172. 1, 90~ .. 2.,030
Z.813 , :2.,96Z' 3; 192.
302,
2,9Z '. 358
.171
Z;111
1,,944
3~'140
Z90
Texas'
,
Washington
Oregon
California .'
TOT.I\L 19',59 TOTAL 1958 ..
:Z.4Z6
1.825
2,370'
.. 315 .- "'Z75' ' 334
319 '. .~. Z84
4Z1j "
" 1.476 . I~ 338 . 1,469...
.. . ... '-
{
. ..
44. 39.
41.
957136.,~
.
:'
34~444
39~'" 644
-
142,.4l6S9~",
1.490 2,9'0
.' 170" 1. 131 ~
1.508 Z82, 1'.51
1. 17Z
-
~Z2.5:.79:~4Z2.9. 9,.,
Z6,63i' Z7.651
1.,607:,
"z.~Z;
1"40'
1;097
1.646 2.59. 130
1,096
1.771 .1.72.5
2.82, .' 319
~ 2,04
': 111
1. 142.' ... 96~
. -.
2,7.009 '~7,Z67 Z8.60~. 2,8~12,5
Z8. 4~~: 2.8~-8:11' 2,'9;306: Z9. '967 .
'.
'
"
1959 ,. of 1'958
94
87
96
I 94
96
95
95
98
96
. .~
.- .
.'.
. ','
,.
.
"' ..'
1,.
""" r .,1";
..~ . "c,JJS
GJEO~GnA ~~'.'."i:~IE-!,elR{1rn~G.Sl&lFRV.RC.JE
DC'C 22 '59 '1.''. . ".~
:.UAGNRtyIECAULlITTUYR~AL
aXT.NSION SERViC. . GEORGIA AND THai )'..:
.
. ,,;....., .'
."
u. s. oaPARTMEW;:'OF' AG.-teU\;;TU"E AGRICUI,;,TURAL MARQrtNO.lJtVtea
#
. . :.iT.~: ..T: .E'.
DaPA
;'.
R
T
_
N.
T
~
OF
A
G ~'
I.U.e.w..
T
.
U
R
.
.'
.. .~,
..'
."
. . ,
l
.,.EX; TI. .'O.' N'...L..OG.,"
A'T. M-......
.
.
.GA .-'
.
. Athens, G~~rgia: . ' _.' _. '1". I!(~'''(" '7' -;.$" D.ecember. 11.,)1959:::,.. "'-':1
;ptp.. Y' :
'0
... ! I ; .
i.
. ':_...,"
"
. ., , . "
','
;.
~~.T. CHICKS. FOR ~R9~L~.R HATCHER.Y SUPPL ~~,LOC~. ;,(';'
.
~" .Novemb.er 1959 -.UnitedStates
., .
.. :. .,
,.. ."
.. ! . ; , d
, ,. .Ii.:
Tl'ie indicated domestic placement of. p'ull~t chicks for broiler h"tch.el1'.y
supply.flocks by leading primary breeders of broiler replacement stock totaled
1. 6:97. OOOchicks. dur.ing November 1959 .. T..his was 17'pe-rcent less than domesti,
. ,pla-ce-mentso!-Z, 04-8,'000- chicks in'November 1958. Total J>la:cements (dDriH!!fltic
plus expo~ts) were reported at 1, 84Z. 000 as compared to Z; 153,000 a year
.~ar~{~~;~ . . " .
. . . . . . '.:. 'I..'~"
,
1
4'
\. .:.::' Ij:,~r~e .plc~cel!1ent data: ~nclude pu~let,chicks sold during the m,p.,nth,: plus tl'ie"
nu'mber of pullet chioks expected from eggs sold during the preceding: month.
.. The' convarsion from eggs to expected pullet chicks 'was made on the' ba:fiis 'cif'
lZ.5. pullet chicks per cas~ of ha.tching eggs sold.. The primar,y:bt:eeders in~~.: r.
clucied .in this repoFt acco,unt for a very large percentage~of tot~l supply of. ~ -: "
r~pla~ement pullets for broiler hatchery supply flocks. Sales of .replacem~nt
p.W1,ets by thes~".breeders.provid~ an 'indication of the pote'ntial~umber of p.ul)..~ts avail~ble for addition to hatchety-eg'g supply flocks several mo*ths' before the/:
pul1.et~ wi.ll a~~ual.1.y move into the flocks.
.:
. ~ .. ;'.~.
.
.
...
: .... .
Pullet Chicks 11 Place.ments for Broiler Hatchery SlJPp1y Flocks '; .: ~
....
- (Reported by laadini breeders)
.:
.
'.,
Month ,
1957 .
Total ' .
1958
'1959
I
I.
D,,.".O...
rh
e
st
.
i
c
1958 ~ . 1959
. ' t '\j : " ;: t :~
1959:-:'10' of 1958
Thou. . T.hou ..
Thou. I Thou.
Thou. Percent
Jan~ary, ., '.... February '.' ... March.. ~ ..' .. ~ ~ .
I, '886 ... 'i~ 98Z.: . 2,1Z4
1,99.1. Z,~81 .~.4l4
~, 538
3,I3Z. 3,450
1. 84z'''.,' .. 1,,884.:< ....
z, 16Z .. ;2~ ~S6 ~
...lOZ 104
Z, 997, 1 ), Z~ Q9
1.(n,
l' pril,
. 3.033 .... 3. 33.1' . ~,:76-S
l..,Z34.- .:J,573.'
11o'~
May
'.' .... Z.899
3,641
3,007
3, 5ZZ. .Z, 861
81
June. ..~ .~ ,' ..... 2,060
3,409
Z~'575
3, Z34:"
Z~ 39Z
74
Jul.y..
AUg~8t
September; ...
October
.
Nov~mber ...
1,676.. 1,410
1.935'" Z, Z97- ". 1.9Z6
-3,0,71
2,66~
2.. 718 2, 58 5 Z,153
~.'4{H~"
i.'834 1; "~1'
i, i 21 ,
.1,84Z
Zi89Z ..Z, Z7:9
Z, 486. 1,706
Z. 546' 1,480'
Z,473
.1.9'94
Z. 048 . .1, 697
., "7-9' 69
5~a
8'1'
's'f.':
- - -- - -- -- - .' .. - - - -- . - -- Dece.m.' :bei
.. - . .'. . Z,23l . Z,165 ..
.,
",
'
Annual Total. .. J i5, 895 33, 136
i,004'
.3-1--,4-4-0--.-:-, --------'-------.-:--
11 InClu~es expected pullet: ~eplacements from eggs sold .during the preceding.~
month at t~e rate of lZS puliet. chicks per 30-dozen case of...eggs..
.
.1.".
ARCHIE LANG~EY
Agricultu. ral
.S.ta.tiaticia,n
In
Ch
.
ar.g..e.
O'
..... I'
W:~!.A. WAGNER.
.Agricultur~l Statistician
.,
1','
-, !
t
,.. ' . '.' :
..-':. ',' .' '.....:.. ". " . Jl :i .
.
;.. , ,')~ jl. '.~ ",: ,.. ;:: ..,: ::':~r;, .l CHICKENS TESTE~'
<:. .: . ~:. ,.:'" :
. <.
i~.'~
.... ' , : '.!." "\u".
~ .. , I-I~':"":'~:'~ .... , . . -.:
.' "./'"'' .... '.~."':' . !.,;'~. : "".
Gi:ORG'IA:' -InGeorgia 41.5,352 chickens for supplying broiler"hatchidg eg"gi were :.~.. ;,.... '; . tested 'fo'r'p'ullorum disease during November 1959--7 percent"<~ore
than the 388- .136 te' sted in November 1958. Testi~ngs of egg-type chickens for November were 21,355--18 percent less than the 26, 186 tested.inN.Qv~mber
last year.
.
;
UNITED STATES: The number of chickens for supplying broiler hatching';eggs
'j (: . ' " \,' :.:' tested during November totaled 2,.673,057--down lO:.pert-e'nt: fr.9Q1. November 1958.- Testi"ngs July through Novern~e:r of this year, totaled':' .... ,
p.,..3.92~: q29--down 5 percent frain the testings during this periodin 1958.. The-:
t~.Ef~i~gs .of chickens for other purposes (egg-type) during November ,totaled" .' " "
2,025, .586 compared with 2,388,479 in November 1958--a decrease of 15pei"C:ent
The number tested July through November 1959 totaled 6, OIl, 207--down 16
percent from the number tested during this period in 1958.
'..: :
:
:'.\ .,'
,
..
.
This ;report is made possible thro~h the cooperation t;> the National Poultr'Y' j
Improvement Plan official State agencies, the Animal Husbandry Research ,,'.. '
Divisi.on, Agricultural Research'Service, and the Agricultural Estimates D'ivi '.
sion, Agri.cultural Marketing Service.
.
, ':
"
Month
Georgia - Chickens Tested by Official State Agencies
,.'
For Broiler. Production
: Egg Type Chickens
By Months 1958-59: 1959-60
Cumulative:
By Months
1958-59- : 1959-60 : 1958-59 : 1959-60
July'
Aug. Sept. Oct.
Nov. Dec. Jan. Feb. Mar. Apr. May June
:
: 253~865
245, 365,
253,'865
245,365: 30,299
: 240, '30.2' . 357, 1,7,2
494, 1.67 603, 137 : 42, 581
: 413,264. 512,3~5
907,431' 1,,115,462: 35,652
: 458,442 370, 146 1, 3'65, 873 1,485,608 : 41',043
: ;388, 136 415,352 I, ~ 54, 009' 1, 900, 960 : 26, 186
: 432,318 564.491
. oi: :
2, 186, 327 2.750,8.18
84,778 : 34. 194
: 482,212 : 400,437 _ : 275,275
24~,097
: 253,013.
. ~ .. : 3.233.030 .
... . 3, 6.33,467
, .'
3,90~,74~
.t
,. ~, 150,809 < 4, '403. 82'Z
, : 5. 280
;
4,994
: 6, 779 ..
.
S,.56 i
:' 25,032 ..
40,259 19,898 15, 187 65,138 21,355
.. ...0...--
United.States - Ch~ckea!? Test:ed by Official State Agencies
~
-
-
~'-'
- -------.
-~
; Month:
ifor Broiler Productibn by Months 2/ -
; :
!! y For 'Egg 'J. ype Chickens by Mo~ths
1958-59'
.. . . 1959-60 ..
July ": . l, 628, 129 '
1, 537-,073
Aug" _, . ',,' Ii 599, 159
Sept.
2, 650~'308
Oct.
: 3, '12 5, '447
Nov. : 2,95'4, 061
Dec.
: ~, 801,459
Jan.
: 2,601,927
Feb.
; 2,3'63,505
Mar.
2,320,302
Apr.
1, 9'30, 848
May
1,647,'255
June
: 1~ 609~ 452
.. 1,919,301
~ ".
2,377,31~
2,885;886
'2, 673,.051
,
.
' .,
'.
~
,,
1/ All States e'xcept, Ohio.
2/ Revised.
:
1958- 59
:
:
:
500, 558
602,' 00 1
: 'I, 269-., 046
2,358,549
: 2,388,479
: 2,497,300
: 1,658,650
771,225
4.28,393 ..... 270, 594
:
253,846
328,077
\
I
:
1959-60
.
443, 57~
587,827
1,006,977
1,947,238
2,025, 586
I
,
\
I
G,IE:(Q),~GllA (C~(Q)fP> ~lEJP> JRTllNCG SI&~Vll<Cl& S~Ul~~TIRAVITECERUSDLIETTPUYA,R;RAOTLFMGEEEXNOTT~E..GNOISFAIOAANGNRSDIECTRU~HILECTIUI, ERE\rD~ EC 2
1
'
'lGIA ._
59
U. S. DEPARTMENT OF AGRICULTURE AGRICULTURAL MARKETING SERVICE
ate EXTENSION BLDG., ATHENS, GA.
Athens, Georgia
I
i' .
1
GEO~GIA- COMMERCIAL VE
December 18, 1959
Lr
TABLE CROP SUMMARY, 19581959
GEORGIA: The value of Georgia's 12. principal fresh market and processing vegetable crops and melons listed in this report is $14, 800, 000 for
1959, an increase of 2.5 percent from the 1958 value of $11. 855, 000. The increase was due mainly to higher prices receive'd for most major grown
vegetable afld melon crops compkred with last year. Watermelons accounted for 30.5 percent of the total value.
ANNUAL COMMERCIAL VEGETABLE CROP SUMMARY. 1958-1959 Fresh Market and Processing
Crop
Year
Acreage
Yield
HarvesteJ Pe.r Elcre
Production
Price Per Cwt.
Value
Acres
C(..,t.
1,000 cwt. Dollars
1, 000 dol.
Beans, Lima
Beans, Snap South Ga. i3 ~ans, Snap North Ga. Cabbage South Ga. abbage ~orth Ga.
.C, antaloups
~orn, Sweet
1959 1958
1959 1958
1959 1958
1959 1958
1959 1958
1959 1958
1959 1958
Cucumbers Early
1959 1958
~ucumbers
Late
Lettuce
1959 195'8
1959 1958
Onions
1959 1958
~
Tomatoes
Watermelons
1959 1958
1959 1958
:potatoes, Irish Sweet Potatoes
1959 1958
1959 1958
4,500
~ 2.0
4,700
22.
3.600
16
3, 900 j 19
1,2.00
30
1,300
28
3,300'
100
4,200
100
500
100
600
110
8,000
40
9,000
55
2.,600
30
2.,300
31
800
32
700
30
250
36
300
2.7
2.50
95
'2.00
90
700
90
800
90
9, 800
42
13,000
45
49,000
80
63,000
85
4, 500
51
4,800
46
13,000
47
11,000
48
90 103
58 74
36 36
1/330
r/420
50 66
32.0 495
78 71
2.6 2.1
9 8
24 18
63 72.
412. 1/585
3,920 1/5,355
228 2.2.2
611 52.8
9.70 8.00
7.30 7.30
8.40 8.30
1. 40 1. 45
2.45 1. 40
3.80 2..50
4.50 3.75
4.60 3.40
5.20 5.20
4.05 5.70
3.55 3.40
4.25 2.75
1. 15 .55
3.46 2.62
4.70 5.00
873 82.4
42.3 540
302 299
420 508
122. 92
1, 216 1,238
351 266
12.0 71
47 42
.97 103
224 2.45
1, 751 1, 196
4, 508 2,200
788 581
2,872. 2,640
TOTAL FRESH 1959 102,000
MARKET
1958 119,800
xxx
1/6,2.55
xxx
i7 8, 074
xxxx xxxx
14, 114 10, 845
TOTAL
1959
6, 100
xxx
PROCESSING 1958
8,400
xxx
xxxxx xxxxx
xxxx xxxx
686 1,010
TOTAL ABOVE 1959 108, 100
xxx
CROPS
1958 128,2.00
xxx
xxxxx xxxxx
xxxx xxxx
14, 800 11, 855
!! Includes some quantities not ma;ket~d ~~d excluded in computing value.
ARCHIE LANGLEY Agricultural Statistician In Charge
L. H. HARRIS, JR. Statistical Assistant
'.
ACREAGE.AND VALUE OF GEORGIA VEGETABLE CROPS
ACREAGE 8 Y CROPS
__
i
Watermelons 45.3%
1/ Includes
"weet corn, cucumbers, lettuce and onions
,.
----
VALUE OF PRODUCtION BY CROPS
i
\~
%
~
('\
Ioi
~ UI
U'
o ~
?~o
~~.
.. e~~e~o~
~~"
1/ Include8
S'"weet corn, cucumber
lettuce and onion.
.....,.,q0~,
.afJlIrJ I
t:.,0
~o
0;,-
II)IIl
~~o
Q."
-'Ill III
'tn
United Statea Department of Agriculture ,Agricultural Marketing Service 319 Extension Building Athens, Georgia
C~~",~ICIAL BUSINESS
Postage' and Fees Paid U. S. Department of Agriculture
....
'rr",
."
'\
. "~.~... (,"
3/S
-, \-.
...:. ~'.':~<.::~~: -.. . ..~: ;..~.
I~"'::~~ <G]g<Q)~tllA ClR{~IP~ff
.
'..
.
1rllNG~'SISJ~Vll&JE .
AGRICULTURAL I!XT~NSION SERVICE
;"~'7-..j'"",NIVERSITV OF GEORGIA AND THE .;',:;' ;~TAT~ DEPARTMENT OF AGRICULTURE '
.~~~ns, .~~~G~ .. '..
. ,. " ...~.
JAN 4 '60
LlBRAR~ It. S
U. S. DEPARTMENT OF AGRICULTURE""'-'
AGRICULTURAL MARKETING SE~VICE
311 EXTENSION BLDG., ATHENS, GA.
I' ,
,
December
..........
1
,,_.
8, .... .
.'.1..95'.'9-
,I,'
':'. '.' ,: _
. GEORGIA ANNuAL CROP REPORT .~ 1-959.
r;: . :: _.,I..,:~':\
,:.~A~~ 'G~~~' QRO~ g~. - ~~. v~ue ~i 'th'e"~inc1~al crops' Pr~C~9 in",Q~or~:a".::.
.......:- ,- " _ , : , , during 1959 ier,estimated at $371,584,000,' or one percent
.. ~boVe the:' 1958 value of $367,606,000. The increase was d~e primarily to 8-.'tttQe~""
~. l8i'ger cotton crop together with a mOderate increase in the production at tobacco'
, ~nd. slightly higher prices rece'ived tor,'::to.bacco. Corn 1s Georgiais-most' valuable.. ,
: ctop with.. s value at $94,l?5,OOO, followed, c10s811 by cotton (lint and .seed:) .at " .
$93,524,.:000. The tobacco crop ranked third at $64,083,000, and, peanuts' tourth at ..
'. $~9,2>;~. These tour crops accounted tor ll1.2 percent .ot the total :value; of: .....
~ll crops..
" , -"
,' DOW AmpE mLOO PER ACRE: Unfav~able:'weathel" conditio~8: that plagued ,'.t~~..:.~ ..
i
".'.
crops at. various times during the growiJ1l and ,,' .
.:,l1arvesting. 'seasons reduced yields below the 1958 re~o~,d yields. The 1959 yield'S' , :~t corn" cotton, peanuts, and tobacco have been exc~eded o~y by lAst seasoD While .
,ojbeans for. beans, cowpeas fQr peas, sugarcane sirup, sorghum for grain, and .all
hay set new record high Yields.'
,
" .clEatoIA CORN PRODuCTION NEAR ROOORDz Production or corn at 81,2.09,QOO bush~ls is .
. :.
:
'.
the largest ~n the hist~ry of,the State with
.:...the,.. excePt10n of the record crop of 86,752,000 bushels produced in 1958. :. Frequent
. rains during September and October delayed harvesting ope~tion8 and damaged the ,
<tuality and reduced,yields in many area~. Cotton production is 49 p~cent. ~,O'\T...,.
~ast' season but 20 percent below the 1948-57 averag~ production. Pea.cb and p~
'. crops :
dropp. ed
bel,ow. ~e. .' 1958
production 'but
were
above
th.e . ten-year
average,
: ~'..
". to
..
,
,.
.. \"
,. ,.~ ,: VAWE COMPARISONS TEN MOST DrlPoRTANT' diWps' FOR 1959 and 1958
" .,
-'10. "
',' ,'"
.....
,Rank Crop.
IN ORDER OF RANK (IN mOUSAND "DOLIARS)
"f' ! 1" '5
t!
1
I
.1959.',
~ - ~ - 1959 . : -~~ -
1958. Of''.!:,Rank Crpp
. 1.1..
.'
. f ...
$
$...:1958:... '
.. ":,_ L:..,
'.'
1959' .". ,', '. .
1959 19,$8. %.of $ "$'.' 1-9%8
- ~_._.~
.-
~ -,-------'-"--
'1. Corn
...94,195 106,705:', 88' 6.. Peeans ,...
. "12,.2-2; ,12,900,~ .9> '
2. Cotton & Seed .~3,524. 70,450' 133 7. Com. Vegetables 1:l~lhO' 8,634" "129<
,). Tobacco' .. 64:,083., 54,2)4, "U8 8. Peaches
7,358 8,494 87
4. Peanuts'
50,266 64,962' 77 9. Oats
. .6~447 7~~51" '-a4 .
. S. Hay'"
":.'..:(.J4,.9~ .."
17',435' "
..
86'
lO~ Wheat'
"
':, 4,059
3,'0.31.
~~4' ,~
.
~ " . _,' .. j ~
':'1 ';
.
'" r
VALUE OF ~ODUCT~~ BY CROPS ;;. 1959
..........
" ......
'.
_... ......_......
'. '
.;..0--..... .,.
iO'
..
.. . ......
:~ '.,
" . " .'- .....
. ..
"
',r ':
: ' -"f . ' -
, I
..r' '
,
P ,
e
a
n.
u
t.s
~, L
. 'f ~~ .'; ..: .;
.~~\~' ) .. .4..
,,~
"'1
. rz.'> .~dp' ,
,~~
,
'. .
a.olC
lCo~r.:' ~~<1 ~
.~
'..
..., 1
, :.' 'I
., :'1
).
,:,1:"
CARL O. DOESCHER
Agricultm'al Statistician
!
',.
I
I
I
/
ARCHIE LAHQLEY Agriculteal Statisticlim
In CMrge
~,.~~;-
Crop ,
I,
.f
.'
GEORGIA ANNUAL CROP StHtiARI 1/ 1959 AND 1958
:
: Yield:
:
: Unit
. . . . . . :Iear :Acreage,: Per. Acre: Unit :Production : Price
1,000
f
f
f
acres
'1;000 do;.
: Total
.: Value
1,000
dol
90tton Lint gj
1959 658 1958 381
383 Bales 443
I~
5 2 5 .~.~ ;, '.. ~5 , 515
352
.366 .. 63,308
Cottonseed
9<>rn, All Purposes
Sorghum Grain
." ...: .
f
':. .~... ....::).
Wheat, Harvested..
Qats, Harvested
~Iotatoes, Irish
1959 .
1958
1959 2,874 19~ 2,711
1959 . 39 1 9 5 8 . 'Sr:r
.'::1~995~98
l11O. ,. '.,.69-,
.,
1959 .21b
1958 276
11995598'
4.5
4;8
Tons
216 36.80 7;9\9
144 49.60 7, 142
28.5 Bushels "81;909 ~~.,T~;1~15 '"94,195
32.0
86,752.... ' 1.23-. ;,106,705
25.0 . Bushe1B:::. 915 .~ ~1.10 1,072
24.0
- :;', ' , .. 888, ,1.19 '... '1,057
26.5 Bushels. :2,255'.' ('1~86:i" .4,059
23.0 . "......1,587 ." '1.91.' 3,031
'32.0 BushelS
33.0
8,832 .73 . 6,441
9,108.84 . ;: 7,651
~l M.
6
" 222228
3.46
2.62
1BB
581
Potatoes, Sweet Tobacco, All
1959
13
47 CWt.
611
1958
11
48
528
1959 '70.2 --. 1,-5'18-- Po~cl~-- - 106,548
1958 59.2 1,538
'., '. : :'91,074.'
4.70 5.00
.601 '.595
2,812 2,640
64,083 54,234
~YI All
.,I
S,orghum Syrup
1959 531 1958 631
1959
'2
1958 '.' 2
1.08 Tons
. 574.
1.02
.... '.. ..: 641
60 Gallons
120
75
150
26.00 14,924 27.20'' '17,435
2.70
324
2.75 . 41'
1959
Sugar cane Syrup
1958
3 ' 190 Gallons
3
175'
570 . 1.40 798
525' 1.45 . 761
Peanuts, Harvested for Nuts
'U Oowpeas, Harvested
. for Peas
1959 491 1958 ,515
1959
5
1958" . 50
1,125 .1,190
7.0 . '6.0
Pounds
Bushels .
552,375
.091' 50,266
612,850..106 64,962
378 ~_ 4.40 1,663
300" 5.00 '1,500
31 Soybeans, Barwsted 1959 .. 87
for Beans
1958
90
Velvet Beans,~ Alone '1959
90-
,and Interplanted 1958 100
-Iespedeza, Harvested 1959
21
for Seed
1958
16
~ine, Harvested
.for seed
J...
1959
7
1958, c 7
Crimson Clover,
1959
13
; Bar. for seed.
i956
26
~scue, Harvested. 1959
7
for seed.
1958
7
JY Peaches, Total
Production
1959 1958
16.0 Bushels .12.5
1,050 'TOJ1'$ .
1,060
. ' ..
205 Pounds
1~0
800 pounds 820., .. '
105 Pounds
135
190 Pounds 215
Bushe'l& :,"
1,392 1,125
"47 53
1.95 2.05
35.00 37.00
4,305 ' 13.00
3,~
12.90
5,600
4.30
5,740. 5.00
1,365 3,510
25.50 24,50
1,330 1,505
3,200 4,000
i6.50 15.00
2.40 2.25
2,714 2,306
1,645 1,961
560 392
241
287
348 860
219
226
7,358 8,494
Pears, Total
1959
Production
1958
Pecans, Total
1959
; Production
1958
'Bushels Pounds
85
98
39,000 45,000
1.40 U9 1.30 127 .314 12,225
.287 12,900
CamDercia1 Vegetables ~
1959 90.6 1958 112.4
11,140
'
8,634
'MAL ABOVEOPS 1959 5,372.3
..
(exe1, acreage of' 1958 4,978.4
371,584
367,~
peanut hayI truits
~
price and value~gures are prelimfnary. y cotton~1int y.1e14 in po'
_ Cov'ers o~ mature crops(acreage alone and interplanted) harvested. for peanuts,
JY ~ and beans.
Includes Sem8"quantities not marketed and excluded in <XIJIPUt1D8
. 2/ ~
Does not include sveet potatoea and Irish potatoes
..
.;
-:"1
..-.. ' ...~ '.'. ~ ',', . I ,,' '
"",
,"',
't, ,
':, ,:, ':'
':l:, ,: \.~", ';, ':,.. :'; ,
' 3 I.I.:e;-"
GE,~~GnA ,CiRq'~1F;P,O~1~~~.Sm:~vn:c~
AGRICULTURAL EXTENSION SIRV,let ' ..-, , " "
~"T'AN-ITVI~RDSEI"TYA("#TG"ENO~R,GMIA
A~ 1'HE , AGRICULTU1E
,
p.:.C
'~,~,, 5~
//;',: "U"/I. OEI'A".t~N1'~;AG"ICULiURE
" ," A'G'"'I,CE:XUTL.T~UtfOtNAL8:L~ROKGE1'',A(HT'HGSEE"R.VGIACE.
Athens, Georgla io!,' " '"
----- . . ,..',''Ti\lis Summary 04. pc.tu1.try
, I Itl"J.
' " .,
, .
il)for,-mat-.to,~.on
'December 18, 1959,
,'!
, ' ,
hatc~,ry production, poultr' y
"
",
slaughter. egg production,' 'pertinent p:rice'-~a~ ~n~ end-of-month storage stocks
is being furnished you in a condensed form to enable' you to nave a ready, current
reference;,'
, '~ '," I I
1
, .... I
......
.;
,~i
.
POULTRY SUMMARY. 'NOVEMBER 1959
, ;, .~
. -,
' .. :ltem
;
',I, ;';
J
_. 'D'urina Nov. % of -' Jan. th.rouah, Nov.
.. , ;. 19S8!j--
:.1
,
,,
...,
1"59~ la~t. '
yea'r
- 1958!J 1959Y
'. '.
'
'
'0 of
last year
" . Thou. ' ,Tbou
Thou. ' Thou'. ", Pet.
. . . . . .>
~-
'Chicks Hatched by Com-
mercial Ha~,cheries:
''
,'
. B'railer T'ype ':' " Georgia' ,~
. . . -~ ! ..... - -, ,.. ... _ .... - -
~
., .:: .> ,
Z2.966 ' . Z3, 1
"
'''''2 L.r.1\
I
,~o ..,
,Egg"Type, , Oeoz:gia~ .
,1 I,, . 1, ZOO" ' ,; 451
United States
16, Z48 " 13,473
r
'h.'
. , - "
--
',
",
'
'
l Z88, 183 2'97',92t> 103 1.672.265 .'1: 676. 553 100
'.
10,,969 , 15.222 139 576,776 53Z~ 001'" . 92
'~Co~mercia~'Slaughter :!J.,
, YO\1ng Chickens
I ' :Ceor gia ~',
..
.
U .
ni
t
e
d
S
t
a :
t
e..s
,..:..'Hens an'd' C'ocks
.' '~. ','oeo~sia .
United State B
,"Egg Produc'tion
19,877 111,911
484 13.647
Mil ...
~~ ,
I,
I
I' .
20,046 ,-101: 266, ZSl 114,217' 102i, ~.40~. Z59
"
~ , .,: ~
., " ~:
'
271 1~
lOS'
10Z
1. 5QO, 888 107
58" 13,827 . Mil. "
lZZl
1011
I
I
I
I'
3,92. 9
'.:
",'.
5 , 2' 4.5
133
Mil.
' ,Mil .
" I'; ,..Qeorgi,a
, '4/
, ,', "South Atlantic-
"'. United ~States
120 51-i 4.925
130 l0i
530 10 4,745', 9
1,Z37 5,609 55,414
1,.447,. 117 6,~34'\ 111
56,820 103
" Il:;Revised. Z/ Preli~inary. 3/ Federal-State:Mar'ket News Sery,i.ce--For,the
;purpose of thTs repo'rt a, c'ommercial' poultry slau;ghtei" plant is defin..e.d al a plan!
which slauihters a weekly average of at least 30,000 pounds live weight while in operation. (Converted from weekly' to 'monthly basis,. ~ 4/.' South Atlantic states:
DeL.; ,
Md., ,
Va., W. Va-.. ,
,
l"
N. C. ',. S. C .. , Ga., . ..Fla,..,
'
.
- _t. ..., ....
i
,'1
:..t
,'" ; .r",
;
..~-.
, :'.
. . MID-'MONTH
FRICES
RECEIVED
ANP
'
!
P
R
I
C
E
S: ,
,p "
A
I
D ;
,
..
"
. ;'
.- , '
j '_.' ,i .
,
Oeorgia
Unite:d States
..
. ,Item
"
"
I
Nov. 15 oct. 15 Nov. IS Nov. 15 ' Ott. IS' Nov. 15
'
......,co .--
1958 1959 Cents Cents
1959 Cents
1958 Cents
1959 - 1959 Cents Cents
Prices Received:
:>
..,~.
,~ j
....
J"
, p\
~
.'
,,,
,,
"
Farm Chickens(lb) Com. Broilers (lb) All Chickens (lb)
All Eggs (doz)
15.0 15.0 15.0 50.4
11.5 14.2 14. 1 41. 3
1Z.5 14.0
13.9 43.1
12.0 15.8 14.9 38.9
9.3 15.0 13.6
31. 6
9.6 15.0 13.8 31. 3
Prices Paid: (per 100 lb) Dol.
Dol.
Dol.
Dol.
Dol.
Dol.
DToUer grow. mash Laying mash Scratch grains
4.95
4.70 4. 15
4.bO 4.70 4 .10
4.65
4.65 4.05
4.88
4.38 3.87
4.69 4.36 3.85
4.72 4.34 3.94
-.-..---.--_. ._-_.- ... __
.. -._---_._-----.. __
-._--~-_.-----------_._._----
For this project State funds were matched with ~~ederal funds received from th~
Agricultural Marketing Service. USDA. under provisions of the Agricultural
--._- M-.-a-r-k-e-t-in_g._A._ct-._o.f.1946. ..-----------..._--------------------._------------
End.'6fo:-'Month Stocks of Poultry, Poultry Products, Meat and Meat'Pi'od~~ts,
:.::.' .~
United States - November 1959
"
.
\ \ '. : i .
J
Shell' e)Jgs: Decreased by 163,000 caseSj November 1958 :decrease 'was 67.,000
caseSj average November decrease is 238,000 cases.
'
Frozen e~as: Decreased by 23 million poundsj November 1958 decrease was 20
, millon pounds; ~verage November decreas~ is 24 million pounds.
. . ..
, '. ~
Frozen poultry: Decreased by 33 million p'oundsj 'November 1958:decrease ,'"vas
31 million pounds; average November decrease is 4 million pounds.
'Bee'f:, Increased b/6 million, p'~'~ndsj'November ,l?S8 increase was 21 million
: ," pound,sj average Novemper increase is 34 million pounds. ' ,"
',Pork: Increased by 31 million pounds; November 1958 increase was 50 million - pounds; average November increase is 73 million pounds.
Other meats: Increased by 4 million pounds; November 1958 increase was 1 minion pounds; average November increase is 6 million pounds.
, 'Commodity
"ot
j Unit
INovember Nov.ember 1954-58 avo 1958
October'" November!:
1959
1959
., .
"Egg',st: ,',
i
Thou.
Thou.
Thou.
Thou.
I
I
, She'lL'.......... Case Frozen eggs, total. .. Pound
325 95,474
140 73,403
469 119,355
' 306 '96~ 341
Whites . . . . . . . . . do.
29,340
26,674
28,696
24,635
Yolks........ do.
Z3,361
20, 144
29,640
25, 323
Whole or mixed.... do.
38, 142
24, 356
55,445
41,515
Unclassified ..... , do.
4,631
2,229
5, 574
4,868
Total eggs~~case eq.). "
CO.s,t.::
----------------------------------------_.
2,795
1,998
3,491
2,745
------------------------------------- .. _..
Pou1try~ fr~zen:
Broilers or fryers.
Pound 23,794
30,635
26,467
25, 826
Roasters
.
do.
8,531
8,354
8,389
8, 842
Hen's," fowls . . ',' .. do.
70, 354
83,910
79,993
85,964
Turk~ys
Ducks
" . do. '.' . do.
179,428 9,704
207,845 7, 545
220,370 182,088 ,11,640 ,:,,9, 214
Unclassified. .,.. .
.
T~tal poultry. ...... . . . . .
Beef: 'Froz~n, In Cure 8 cured.
do.
39,961
38,946
37,752
39,659
.. .... ---~-----_ -~--------------~----------_
. .. dO'l 331,772. ,'" .377,235
...
3 "
8
-4. ~,.6
1
1
351,593
_-----------.----~------------------_._
do. r
. .;
161,981
''i 58, 636
162~665 169,085
Pork:
Frozen
.
In cure or cured. .
do. .164,469
do.
84, 395
129,481 54,957
141, 120 43,705
165, 773 50,004
Other meats and meat
products
.
Total all red meats., .
do.
70,405
75,641
73, 127
77, 5eO
do. ri --4-8-1-,-2-~-0-----4-1-8-,-7-1-5-----4-2-0-,-6-1-7-----4-6-2-,-4-2-2--
!! y Preliminary.
Frozen eggs converted on basis of 39. 5 pounds to the case.
ARCHIE LANGLEY Agricultural Statistician In Charge
. j ''J"
,t
R. R. HANCOCK - W. A. WAGNER
Agricultural Statisticians
,"
...
~
,,
l'.' J,
dEORGI COMM'" ERCIAL VEG
\IRTllNCG S[~vn<c[
u.
S.
I
DEPARTtENT
OF
AGRICULTURE
AGRICULTURAL MARKETING SERVICE
'1; EXTENSION BLDG., ATHENS, GA.
\-
December 18, 1959
,
I
OP SUMMARY~ 19~8~1959
GEORGIA: The value of Georgia's 12 principal fresh market and processing
I
\ vegetable crops and melons listed in this report is $14,800,000 for
i959, art increase of 25 percent from the 1958 value of $11, 855, 000. The
incteq.se was due mainly to higher prices received 'for most major grown
'" vegetable and melon crops compared with last year i Watermelons accounted
for 3v:,5 p.\ ercent of the total value.
ANNUAL COMMERCIAL VEGETABLE C'ROP'SUMMARY, 1958-1959 Fresh Market and Processing .
Crop
Year
Acreage 'Y\eld Harve steu Pe,r 1-\ ere
Production
Price Per Cwt.
Value
Acres , I Cwt .
1, 000 cwt. Dollars
I, 000 dol.
Beans, Lima
Beans, Snap South Ga. Beans, Snap North Ga.
~abbage
South Ga. Cabbage tI0rth Ga.
~antaloups
Corn, Sweet
Cucumbers Early
Cucumbers
~ate
I
Lettuce
\
~nions
1959 1958
4,500 4,700
1959 1958
3,600 3,900
1959 1958
1,2qO 1,300
1959
3,300
1958
4,200
---
- - ----
--
1959
500
1958
600
1959 . 1958
8,000 9,000
1959 1958
2,600 2, 300
1959 1958
80P 700:"
1959
Z50
1958
300
1959
250
1958
200
1959
700
1958
800
20
90
22
103
16
58
19
74
30
36
28
36
100
100
--
--
100
110
1/330
1/420
- ._- -.,.-
50
66
40
320
55
495
30
78
31
71 .,,,,,.
32
2'6
30
21
36
9
27
8
95
24
90
18
90
63
90
72
9.70 8.00
7.30 7.30
8.40 8.30
1. 40 1. 45
2.45 1. 40
3.80 2. 50
4.50 3.75
4.6'0 3.40
5.20 5.20
4.05 5.70
3.55 3.40
873 824
423 540
302 299
420 508
122 92
1,216 1,238
351 266
120 71
47 42
.97 103
224 245'
<.
Tomatoes
1959
9,800
42
1958
13,000
45
Watermelons
1959 1958
49,000 63-,000
80 85
412 1/585
3,920
1 IS, 355
4.25 2.75
1. 15 .55
I, 751 I, 196'
4, 508 2,200
Potatoes, Irish
1959 1958
4, 500 4, 800
51 46
~weet PotC\.toes
1959 1958
13,000 11,000
47 48
228
3.46
222
2.62
611
4~70
528
,5.00
788 581
2,,872 2,640
TOTAL FRESH 1959 102,000
MARKET
1958 119,800
xxx
1/6,255
xxxx
xxx
118, 074
'xxxx
14, 114 1.0, 845
TOTAL
1959
6, 100
xxx
PROCESSING
1958
8,400
xxx
xxxxx xxxxx
xxxx xxxx
686 1,010
TOTAL ABOVE 1959 108, 100
xxx
xxxxx
xxxx
14, 800
CROPS
1958 128,200
xxx
xxxxx
xxxx
11, 855
!! Includes some quantities not marketed and excluded in computing value.
ARCHIE LANGLEY . Agricultural Statistician In Charge
l
Al
L. H. HARRIS, JR. Statistical Assistant
"
ACREAGE AND VALUE Ci' GEORGIA VEGETABLE CROPS
ACREAGE BY CROPS
~-
~
~....
n...
~
.III
~
Wa.termelons 45.30/0
1/ Includes ~weet corn, cucumbers,
lettuce and onions.
~~
0\' fJ~
Il.l.'..0. ..
~o~
co
GJ
E
3
.~...
;GJ
'1)
..---.-/'/
VALU_E__ O:J' iPRO__D___UCT10N BY CROPS
\::..
%
~
o
"~ UI
U' -J
?~o ."t'J ~0'f)6
.. ~1."",e
~'bo~
1/ Includes S"weet corn, cucumbers, lettuce and onion.
C~ b
.....,.,0
fJlfI
.a
1
t-.;0
~o
0;,-
~~
~~o ~~
~~
~(\
"
~
United Sta tea Department of Agriculture Agricultural Marketing Service 319 Extension Building. Atbena, Georgia
O~~""'IClAL BUSINESS
Postage and Fees Paid U. S. Department of Agriculture
..
-
-- - '- --
( I . ..,~ "'\.1 -
~. ~E,ORGIA IS :3 CROP REPORTING SER VICE
I, :
/ ..-::::'
I "\ \V' r ' ."JJ'.\ '\f " ,'\"tT ''', """i<-J......':"]"{.' ""., .
~ ~ ..,
...
" :::
1'..1'.
,I .,:
' I~.
I' '" ' ',: " ", , , ,
'! '," ' 0, 1." ' ' " ~ :~
p<. ': \:' "j'. r \f .s (' ,
;i:'i~\<,1/''~~;f,J'~'/--"
'
,"...~,;i":'',.-~:',~;:\',~.,"'"('':'(;/~"\',I.:.'".~'
I
j
'
:'
,( -:."
.,1,:"
:'.7' '.
:
.t
/~ ..:-..J," "':
r':1." , \. " " 1 : /:1 ,,',,'
..:.
'
"J;
.
''1.' '~':""'r\'" '0:
'
i,
'
' r ':
;.'L-J:"Jr~'
.
,.:
\" ':\ il"',f"f
,:."" .~..- J' .
~:L~" ~\" t: ", .$;~~-'"
J ''.:.' ."
. .~1
. UNfViR3JT;;Grn";;l
~ I, Released: llll3/59
-------.-_ .. ...__.__l.<._~~...~ 1<-....' <'\
'
,
,
'\---
..
, .";0"
~
I~
GEp",~GIA'~C'. ,H~C~ ~A,T.~. ~~~Y R~~O~'7:
"Ml4 '60
~:: .,J .,,' ('1.:ir~', .~ ' " . ' ;
,
,
':--- Athe;ns, :da; ,,':' J;>~c. ~3, ':' - ',A':~~~al o...,.'5;~,b4~~~ Q.OO 'btoi--a1r .c~i~ks w~re p~aced
wi~p 'producers ;in Cieo:':-gia during the week ending Dec'ember 19, according to the
oqo Ge~)l:gia .Crop Repo'rting Service. This compa~e8 with the 5, 506,
placed the
p'r'~vious: week and)~ l percent less"than the 5,} 734,.,9QO pla,ced the soi\.ine week
">'-- ' lastyear..:' ~ .'
,
~:'.
,:': _.:,:.: <::.-'
:';~,"'"
';., '
~\:-, ,.'~ ::~' >::.. ;.:;. . :,~. ' . ,
Eg~s set by Cieorgh\ hatcheries amounted to '1, 9l3~ 000' compared with 7:"~~5, o~q t,he:pre,vious week and is Z percent less than the 8, 09l, 000 for the
c0t:l1e
spqriding.
w~eJ;t
.
last .
y_e.filr.
.. ..... . ' .
...'.., . '...
..
,.
~. "" .!
l
. : " to
,.
"
,.
,
Th~':majority: of th~:pz:'iCespa~4fo.;-.G,eorgia, pi':O,Q.(l~e9,~at~liing Ef.ggs wer~
....LeW'.l'te.d;w~b{n.a :~~~g.,e:o.f QO t9. to e~~s.'.With,al1.~.:,~!erag~'q!. .951'Ct;!n~l:! fo.~ all. ,,~
h~U'chingjeggs~and Q3 cents for eggs pu'rchased at the farm from flocks with
h~t'chery:()wn~cl cOGk~rels. Last week the range was from 60 to 70, cents with
aila.verage of 16,4, cents fo.r all hatclihig' eggs a.n~,62c.ents,.for eggs -pUrcha~d at
th'e farm; from flocks with hatchery owned cockerels. Most prices '.charge~ for di1.cks:',wer:e r~ported within ~ range."of $10.. 00 to'$1l,?5w~than av~rage 0($10.50
perhu~.dt~d.. compared'wi.th a. 1;ange ~.($9. 00 t?' $1 L.Z5.witb an.average- of $10. Z5 '
pe~: hun4~ed la'st w~ek; T~eav,erage;::pr'ices la;st year, were . ~7c;ents (or e'ggs,.,
and $1 L 00 for chicks.
ij
I", {
..
'.:
:
..
.:
'!
.
"
,.
.......
.
. . Weig~~e~ a.yerage price [rom the .Federal:-:State 'Market NE:,'Fs: Se.tvice for
broiler's ,during the:' week '~ding DeceQlPer I 9'.,was.C'eorgia 6roi1:ers~ l 3/4 ," :
3.'3/4 pounds ~t ~a..rms 17.19-f. ~. "
" ."
.
," ' ..:", i.
~
We~k
Ending
~ "":
GEORGIA ;EGGS SET, HATCHINGS, A NO"CHlCKPLACEMENTS '.;
.- --'
I ..
...,.'
,,
j....
I
:
:.:,BROILER TY.PE-
.
ka6 T'YPE.
I
-/" , . . j
r~
Eggs Set II
Chicks Placed for . ,.. " Broilers in Georgia
Eggs ICh~Cks Set> Hatched
18'-r 1958," : 'i9.59 ~~~\ -1 <'58 '. , ,: i;959 ,:-:"'-I~i ~~;~ . 195~: I 1959
l
I ,. T,hou.
~ I ' . ':.
T. h. ou.
~~;~~~~~ !h:ou., ;: Thou'-," re~c~n~ ~T~o~:.
::97:'" " ,
Oct. 17' 7 ,:;l34,. 7,000' ,.
5,'017 :,:'4,'500" ." 89
'."'1
:15'0
Thou.
y ...
~"163"
Oct. l4; 7,:Z39' 7,138
99 5. 034 ': 4, 80Zo'
Oct. 3 1' , 7,,\394 ;< 7,l67
98', 5,121' " 5,080
No"... 7"'
Nov.14
...~ ~:t,:549'--7- '7; 455 ~ .
,
I
,
: . 7,:595 ' 7,501",
..-.;,,-7,9. '_.--.- '5, 0-7 05"".4;1f 05l"'
. 9'9 . 5) .916 '. 5'-0 54'
95
99 '9-9' : 10-1
155. ..143 110 '. 210 '1,.0 ' 113 148 "116
s
Nov.ll Nov.l8
7,'5l4; 7,69Z 7,83l 7,633
102 5,196 5,173 97 5.320 5,40Z
100 lOl
90 l67
Z1
8l 108
Dec. 5 7,4l0 6,396
86 5.388 5,381
100
79 III
Dec.ll
8,146 7,865
97 5,Z55 5,506
105
244
77
Dec. 19
8,09l 7,913
98 5,734 5,64l
98
311 ll5
II Includes eggs set by hatcheries producing chicks for hatchery supply flocks. 'EI Revised.
ARCHIE LANGLEY Agricultural Statistician In Charge
W. A. WAGNER Agricultural Statistician
------------.---------------------------------._-----.-_._-------_._------
u. S. Department of Agriculture
Agricultural Extension Service
Agricultural Marketing Service
State Department of Agriculture
319 Extension Building, Athens, Georgia
'
.
."
.~
-----.-------------------------------------~-----~-~~--~-~------~----~---
..
.
EGGS SET AND CHICKS PLACED IN COMMERCIA1" AREAS. BY WEEKS - 1959
Page Z
:
0
..
-
Week Ending . ,
r'
. STATE .,
Dec. ,5
.
Dec. 12
Dec. 19
Nov.
Nov.
Nov.
Dec.
Dec.
Dec .
}, ]'
14
2~.
28
5
12
19
f
,
EGGS SET - THOUSANDS
-
.
i CHlCKS PLACED - THOUSANDS
Maine
1,242
1,359
1,446
975
934
931
912
891 1,012
Connecticut
703
827
844
435
462
426
420
378
404
P.ennsyivania
1,069 1,425 1,425
702
760
664
600
847
664
Indiana
1,308 1,478 1,739
628
583
524
576
628
571
Illinois
165
202
258
99
92
92
77
106
101
Mis'souJ'\ DeJaware
1,421 I, 514
1,746 1,899
1,690
1,949
557
629
648
676
695
644
I, 506 1,664 1,790 1,904 1,,747 1,840
(
Maryland
3,066 3. 587 3,635
2,092 1,838 1,908 2,OS3 2,234 2,170
Virginia
1. 157 1,952 1.908
840 1,011
976 . 1,024 1,056
987
West Virginia North Carolina
249 2,278
283 3,641
225 3,677 .:.
489
402
414
401
346
368
2, 190 2,28~ 2, 173 2,354 2, 506 2,597
Soutq Carolina
471
505
501
318
317
324 . 328
348
348
GEORGIA
6,,96 7,865 .' 7,913
5,054 5, 173 5, '402 . 5,381, 5,506 5,642
Florida
'312
344
381
150 . 148
.ll0
148 ' P7
198
Alabama
3,262 3, 519 3,579
2, 591 2,674 2, 587 2,772 2, 711 2,770
, Mississippi
2,'580 2,954 3,014
1,793 1,791 1,903 2,030 1,944 1,996
Arkansas
3, 147 3,765 3,673
2, 815 I 2,813 2,.962 3, 192 3, 140 3,021
Louisiana 1 _Texas
382 1,825
524 2,370
556 2,738
279 . 30Z
292
358
290
319 "
I, 508 1,:60.7 1~ 646 1,771 1,725 1,74.8
Washington
275
334
404
282'
282
259
282
319
281
I
Oregon California "
284 1,338
421
3~Jl
1,469 , 1,547
157
140
130
204
I, 172 1,097 1,096 I, 142
171
188
960 1,042
TOTAL 1959
..
. TOTAL 1958
34,444 39,644
42,469 44, 156
43,493 42,982
26,632 27,009 27,267 28,605 28,725 28,911 27,651 28,426 28,811 29,306 29,:967 30, 579
.
.
1959 % of 1958 .
87
96
101
96
95
95
: 98
96
95
,"
..
..
f-oI l:ti
0
~
fil
~
>t
~
fil :I: U foe
~
>t
....1
::t::
fil fil ~
/s
lGJE(Q)IFR<GllA CCIFR(Q)]P ~IE JrllNlG Sm:lRVllC~
'::' _ ... ' . ,. vI" Oi-/~IA ' : ,.,. ' : ' .
' I ' ,'
G~IPU.LTURAL EX"TENSION SERVICE : '
NIVERSITY OF'GEORGIA AND THE.
JAN 4 'SO
u. S; b'EPARTMI!NT' 0" AdRICULtUR~
AGRICULTURAL MARKETING SERVICE
STATE 'DEPARTMENT O~ AGR,eULl'U'-E
' ..' .
.' It. EJ(T.'.... IO~ BLDG., ATHENS, GA, ..
Athen-S, Georgie. . ' .':: '\1 .:II~' ,.' 'LI~RAR .' . ':., ;'.~ .",' " 'December 23, .1959
.. ~n ...'. '.
,"
.:
'I~l.
......
rES ."'.E. ~r:: . '. J.. .
' , ' . ' ::. "'r.
GEORGJA,..~ 1959 PIG CROP 'REPQR'1'
. ' ,;, ..:..
. i ..~:.'
.
.' ,. : ..,. .. ; .
-I
'-
RECOOD
FALL
.
PIG
CRO. Pa:Gndeo.rigs..iat"' hj.seIV1,.9la59r,'gtea; sitlloptigreccoror' dp):1tsh.e~sGtiemoartgeida
at
1)306,000' .~",eB. .d :,',
,
.
Crop Reporttlls" . ',:."
8eriiee sai~d today. The 1,3~.~;m ..pigsl'saved this tall is 3 percent large~ than
the. 1958 tall' pig crop, whicl;1.. ~Q1:8~~~ 1;267j'0Q0 head';and is near~ 20 perC!e~t'. .
~bbv~ the 1948-57 average tall crop' ot 1,092,000 pigs.,.
'..... ;,,: :.."
,,:..
'; ~:.;, .'
.,
\
' " t
: , " : :', .t" ;
.'
....
J
A total of 195,000 sows farrowed this tall)" an' increase ot 8 perce1'1~. tram :,.. !
the 181,000 that saved' per litter
farrowed during the tall ot
from this .fa11's farrowings
1958. The average number.ot. was 6.7, down 4 percent from
pthieg' s'
.,.
1955" average of 7.0 piijS. per 'liiter. '
~ .- ' :'
. . ;.
. I :'t' : .:'., . ".} '" .
...
'. . .. ;.'.. '
. 'Georgia I s 1959 spring pig crop of 1; 787:, 000 :combined with the fal,l cr.op of
1)3~,'OOO head gives a total 1959 crop 'of 3}093,OOO.pigs which is the h!ghe~1i'6f
ree6rCi. :The 1959 crop surpasss ~he previous rEtcord.. of .2,778;000 set in 1955"bf
more t);lan' 11 percent . Georgia now ranlts 9th' in: .the)United States in prbduction,'
of pi~s compared With a lOth re.nkl:ng in 1958. . ..:.;.... .
..
: . . >......,
1960 smnqa INrENrIONS DOWN: Reports on breeding lnte~tions indicate 'that '231;'000
.
sows will farrow during the spring season
(December 1959 - May 1960) on' Georgia farms ... =ct'(b)1~se intentions are realized,
the number of BOWS farrO'td,na this spring Will .be. l~ 'Percent less than during the spring of 1959, but 17 percent above the 1948-57 '~verage of 197,000 sows.
: ./. rl
... j ~ ~
" .
,:
"
:::. ~.
.
! . '.
.
.,.,"""',rtl'liH/rfh./illlt4ol'I>.u.._ ..HHH" '''UI '''.H'.II11't<..III1 I''.''''''
_ ".ff.Il11I1t".."")II'.II'm.._' " _"..fIf ffIlIllI1WIll' U
",,,,,., ,,..,,,.,,...,_J::.
.
i' Aoknowledgement is made to the Pos1mastera, ~al and Star i" '
I !t
Route Carriers over the state' leotiDg :the basic intoJ1ll&t1on
to~ their assistanoe 1ft -001_ from whioh these estim&tes
I
.i were mad~. The splendid cooperation shown "by !Several '. l
II thousand ot their P",:trons who ful'Dished reports tor their' !
indiTidual tams is also appreoiated.
"i
I !
.."HI"
...
"'ur.'.'."'IIIfHfN'''''''''''"I'....''''"Utl/"l'''/'''....
'1'~l. yUl.,.'''It'.''.I''''' tl..'.I''' '''..J~' .. ,jl'~''''I:..
,Io....""",11011I.,,,,....1/'11"""'''.11'''''''''"'''''''1,.,.,.10(.,,"1."........,.'..,/,..,,,
.':.' . I
:.
Y .';
BCMS FARROWING, PIGS PER LIT'i'ER, AND PIGS SAVED} SPRmO AND FAlJ"
'J ":,'
GEORG,I.A 1948 - '1960
:,,:
. Pigs. Per Litter
Spring.
:"F~11
um er ; -
Pigs' Saved
. . Spring Fall,
-. '"
) o head -
I...
Yea;r
.
,
.' .'
"
... 19.46
170
1949'" "'182"
1950
198
1951
208
1952'" , 220
1953' .:.'" 178
1954
194
,'
."
163
5.9
. 6.1
1}003
994
1',991
173
6.1
'. 6.1
1,llO 1,055
2,165
190
6.3
'.6'.1
1,247 1,159 '.. 2,4:06
205
6 ..1
. 6.3
1,269 1,292 "':'2)56... 1
172 138
6.3 6.'5.
.., ..
6.2
6~6
1,386 1,066
' . 1,157
911
.. 2)452
. 2",068
159
' 6.7
6.5
1)3.00 1,034
'2,334
1955
200
165
6.5
1956
212
172
6.8
6.7
1,300 1,106
2)406
6.7
1)442 1,152
2,594
1957
212
174
6.8
6.6
1}442 1,148
2,590
1958
229
181
6.6
7.0
1)511 1,267
2,778
1959
259
195
6.9
1960 gj 231
6.7
1.,787 1,306
3,093
Y Spring} December through May; Fall, June through November.
gj Spring farrowing indicated from breeding intentions reports.
SEE REVERSE SIDE FOR UNITED STATES REPORT
ARCHIE LANGIEY , Agricultural Statistician In Charge
, WILLIAM E. KIBLER Agricultural Statistician
;:..... 'OJ ,; '.'
bRlTJi:D 8'lNmS ])E~.1959 PIG caoP'REPaRr
"
.. ,
The 1959 pis crop totaled 101.6 million heed, 8 percent more than the 1958
~rop of 94.5 lIl1ll1~ hea4. ~s;year'. crop _s the Jargest siliCe the record
3.21.~~~~~~ heac1 prOduced' ~n ,l943. ~;:.pr1ns ~8"~ at 58.6 1I1ll1.~>.~~,
).2 pet-'cent- trail that ot 1958; 'and the tall crop oti.:,4.3NO~011l1ODwas up ',a;.pe~~l},t.
~ 1~~,1n the, sp~ '\~QPI.resultec1 tl!Clll an in~ i~ the number. ~~;"~~~
tarr~~i ..,~1ed With a Bl1sbt increase 11i pip save~, per litter. . I': ':I.:k'/;')
,
,_ ....... :....... ' .~'., ' .
.... ~ ..:
.
~~"~~r;''''
' " '\ ...lrJ ~$"r.f\ 1'(1
.'t..Be~rts on breed1na 1ntentions 1M1eate 7,310,000 sows to farrow 1.,i.~. ,':,i,>tlt;\
,pring at 1960, 12 percent les. thaD the number 1'arroW1DS last spr!D8. If the..
lntentiona materialize aDd ~ .DuiDber of. pigs per;. Utter eq\1a1a the lO-year
,ve,rBoP with an allowance tor upward trend, the i966' aprins~pi'g .~ vbuld be ap-
1F 0o hX e,1 :"..J .1:",D .9, -:a :5. t9.8<qq."r
52.0 mill1
1ng .crop
0
n
head.
A crop
at
this
S1Z-8, woUJ4 . 1.1 percent,." :~:~
'.' .';,..';:.::;:.;,;:.):.'.. " . ... .";:., .:..:...:;_>_.".f,...,.:.".
PALL' CROP up., 2 PERCEN'l: The n\1lDber ot pig. eav8cLduriug the tall ot 1959. '.. '.'
.
(JUDe throDSli November) .;1s estimated at 43,029.,00Q.:~
4ead. ~s 18 2 ~rcent larger than the 1958 taU crop and 21 percent above tbe
194&-'7 1"all averaae.. The 1959 tall piS:-arOpwaa the third largest ot r.eoor4"
qe1n6'''eX~ 'on~"1n 1942 and 19'1-3. 'D1e :mQ'ber ot sows tarrowiOS 1D _ .~U~::)"
of )959' 18 est:liDatec1 at 6,168,000 ~, 5 ])8rceDt more than tarrowed'''j,;n:the.(;~a.u:.;.
qt 1958 aDd 16 perce~t above average. P1ss saved per l1tter ~verage4. 6.28.a8; ~.
pared W1~~ record hiGh of 7.17 piGS .perlitter in the tall of 1958. .
,.
. '.
. I.
:t;"~:"~.)':):~',rl
:~,'::'.
;, '.
". I , .i '-'< . . " , : . : ','
..,) r:' , . .'. :'.J".~f. r.
y . ",.~.....
,~S,Q.m.".P.AB. R. aolniJ,
PIGS .
PUERNILTrEirillO ''E-R~~ ~''~~ ;AP' 1.~I. "'O-: S:gS~u AAUD '
'8PRmJ
.,
AND
PAU~
',. .
'n::':""l:
:. :.. 'f " ....... -.1,.
. (;',':'
. -':. ;.,
:r,,~';: ~. r/'~~; '.,1.0
I te8r.::J' :~~. la~~ll
~z:r:L1~I':
Spring
Pigs saved
: Fall
: "Ye~;;~,'1"
:;.'.': ' .. ~ 1,000~ea4. ,... ;. '1' N\lDber ~"
-. " .1,000 head
.) .! . . 't ...: . ' .
"
r ~ .
..~ ,
\,
~,.;" 7,-a3:f~:.:'. 5,070 .' ,~ 6.44 6.,e'~ ..:. 50,468 33,358
1949
8,820
5,568;" 6.46
6.5~ .~.. 56,969
36,275
'f" ....,:...'.J'~ l
'.8933~:'~~~'-."'
1950
9,179
5,927' 6.31 6.65 57,958 39,423
97,381
1951 1952 1953 1954 1955 1956
1957
98,,438114~'
''J ~5,,'9~~7~
. 6.46
'.. 6.64
.7,045 .... :,4~.,
6.80
'7,669 .". 'f"5,0 i 6.89'
8,359 :. . "5,586
6.90
77,,6m65
5,194 5,J.21I.
6.~
7.12
6.60
6.65
6.69
...66~':i8)8.
7.00 7.06
61,298 55,135 47,94Q' 52,582 57,~ 53, 51,812
39,288 33,69'f. 29,974 '33;978
,3368~' 032896 36,l48
100,586
..
8778,9,~
86,830
95,719
89,572
87,960
1958 1959
'.7,428 '8,282
5,883 , 6,168
1960 Y7,310
7.~ .. :.;r.~.. 52,336 7.07 .:~. . 58,607 7.'10 " . Jj52,OOO
42,'163
-43,029
;: 9",411-9 . 101,636
~.WilDS, December tll"l'OUih 1\IBYi Fill, June ~o~ -November.
: I ~ 7: ',:.
gf 'Spr1rc tarrowing iDd1cated from breed1ng,~j,~ten~1ons reports.
iI,.A;"er:ase n\1lllber ot pigs per 11tter with allowance for trend used to caupute
.~ .f~cated n\lllber ot spring pigs; number roUDdecJ to nearest 500,000 bead. ,\'p.i
'i;l~:l :';~f:j::;iG;: ~',.;:s:r=:; ,:"; ,~", '" ~.;' :: \ :~.:
.l..~J"');1\)"
..... t.
. "","..;'to.\-.'.~.....
'7.,
'.J."
,
I.........,,,..'..t~-.;..1~..:,.:.J....;...~".,"a
,.".
.
I,' j'
J
"
_ i"':J..,.t~":":fJ.';~'.;. 1
j'~1 .... ~,_ .. ..,
-'loU ..'.:. ... lJ
.~../.:..'.._
.
.
'.~
,t.
-2;'().
..,
()'
:.:.:,.l
":' ..,i, I::.'~...:',. '2 ::.. ;:, 5C"L~1~J'
.,"~:... :::
.. .... ... -.r..- .... .... '" , ..-.- - - -
A 1 4~.&;,.-': ..;s.":It:""
. P ... ,;;
J.
'
p,.
.-'
: 'p'
-.,
(l~~:': '. ~? iJ~"" , ..
i:.i.-.:. :
.r
"
'.!. !',
f t1 ~ \.". 't
.~~; (:
,;.I.y
~
~" t',
'"
~':f.:\:\ . (
"
,\".<
"
,.,,~. ,.:
'''.,.
"-
.'
'1
',
I:
0;'" 1
l'!f'\ "
..... '~'i 10'-. .
: '0', '. ~
':~;~,;'.~ .-
D',.\... ~
.
Y~E'.r.
i3:: ~~~l:
;":,:.('.1.
". ::; ......; '.::)12!.
.
:;. i."'( ~.:~ ',p~ ...\.:
::,,:. g~ \~~:
." '\"
"
0'" ;.
':1\'
+
;"-:~"IJ
d
-":1' ,!---;.
/ ~' .
\, ,,;,\ . .., (t
~,.,...-..."", ~-~ ~ :~ -' -,tI [I ;;.' ~
','
'~I
I \\'"
~/J,
,-', ....
~~
I (,
,,~
'> ... ,"t,_ /,,, ".
,'~ 'J :,'.lJ ....
.....~~~; .. " 1\ ~~.\
"
"-
_
.. \.
,t'.. '...\.,,, I...; ...
l.~f, ~,.,t- ~\~ ,~'~I
t
f..
'. "- t \~,,.
- ( "-
~
~~~.~-..'' Z_
~\_-
3 IS- GEORGIA CROP REPORTING SERVICE
\;V EEJ< LY
r.r r I J I
-
r
1\,
I
J~r Jr:~J \Jj
UNIVERSITY OF GEORGiA aeleased: 12/'30/ S9 ;
~..x::s.r---'"
....
GEORGIA CHICK HA TCHER Y R~POR T
JAH4 '60
1./BR/fRIES
Athens, Ga., Dec. 30 -- A total of 4, 824, 000 broiler chicks ~ere placed with producers in Georgia during the week ',ending December 26, ac.cording to the Georgia Crop Reporting Service. This compares with the 5, 64~, 000 placed the previous week ilnd is 11 percent less than the 5,404,000 p1aeed the same
week last year.
Eggs set by Georgia hatcheries amounted to 8,062,000 compared with 7, 913, OO~ the prev~ous week and is 3 percent more than the 7,844,000 for the corresponding week last year.
The majority of the prices paid'for Georgia produced hatching eggs were r~ort~~,~_~~in.a~~ng~ of 60 to 7Q ,c.e~t~ V!i~h an,av~raU,J)f.~~.S~p.,ts_.for_.all hatching eggs and 64 cents for eggs purchased at the farm from flocks with hatchery owned cockerels. Last week the range was from 60 to 70 cents with
an average of 65 c:;ents for all hatching eggs and 63 cents for egiS purchased at the farm from flocks with hatchery owned cockerels. Most prices charged for chicks were reported within a range of $10.00 to $11. 25 with an avera.ge of $10.50 per hundred compared with a range of $10.00 to $11. 25 with an average of $10. 50 per hundred last week. The average prices last year were 64 cents for egg,s and $10. 50 for chicks.
Weighted average price from the Federal-State Mar.ket News Service for broilers dU:ri~g the week ending December 26 was Georgia broilers 2 3/4 .' 3 3/4 pounds 'at larms 16. 13~.
Week Ending
GEORGIA EGGS SET, HATCffiNGS, AND CHICK PLACEME'NTS
EROILER. TYPE
~
.. - ,
EGG TYPE
;
Eggs Set !!
Chicks Placed for Broilers in Georgia
Eggs Chicks Set Hatched
1958
1959
1959 Ofo of 195'8
1958
1959
1959 ~o of-1958
1959 1959
I _Thou. Thou.
Oct. 24 , 7,239 7, 138
Oct. 31
7,394 7,267
Nov; 7 7,549 7,455
Nov.'-l4- -, -1. 595 ,', 7,50 1
Nov~21
7,524 7,692
Nov. 28
7,832 7,633
Dec. 5 7,420 i 6,396
Dec.lZ
8, 146 7,865
Dec. 19
8,092 7,913
Dec. 26
7,844 8,062
Percent Tho..u.
99 98 99 99 .
102 97 8Q
97 98 103
5,034
5, 121 5,095 5,016 5, 196 5,320 5,388
5,255 5,734 5,404
Thou.
-4,802 5,080 5,051 5,054 5, 173 ,5,402 5,381 ' 5, 506 5,642 4,824
Percent
95
99
99 ~ ..lO'l
..
100
102
100
105
98
89
Thou. Thou.
155 143
110 210
140 113
148 ' 116
90
82
1161772_1
108 III
244
77
321 125
255
88
1/ Inclucies eggs set by hatcheries producing chicks {or hatchery supply flocks. Z/ Revised.
ARCHIE LANGLEY Agricultural Statistician In Charge
W. A. WAGNER Agricultural Statistician
u. S. Department of A.griculture
Agricultural Extension Service
Agricultural Marke1.a.l1g Service
State Department of Agriculture
319 Extension Building, Athens, Georgia
.------------------------------.-----------------------------------------
.
-:;.~ 7
: ~ ",
~.: ~ ~ ~ . ," ' . :. '0
' . . .
:-
EGG~ SET AND CHlCKS PLACED INo:COM~~CIALA~EAS,
. "".
.'
.- I
~!
...
'>- ~ : 11 - ...:. . .
..-:. .
,;; '. Vi : ~,
eek- En$~g
.. : , .... :., ~ ''':; '~. -
'.;.
BY WEEKS -
1959
" ' Paile 2. '"
-l .\..
'.- -~
~
';.
~
STATE
..;' Dec.
Dec.
Dec.
:.: Nov.\ ':Nov~
Dec,
Dec. Dec.
Dec.
12
19':
Z6~
, :~2J"
,t.. ...;
'\'
,:., 28'
5
1Z
19
26
~;,EGGS SET - TaeUSANDS -;
.. '
"':11 ':M ~, ~: ~:: . ~ ... ..; .
'~H. l.-CKS ':PLACED ~'THOU5ANDS
Maine Connecticut Pennsylvania
1, 359, '~': 827
,::'1.425',
1, 4# - . 1;':H9
844 ' .
~67
1.4Z:5: 1,375
,~ fJ4'
462
760
..
';0
;492361
..:' 664
91Z
891
4Z0 , ;: 378
609 .. :847
1.012. 930
404"', 38$ 664' . 663
Indiana
Illinois
Missouri
-."
Delaware
,Maryland
Virlini~
, - , I. 478' . I. 739..:,
202 :' 258.:
'J.. ; I 746;-
__ :
1 f;9:0';
';f_"
,:' 1,899 . 1.949,,
" 3. 587' 3, 63'~ ,;'
, . 1,952,
1,908 0'
1,772 195 .
1,'\848 1.,:769- .
3Z~:;:.5O7OOC:~
583. 9Z
. 629
1~ 664 1-; 838 1-,017
524 " 9Z
648
1.790
:1,
,'908
~n6
" ~76 77
616 1, 904 1., 'O~3 I. 02;4
. 628 '. l.06
695 1~ 747 2, Z34 I~ 056
571
637
101
75
6~4. 611
,
'.1, '0,"
,
,
'i, 84(}, '. 1.; 5-30
2. 170 Z,140
987 610
)Nest Vj~gi,nia
-Nctrth Carolina
:~~
So~th Carolina
,GEORGLA.
Florida
Alabama
Mississ~ppi
Arkansas'
Louisiana
Texas
Washington Oregon. California
283':
~25-
3.641 ':. 3,677:'
~Zl3'
3,445
40Z
414
'401
346
308: ' ,346-
2,284 ,~. ,173- 2, '354 ,Z. 506 ~, 5'7.': .' ~, Z.75
505 '
501 :'
5~1'
317
324
3Z8'
348
348 ' 314
7, -86 5 " 7 , 9 (3 , 8.062
'~~: 173 5,40Z 5, 381 :,' 5, 506 5.04Z 4;824
344 ~ 381
323~
. -:-- 148
120
148,', 177
198
165
-
3,519 2,954
3,579: :i, 014
3,'129,' 3,059
"
".
'.Z1.':''
6.74
791
?,587 'Z,772., Z;711
1.903 i, 030 . 1,944
2,77-0 1.99-6
2,641
h 843
!
3,765 3,673
524
556
Z.370; 2, 738 -~
334 .~: . 404 .
3,746,. ,555
Z,76-8
j6i,
.~2,; 8''13
-,II
30Z
1.607 -" zSZ
2.:-962 ., 292,
1.646 Z59
3,lcjZ 358
I, 77'1 Z8Z
'3; 140 3,OZl
. ~90
319
;1, ",Z5 1. 748
3-19 j 281
. 2, 770
Z35
1,409.. 214
4Z,1 " '; 39 (: 1,469 ,F I, 547"~
395 l/~~O
... ! i~:
140
130
Z04
1,097 -1.096 ,1,14Z
171: 188
165
:960 1, 042 ; ,l~ 011
TOTA~ 1959 :; TOTAL'1958
42,469 -
44, ,156
~ ::
,43, 49.3~
.~
42,.98:2 ,.
-'f "
." 43, '~J~
. i ,":
41,2,1,9
,
'.
Z7,009 27.267 28. i)O:S ':Z8~ 725 ,za,911' 25,796',
'.
.
I
.
_ ,Z8~ ~'26 2,8,81? 29, "306'~: ~9 96.7 30. 579 . 29,019
1959 V/o of 1958
a
---
',96
101
'10~
95
95
98 ':96
95 r 89
t. ::
(
.. I
.:..
i
/
,. t:; :...-
I" ,-
-
"